. 2022 Nov 19;5(1):1269.
doi: 10.1038/s42003-022-04182-2.

Mito-SiPE is a sequence-independent and PCR-free mtDNA enrichment method for accurate ultra-deep mitochondrial sequencing

Affiliations

Mito-SiPE is a sequence-independent and PCR-free mtDNA enrichment method for accurate ultra-deep mitochondrial sequencing

Darren J Walsh et al. Commun Biol. .

Abstract

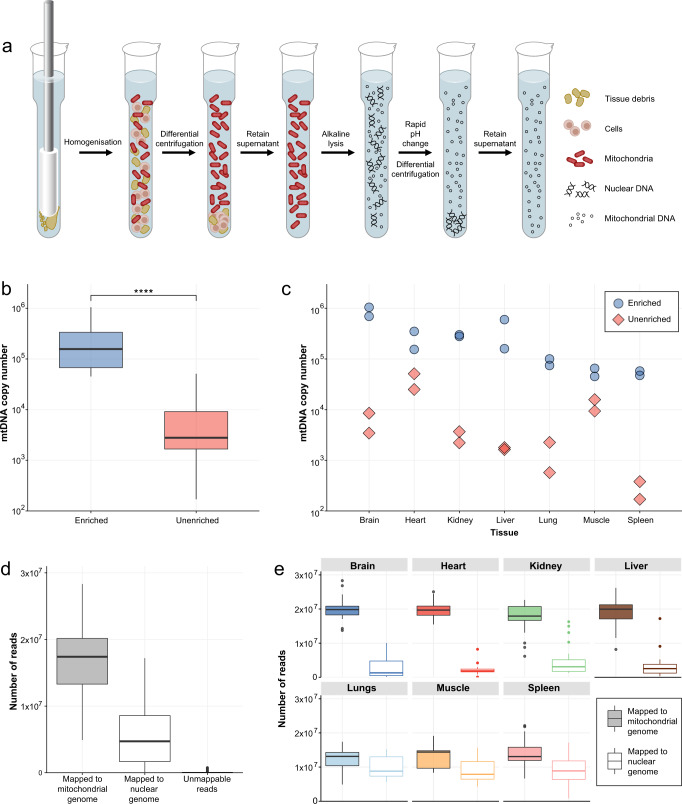
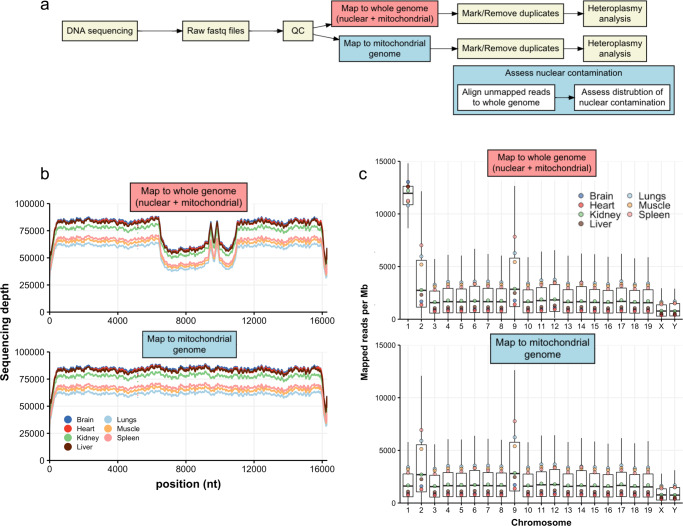
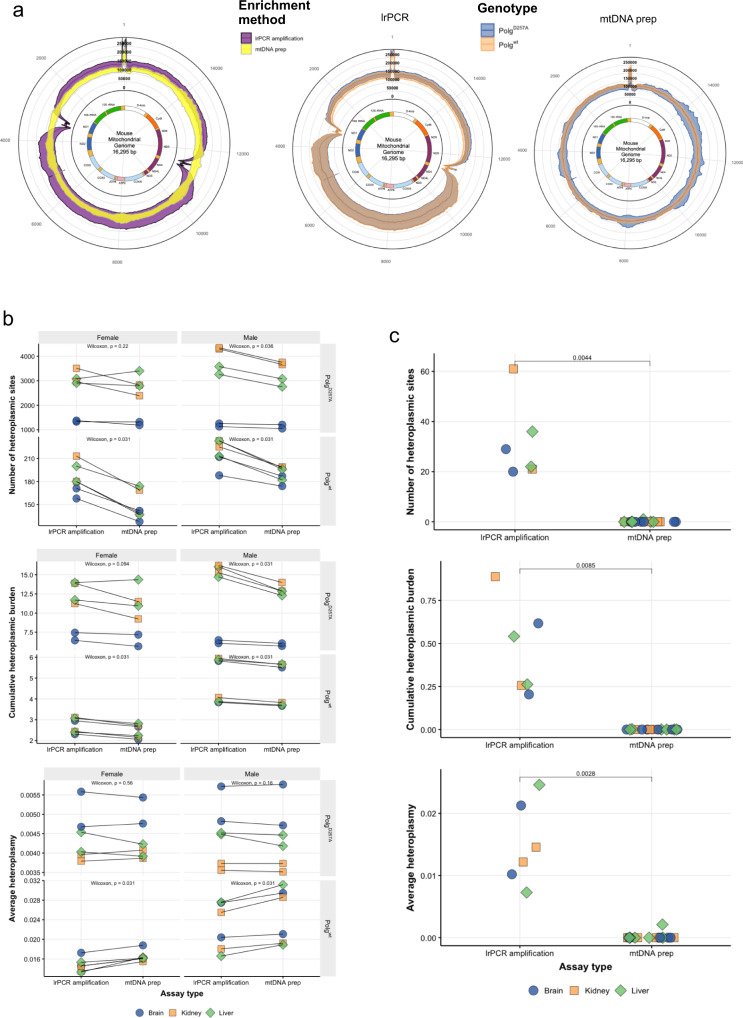
The analysis of somatic variation in the mitochondrial genome requires deep sequencing of mitochondrial DNA. This is ordinarily achieved by selective enrichment methods, such as PCR amplification or probe hybridization. These methods can introduce bias and are prone to contamination by nuclear-mitochondrial sequences (NUMTs), elements that can introduce artefacts into heteroplasmy analysis. We isolated intact mitochondria using differential centrifugation and alkaline lysis and subjected purified mitochondrial DNA to a sequence-independent and PCR-free method to obtain ultra-deep (>80,000X) sequencing coverage of the mitochondrial genome. This methodology avoids false-heteroplasmy calls that occur when long-range PCR amplification is used for mitochondrial DNA enrichment. Previously published methods employing mitochondrial DNA purification did not measure mitochondrial DNA enrichment or utilise high coverage short-read sequencing. Here, we describe a protocol that yields mitochondrial DNA and have quantified the increased level of mitochondrial DNA post-enrichment in 7 different mouse tissues. This method will enable researchers to identify changes in low frequency heteroplasmy without introducing PCR biases or NUMT contamination that are incorrectly identified as heteroplasmy when long-range PCR is used.


Conflict of interest statement

The authors declare no competing interests.

Figures

Fig. 1
Fig. 1. PCR-free enrichment of mitochondrial DNA using differential centrifugation and alkaline lysis.
a Overview of sequence-independent and PCR-free mitochondrial DNA enrichment workflow. Homogenisation and differential centrifugation are used to enrich mitochondria. Alkaline lysis is then used to isolate mitochondrial DNA from any remaining nuclear DNA. b Relative quantification of mtDNA copy number from seven different mouse tissues that underwent enrichment. The mitochondrial DNA to nuclear DNA ratio (mtDNA:nuDNA) was assessed via qPCR. P < 0.0005 Wilcoxon signed-rank test. Log scaled. The upper and lower hinges of the boxplot represent the 75th and 25th percentiles, respectively. The middle hinge represents the median. The upper and lower whiskers extend no further than 1.5x the adjacent interquartile range. c The mtDNA:nuDNA ratio across seven different tissues which underwent enrichment. (n = 2) for each tissue (brain, heart, lungs, liver, kidney, spleen and muscle). d The distribution of nuclear, mitochondrial and unmappable reads generated in each sample is displayed as boxplots (n = 163). The upper and lower hinges of the boxplot represent the 75th and 25th percentiles, respectively. The middle hinge represents the median. The upper and lower whiskers extend no further than 1.5x the adjacent interquartile range. e The distribution of total and mapped reads across seven mouse tissues after mtDNA enrichment; Brain (n = 26), Heart (n = 26), Kidney (n = 25), Liver (n = 21), Lungs (n = 26), Muscle (n = 12) and Spleen (n = 27). The upper and lower hinges of the boxplot represent the 75th and 25th percentiles, respectively. The middle hinge represents the median. The upper and lower whiskers extend no further than 1.5x the adjacent interquartile range.
Fig. 2
Fig. 2. Alignment of sequencing data to whole-genome reference leads to misalignment of mitochondrial reads.
Contaminating nuclear reads are randomly distributed across the whole genome. a Overview of two methods for mapping sequencing data; via whole genome mapping or mapping exclusively to the mitochondrial genome followed by mapping of unaligned reads to the nuclear genome. b The sequencing coverage across the mitochondrial genome of seven mouse tissues when reads are mapped to the whole reference genome compared to when reads are mapped exclusively to the mitochondrial reference genome. A ‘hole’ in coverage is observed between nucleotide positions 7500–11,000 when reads are aligned to the whole reference genome. c The boxplots represent the distribution of reads mapped per megabase of DNA to each chromosome when reads are aligned to the whole reference genome in contrast to when reads are aligned exclusively to the mitochondrial genome. The points represent the average reads per Mb mapped for each tissue. The upper and lower hinges of the boxplot represent the 75th and 25th percentiles, respectively. The middle hinge represents the median. The upper and lower whiskers extend no further than 1.5x the adjacent interquartile range.
Fig. 3
Fig. 3. Mitochondrial DNA preparations outperform long-range PCR amplification and reduce the impact of PCR errors and NUMT contamination on mitochondrial heteroplasmy.
a Read depth across the mitochondrial genome after sequencing and alignment for each enrichment method. The average sequencing depth was higher in the lrPCR (purple) samples than in those enriched using the mtDNA preparation method (yellow). There was a significant reduction of coverage towards the end of each amplicon fragment in the lrPCR samples. This reduction was not observed in the mtDNA prep samples. There were differences in the average sequencing depth between Polgwt/wt (orange) and PolgD257A/D257A (blue) using mtDNA prep (left) and lrPCR (right) methodologies. The sequencing depth of PolgD257A/D257A tissues enriched using the mtDNA prep method showed a region-specific variation in coverage, however, the average coverage remained comparable between both genotypes. This region-specific pattern was not observed in samples enriched using lrPCR. The standard deviations were larger in lrPCR-enriched samples, with one fragment showing larger differences than the other. This was likely due to PCR efficiency or variations due to attempts to mix both fragments in equimolar ratios. b The number of heteroplasmic sites (alternative allele frequency ≥0.2%), cumulative heteroplasmic burden and average heteroplasmy quantified in each sample. PolgD257A tissues had more heteroplasmic sites than Polgwt. There were significantly less heteroplasmic sites observed in mtDNA prep samples of Polgwt males and females, and in PolgD257A males than in lrPCR-enriched samples. This effect was not significant in the PolgD257A females. Cumulative heteroplasmic burden displayed a similar pattern to the number of heteroplasmic sites; significantly lower levels were detected in Polgwt males and females and in PolgD257A males. The difference was not significant in PolgD257A females. Average alternative allele frequency displayed a different pattern of results compared to the previous two heteroplasmy metrics. PolgD257A tissues had lower mean alternative allele frequencies than Polgwt. Significantly higher mean alternative allele frequencies were observed in lrPCR tissues from both male and female PolgD257A mice. Conversely, Polgwt samples enriched using the mtDNA prep methodology had higher mean alternative allele frequency than those enriched via lrPCR. Tissues are highlighted by colour; each line represents the same tissue that was enriched using both methodologies. Statistical comparisons between lrPCR and mtDNA prep were performed using a Wilcoxon signed-rank test. There were 24 lrPCR samples and 24 mtDNA prep samples (Polgwt n = 24, PolgD257A n = 24). Two samples for each tissue, sex and genotype were analysed. c Heteroplasmy levels of C57BL6 wild-type mice using both lrPCR and mtDNA prep enrichment methods. Mitochondrial DNA from C57BL6 tissues that were enriched using lrPCR had substantially higher levels of heteroplasmy across the three assessed metrics: number of heteroplasmic sites, cumulative heteroplasmic burden and average heteroplasmy. Unlike the Polg mutator mouse comparisons, these enrichments were not performed on the same tissues however the mice were the same sex and age at sacrifice. Statistical comparisons between lrPCR and mtDNA prep were performed using a Student’s t-test. There were six samples in the lrPCR group and twelve samples in the mtDNA prep group. The mitochondrial genomes in the centre of the graph were created with BioRender.com.

Similar articles

Cited by

References

    1. Kauppila TES, Kauppila JHK, Larsson N-G. Mammalian mitochondria and aging: an update. Cell Metab. 2017;25:57–71. doi: 10.1016/j.cmet.2016.09.017. - DOI - PubMed
    1. Stewart JB, Chinnery PF. The dynamics of mitochondrial DNA heteroplasmy: implications for human health and disease. Nat. Rev. Genet. 2015;16:530–542. doi: 10.1038/nrg3966. - DOI - PubMed
    1. Gorman GS, et al. Prevalence of nuclear and mitochondrial DNA mutations related to adult mitochondrial disease. Ann. Neurol. 2015;77:753–759. doi: 10.1002/ana.24362. - DOI - PMC - PubMed
    1. Li M, Schröder R, Ni S, Madea B, Stoneking M. Extensive tissue-related and allele-related mtDNA heteroplasmy suggests positive selection for somatic mutations. Proc. Natl Acad. Sci. USA. 2015;112:2491–2496. doi: 10.1073/pnas.1419651112. - DOI - PMC - PubMed
    1. Ma, H. et al. Germline and somatic mtDNA mutations in mouse aging. PLoS ONE13, e0201304 (2018). - PMC - PubMed

Publication types

Substances