. 2022 Nov 19;12(1):19956.
doi: 10.1038/s41598-022-24418-9.

A hint for the obesity paradox and the link between obesity, perirenal adipose tissue and Renal Cell Carcinoma progression

Affiliations

A hint for the obesity paradox and the link between obesity, perirenal adipose tissue and Renal Cell Carcinoma progression

José Preza-Fernandes et al. Sci Rep. .

Abstract

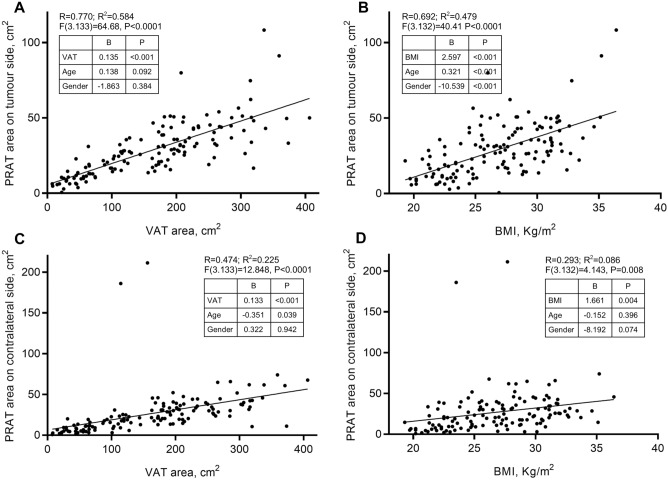
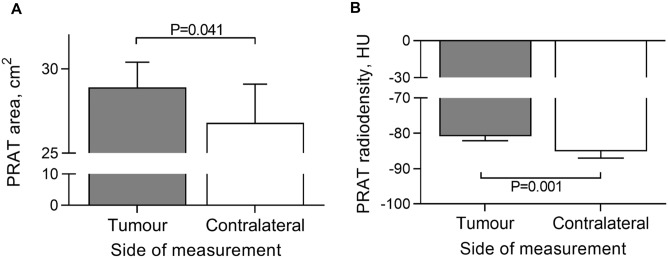
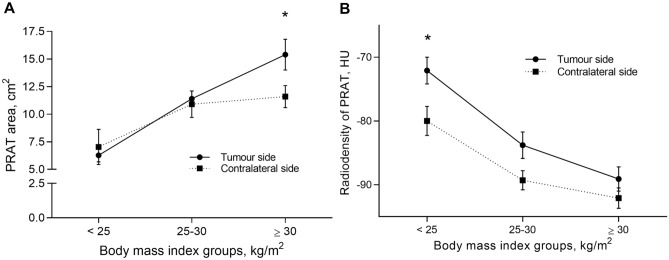
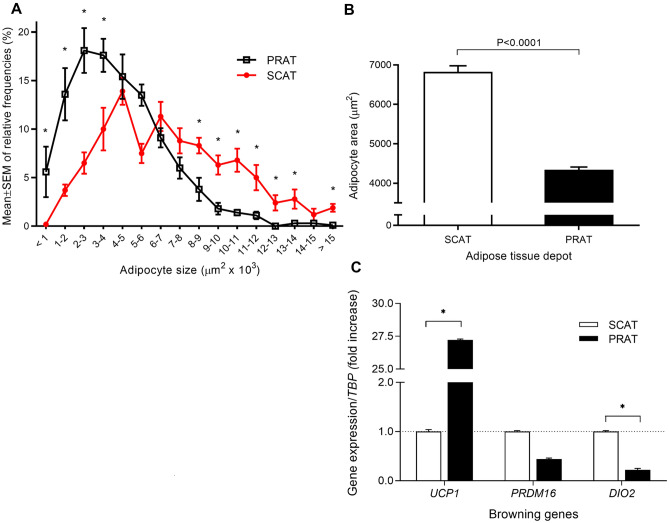
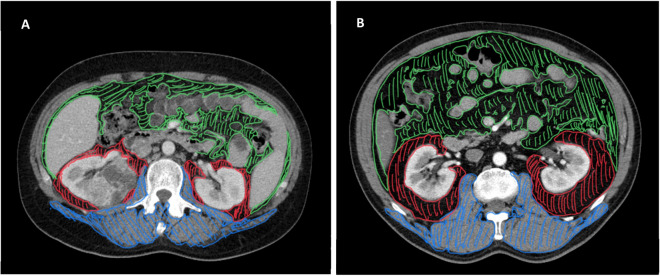
Increasing evidence supports a role for local fat depots in cancer outcomes. Despite the robust positive association of obesity with renal cell carcinoma (RCCa) diagnosis, increased adiposity is inversely related to RCCa oncological outcomes. Here, we sought to ascertain whether imagiologically assessed local fat depots associate with RCCa progression and survival and account for this apparent paradox. A retrospective cohort of renal carcinoma patients elective for nephrectomy (n = 137) were included. Beyond baseline clinicopathological characteristics, computed tomography (CT)-scans at the level of renal hilum evaluated areas and densities of different adipose tissue depots (perirenal, subcutaneous, visceral) and skeletal muscle (erector spinae, psoas and quadratus lumborum muscles) were analyzed. Univariate and multivariable Cox proportional hazards models were estimated following empirical analysis using stepwise Cox regression. Age, visceral adipose tissue (VAT) area and body mass index (BMI) predicted tumour-sided perirenal fat area (R2 = 0.584), which presented upregulated UCP1 expression by 27-fold (P = 0.026) and smaller adipocyte areas, compared with subcutaneous depot. Multivariate analyses revealed that increased area of perirenal adipose tissue (PRAT) on the contralateral and tumour side associate with improved progression-free survival (HR = 0.3, 95CI = 0.1-0.8, P = 0.019) and overall survival (HR = 0.3, 95CI = 0.1-0.7, P = 0.009). PRAT measurements using CT, might become a possible tool, well correlated with other measures of obesity such as VAT and BMI, that will improve determination of obesity and contribute to assess the risk for disease progression and mortality in renal cancer patients. Present data supports the obesity paradox in RCCa, assumed that larger PRAT areas seem to protect from disease progression and death.


Conflict of interest statement

The authors declare no competing interests.

Figures

Figure 1
Figure 1
Association of overall adiposity measures with perirenal adipose tissue areas. Linear regression with adjustment for age and gender, was used to calculate R and R2 between either VAT or BMI and tumour-sided and contralateral PRAT. Association between PRATt area with VAT (A) and BMI (B), and between PRATcl area with VAT (C) and BMI (D). VAT, visceral adipose tissue; PRAT, perirenal adipose tissue; BMI, body mass index. B, B-coefficient from linear regression analysis; P, P-value.
Figure 2
Figure 2
Within subject comparison of perirenal adipose tissue area and radiodensity. (A) perirenal adipose tissue area; (B) perirenal adipose tissue radiodensity. HU, Hounsfield Units. Mann Whitney test was used to compare groups. PRAT, perirenal adipose tissue.
Figure 3
Figure 3
Tumour-side and contralateral perirenal adipose tissue areas and radiodensity by body mass index categories. BMI, body mass index; HU, Hounsfield Units. The Mann Whitney test was used to compare groups within each BMI category. (A) perirenal adipose tissue area (*P < 0.05); (B) perirenal adipose tissue radiodensity (*P < 0.05). PRAT, perirenal adipose tissue.
Figure 4
Figure 4
Adipocyte size (area) and expression of browning genes among perirenal and subcutaneous adipose tissue. Findings from histological evaluation of adipocyte’s areas from each depot (n = 8 PRAT and n = 5 SCAT), using midpower field (200x). At least 10 random microphotographs were taken from each specimen, resulting in a mean number of 160 adipocytes for perirenal and 94 for subcutaneous adipose tissue observed per patient. (A) Comparison of relative frequencies of adipocytes along adipocyte size area intervals, between SCAT and PRAT Mann Whitney test was used for comparison among depots within each adipocyte size interval. Data is presented as mean ± SEM from each subject distribution of adipocytes by size interval (B) Comparison of mean adipocyte area among subcutaneous and perirenal adipose tissue depots, using Mann–Whitney test. Mean ± SEM are used to depict data. (C) comparison of UCP1, DIO2 and PRDM16 gene expression between tumour-sided perirenal fat matched with subcutaneous adipose tissue samples; data presented as fold-change and SEM. *P < 0.05. PRAT, perirenal adipose tissue; SCAT, subcutaneous adipose tissue.
Figure 5
Figure 5
Representative examples of adiposity measures using CT scan. Axial images at the level of renal hilum from a non-obese (A) and an obese patient with RCCa (B). VAT is represented in green, PRAT in red and skeletal muscles in blue. VAT, visceral adipose tissue area; PRAT, perirenal adipose tissue; CT, computed tomography.

References

    1. Berger NA. Obesity and cancer pathogenesis. Ann. N. Y. Acad. Sci. 2014;1311:57–76. doi: 10.1111/nyas.12416. - DOI - PMC - PubMed
    1. Bergstrom A, et al. Obesity and renal cell cancer–a quantitative review. Br. J. Cancer. 2001;85:984–990. doi: 10.1054/bjoc.2001.2040. - DOI - PMC - PubMed
    1. Lowrance WT, et al. Obesity is associated with a higher risk of clear-cell renal cell carcinoma than with other histologies. BJU Int. 2010;105:16–20. doi: 10.1111/j.1464-410X.2009.08706.x. - DOI - PMC - PubMed
    1. Hakimi AA, et al. An epidemiologic and genomic investigation into the obesity paradox in renal cell carcinoma. J. Natl. Cancer Inst. 2013;105:1862–1870. doi: 10.1093/jnci/djt310. - DOI - PMC - PubMed
    1. Song X, et al. Comparison of various surrogate obesity indicators as predictors of cardiovascular mortality in four European populations. Eur. J. Clin. Nutr. 2013;67:1298–1302. doi: 10.1038/ejcn.2013.203. - DOI - PubMed