. 2022 Nov 19;12(1):19912.
doi: 10.1038/s41598-022-24284-5.

Impaired macroglial development and axonal conductivity contributes to the neuropathology of DYRK1A-related intellectual disability syndrome

Affiliations

Impaired macroglial development and axonal conductivity contributes to the neuropathology of DYRK1A-related intellectual disability syndrome

Isabel Pijuan et al. Sci Rep. .

Abstract

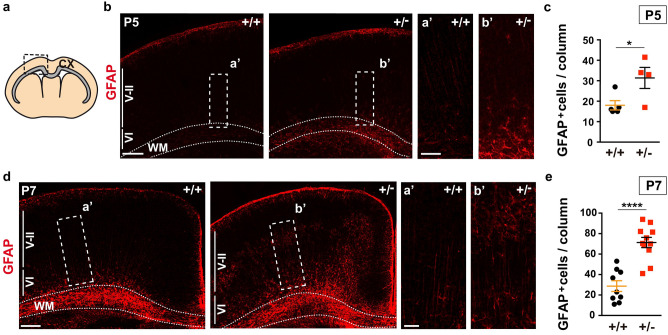
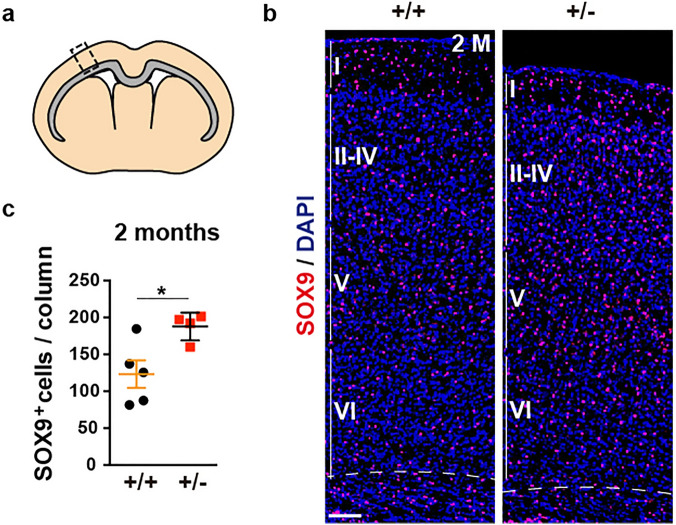
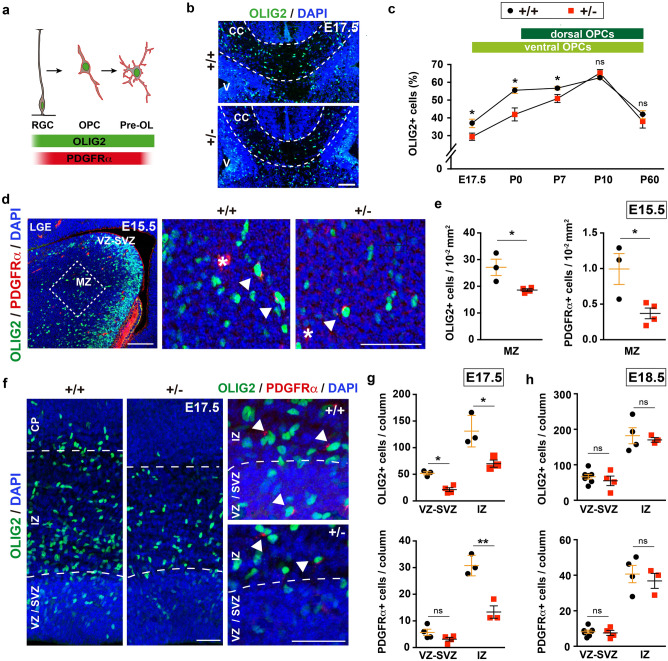
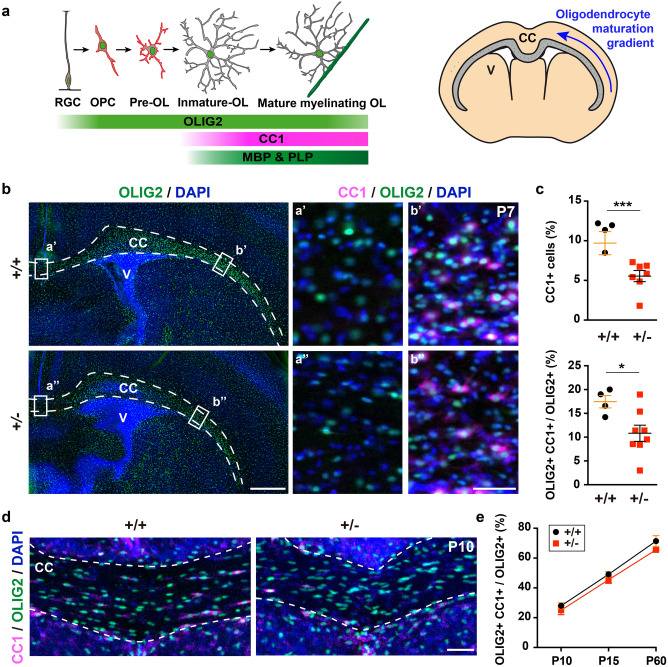
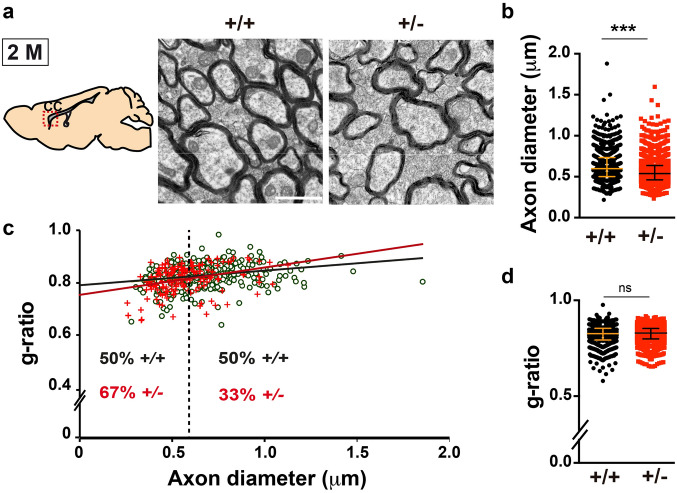
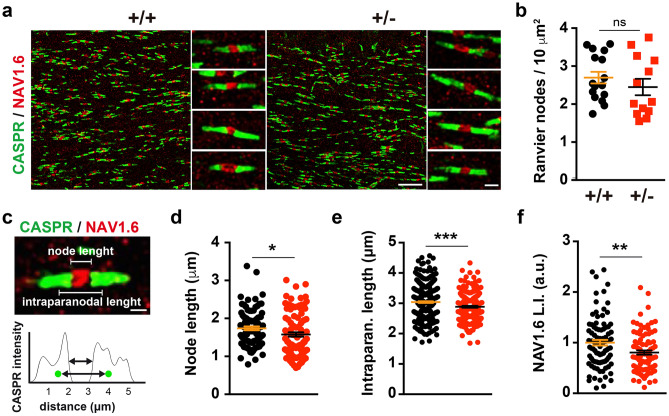
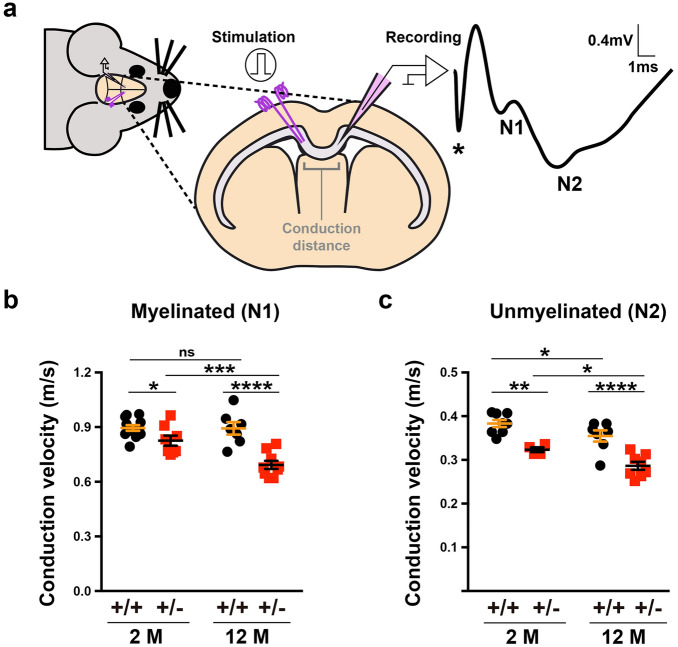
The correct development and activity of neurons and glial cells is necessary to establish proper brain connectivity. DYRK1A encodes a protein kinase involved in the neuropathology associated with Down syndrome that influences neurogenesis and the morphological differentiation of neurons. DYRK1A loss-of-function mutations in heterozygosity cause a well-recognizable syndrome of intellectual disability and autism spectrum disorder. In this study, we analysed the developmental trajectories of macroglial cells and the properties of the corpus callosum, the major white matter tract of the brain, in Dyrk1a+/- mice, a mouse model that recapitulates the main neurological features of DYRK1A syndrome. We found that Dyrk1a+/- haploinsufficient mutants present an increase in astrogliogenesis in the neocortex and a delay in the production of cortical oligodendrocyte progenitor cells and their progression along the oligodendroglial lineage. There were fewer myelinated axons in the corpus callosum of Dyrk1a+/- mice, axons that are thinner and with abnormal nodes of Ranvier. Moreover, action potential propagation along myelinated and unmyelinated callosal axons was slower in Dyrk1a+/- mutants. All these alterations are likely to affect neuronal circuit development and alter network synchronicity, influencing higher brain functions. These alterations highlight the relevance of glial cell abnormalities in neurodevelopmental disorders.


Conflict of interest statement

The authors declare no competing interests.

Figures

Figure 1
Figure 1
More astrocytes in the postnatal cerebral cortex of Dyrk1a+/− mice. (a) Schematic representation of a coronal brain section indicating the corpus callosum in grey and the region of the cerebral cortex (CX) for cell quantification. (b, d) Representative brain images from P5 (b) and P7 (d) Dyrk1a+/+ (+/+) and Dyrk1a+/− (+/−) mice stained for GFAP, indicating the position of the external (V-II) and internal (VI) cortical layers. The boxed areas are magnified to show GFAP+ astrocytes. Dotted lines define the white matter (WM). (c, e) Mean number (± SEM) of GFAP+ astrocytes quantified at P5 (c) and P7 (e) in 1000 μm wide columns expanding layers II to VI. The values correspond to individual animals obtained from 1 litter in c and from 2 litters in e: *P < 0.05 and ****P < 0.0001, Student’s t-test. Scale bars: 250 μm (b); 500 μm (d); 100 μm in magnifications.
Figure 2
Figure 2
Increased numbers of astrocytes in the neocortex of adult Dyrk1a+/− mice. (a) Schematic representation of a coronal brain section indicating the corpus callosum in grey and the region of the cerebral cortex for cell quantification (rectangle). (b) Brain sections from 2-month-old (2 M) Dyrk1a+/+ (+/+) and Dyrk1a+/− (+/−) mice stained for SOX9 and with the nuclei labelled by DAPI (blue). The position of the neocortical layers I to VI are indicated. (c) The number of SOX9+ astrocytes (mean ± SEM) in 500 μm wide columns. The values correspond to individual animals obtained from 2 litters: *P < 0.05, Student’s t-test. Scale bar: 100 μm.
Figure 3
Figure 3
A deficit in ventral oligodendroglia cells during the development of Dyrk1a+/− mutants. (a) Scheme of progression along the oligodendroglial lineage from a radial glia progenitor (RGC) to a pre-myelinated oligodendrocyte (OL): OPC, oligodendroglial precursor cell. (b) Representative images of the central region of the corpus callosum (CC: defined by dashed lines) of Dyrk1a+/+ (+/+) and Dyrk1a+/− (+/−) E17.5 brains stained for OLIG2 and with the nuclei labelled by DAPI (blue): V, ventricle. (c) Percentage (mean ± SEM) of OLIG2+ cells (OLIG2+ cells/total cells) in this region at the developmental stages indicated. The ventral and dorsal origins of the OLIG2+ cells at these times is indicated. n = 3–9 embryos/animals each condition (1–3 litters each developmental stage). (d) Image of the lateral ganglionic eminence (LGE) of a control (+/+) E15.5 brain stained for OLIG2 and PDGFRα, and with the nuclei labelled by DAPI (blue), and magnifications of the region in the mantle zone (MZ, indicated by a dashed box) in a +/+ and +/− brain. Arrowheads indicate OLIG2+;PDGFRα+ oligodendroglial cells and the asterisks PDGFRα+ blood vessel cells: VZ-SVZ, ventricular and subventricular zones. (e) Mean density (± SEM) of OLIG2+ cells and OLIG2+;PDGFRα+ (PDGFRα+) cells in the MZ region indicated in d (dashed box) of E15.5 +/+ and +/− embryos. (f) Images of the dorsal telencephalon of E17.5 +/+ and +/− brains stained for OLIG2 and PDGFRα, and with the nuclei labelled by DAPI (blue) and magnifications of the OLIG2+;PDGFRα+ cells (arrowheads). (g, h) The mean number (± SEM) of OLIG2+ cells and PDGFRα+ cells quantified in the VZ-SVZ or the intermediate zone (IZ) of 200 μm wide columns at E17.5 (g) and E18.5 (h). Values in e, g and h correspond to individual embryos obtained from 1 to 3 litters: ns, not significant; *P < 0.05; **P < 0.01, Student’s t-test. Scale bar: 100 μm (b, d) and 50 μm (f).
Figure 4
Figure 4
Oligodendroglial differentiation is delayed in the cerebral cortex of postnatal Dyrk1a+/− mice. (a) Schematic representation of oligodendroglial lineage progression from a radial glial cell (RGC) to a mature myelinating oligodendrocyte (OL), and a coronal brain section indicating the ventral to dorsal gradient of OL maturation in the corpus callosum (CC): OPC, oligodendrocyte precursor cell; V, ventricle. (b) Representative images of P7 Dyrk1a+/+ (+/+) and Dyrk1a+/− (+ /−) coronal brain sections stained for CC1 and OLIG2, and with the nuclei labelled by DAPI (blue). The CC is defined by the dashed lines. Cell counting was performed in the CC regions indicated by rectangles and the images on the right correspond to magnifications of these regions. Note that CC1+;OLIG2+ cells were only detected in the ventral area (b’ and b’’). (c) Percentage (mean ± SEM) of CC1+ cells (OLIG2+;CC1+ cells/total cells) and CC1+ oligodendroglial cells (OLIG2+;CC1+ cells/OLIG2+ cells) in these areas. The values represent individual animals obtained from 2 litters: *P < 0.05; ***P < 0.001, Student’s t-test. (d, e) Representative images of the central region of the CC in P10 + / + and + /- brains stained for CC1 and OLIG2, and with the nuclei labelled by DAPI (blue, d). Histogram showing the percentages (mean ± SEM) of CC1+ oligodendroglial cells in this area at P10, P15 and P60 (e): n = 4–8 animals each condition (1–3 litters each developmental stage). The differences between genotypes were not significant, two way ANOVA. Scale bars: 500 μm (b) and 50 μm (d and magnifications in b).
Figure 5
Figure 5
The corpus callosum of adult Dyrk1a+/− mice is hypomyelinated. (a) Schematic representation of a sagittal brain section indicating the region of the corpus callosum (CC) analysed and representative images of the CC ultrastructure in 2-month-old (2 M) Dyrk1a+/+ (+/+) and Dyrk1a+/− (+ /−) mice. Scale bar: 1 μm. (b) Median value of the diameter (± interquartile range) of myelinated axons from each genotype. (c) Scattered plot of the g-ratios of individual fibres relative to their respective axon diameter. Green dots correspond to +/+ axons and red crosses to +/- axons. The dashed line indicates the median axon diameter in +/+ mice and the numbers on both sides of this line the percentages of axons below (left) or above (right) this value for each genotype. (d) Median value of the g-ratio (± interquartile range) for each genotype. Values in b-d were obtained from 980 (+/+) and 2024 (+/−) axons: n = 7–8 animals each genotype (3 litters); ns = not significant; ***P < 0.001, Mann–Whitney U test.
Figure 6
Figure 6
Alterations to the nodes of Ranvier in adult Dyrk1a+/− mice. (a) Representative images from the corpus callosum of 2-month-old Dyrk1a+/+ (+/+) and Dyrk1a+/− (+ /−) mice showing the nodes of Ranvier labelled for NAV1.6 (red) and the paranodes for CASPR (green). (b) Density (mean ± SEM) of the nodes of Ranvier. The values correspond to the node density obtained from 16 (+/+) and 13 (+/−) images: ns, not significant, Student’s t-test. (c) Image showing a node of Ranvier and the intensity of CASPR staining in the paranodes. Green dots in the intensity profile represent the center of mass for each paranode as determined by the 3D object reconstruction. (df) Scatter dot plots showing the node length (d), intraparanodal length (e) and NAV1.6 labelling index (L.I.) (f) for individual nodes of Ranvier (n = 2–3 animals each genotype, 1 litter): 95 (+/+) and 100 (+/−) nodes in d; 356 (+/+) and 217 (+/−) in (e); 88 (+/+) and 90 (+/−) in (f); *P < 0.05 and **P < 0.01, Mann–Whitney U test; **P < 0.001, Student’s t-test.
Figure 7
Figure 7
Slow velocities of action potential propagation in the corpus callosum of Dyrk1a+/− mice in vivo. (a) Scheme of the electrophysiological recordings performed in 2- (2 M) and 12-month-old (12 M) Dyrk1a+/− (+/−) and control (+/+) mice, and representative recording of compound action potentials (CAPs) arising from myelinated (N1) and unmyelinated (N2) axons. (b, c) Conduction velocities (mean ± SEM) for myelinated (b) and unmyelinated (c) axons in animals of the indicated age and genotype. n = 8–12 animals per genotype at 2 months (4 litters) and n = 7–9 animals per genotype at 12 months (3 litters): ns, not significant; *P < 0.05; **P < 0.01; ***P < 0.001 and ****P < 0.00, two-way ANOVA and Fisher’s LSD post-hoc test.

Similar articles

Cited by

References

    1. Lord C, et al. Autism spectrum disorder. Lancet. 2018;392(10146):508–520. doi: 10.1016/S0140-6736(18)31129-2. - DOI - PMC - PubMed
    1. Iossifov I, et al. The contribution of de novo coding mutations to autism spectrum disorder. Nature. 2014;515(7526):216–221. doi: 10.1038/nature13908. - DOI - PMC - PubMed
    1. Yuen R, et al. Whole genome sequencing resource identifies 18 new candidate genes for autism spectrum disorder. Nat. Neurosci. 2017;20(4):602–611. doi: 10.1038/nn.4524. - DOI - PMC - PubMed
    1. Stessman HA, et al. Targeted sequencing identifies 91 neurodevelopmental-disorder risk genes with autism and developmental-disability biases. Nat. Genet. 2017;49(4):515–526. doi: 10.1038/ng.3792. - DOI - PMC - PubMed
    1. Satterstrom FK, et al. Large-scale exome sequencing study implicates both developmental and functional changes in the neurobiology of autism. Cell. 2020;180(3):568–584 e23. doi: 10.1016/j.cell.2019.12.036. - DOI - PMC - PubMed

Publication types

Substances