. 2022 Nov 19;22(1):1194.
doi: 10.1186/s12885-022-10219-w.

Quantifying substantial carcinogenesis of genetic and environmental factors from measurement error in the number of stem cell divisions

Affiliations

Quantifying substantial carcinogenesis of genetic and environmental factors from measurement error in the number of stem cell divisions

Xinhui Liu et al. BMC Cancer. .

Abstract

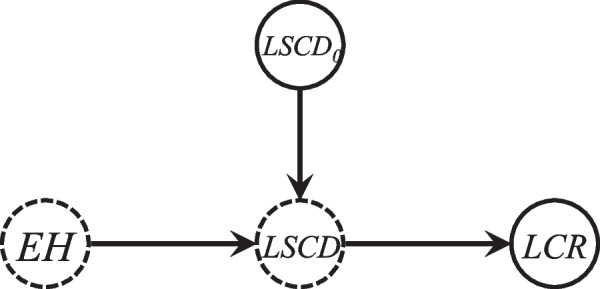
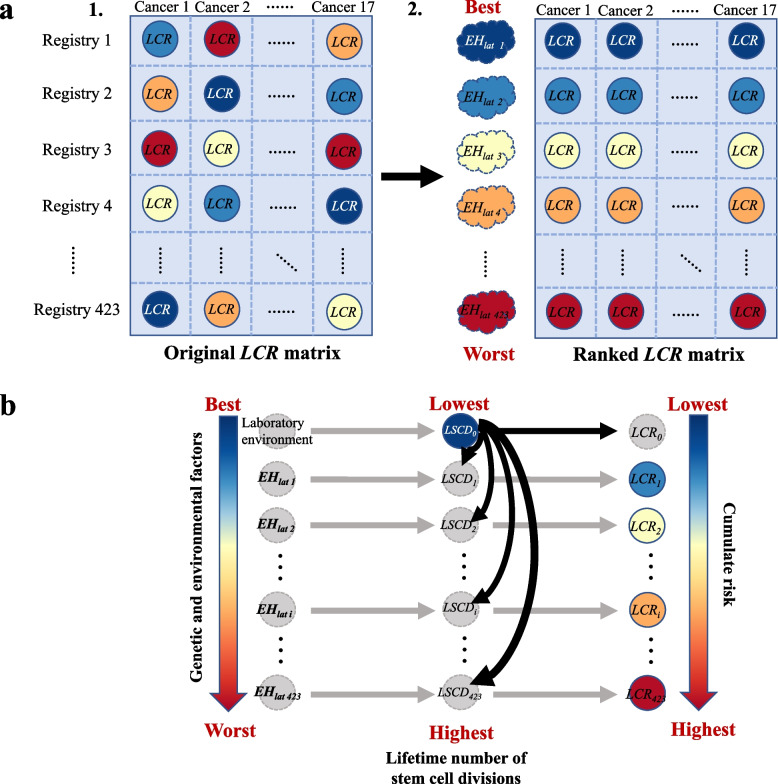
Background: The relative contributions of genetic and environmental factors versus unavoidable stochastic risk factors to the variation in cancer risk among tissues have become a widely-discussed topic. Some claim that the stochastic effects of DNA replication are mainly responsible, others believe that cancer risk is heavily affected by environmental and hereditary factors. Some of these studies made evidence from the correlation analysis between the lifetime number of stem cell divisions within each tissue and tissue-specific lifetime cancer risk. However, they did not consider the measurement error in the estimated number of stem cell divisions, which is caused by the exposure to different levels of genetic and environmental factors. This will obscure the authentic contribution of environmental or inherited factors.

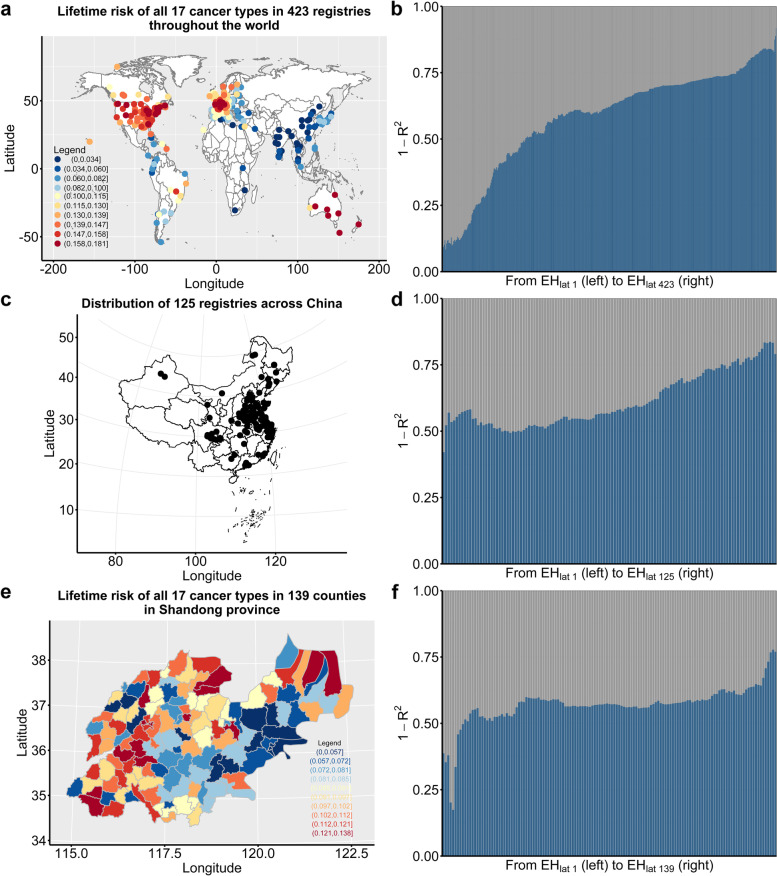
Methods: In this study, we proposed two distinct modeling strategies, which integrate the measurement error model with the prevailing model of carcinogenesis to quantitatively evaluate the contribution of hereditary and environmental factors to cancer development. Then, we applied the proposed strategies to cancer data from 423 registries in 68 different countries (global-wide), 125 registries across China (national-wide of China), and 139 counties in Shandong province (Shandong provincial, China), respectively.

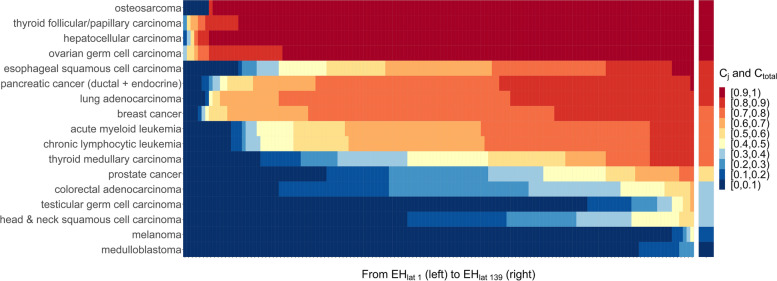
Results: The results suggest that the contribution of genetic and environmental factors is at least 92% to the variation in cancer risk among 17 tissues. Moreover, mutations occurring in progenitor cells and differentiated cells are less likely to be accumulated enough for cancer to occur, and the carcinogenesis is more likely to originate from stem cells. Except for medulloblastoma, the contribution of genetic and environmental factors to the risk of other 16 organ-specific cancers are all more than 60%.

Conclusions: This work provides additional evidence that genetic and environmental factors play leading roles in cancer development. Therefore, the identification of modifiable environmental and hereditary risk factors for each cancer is highly recommended, and primary prevention in early life-course should be the major focus of cancer prevention.

Keywords: Cancer prevention; Environment; Epidemiology; Measurement error; Stem cell division.


Conflict of interest statement

The authors declare that they have no competing interests.

Figures

Fig. 1
Fig. 1
Diagram of relationships between EH, LSCD0, LSCD, and LCR. The dotted node represents the unobserved variable, and the solid node represents observed variable. EH: a single variable denoting all the genetic and environmental factors that do not exist in the laboratory environment; LSCD: the true total number of divisions of all stem cells within this tissue per lifetime (from birth to age 74); LSCD0: the error-prone value of LSCD calculated using parameters estimated based on results of cell culture from mouse or human tissues in the laboratory environment; LCR: the observed lifetime cancer risk
Fig. 2
Fig. 2
Strategy to explore the contribution of genetic and environmental factors on variation in cancer risks. a The construction of the ranked lifetime cancer risk (LCR) matrix. Part 1: The 423 × 17 original LCR matrix using global-wide data for 17 cancer types in 423 registries in 68 different countries. For the jth column in the matrix, the color from dark blue to dark red represents the LCR of cancer j ranges from the lowest to the highest in 423 registries, and it can also indirectly denote the EH in 423 registries of cancer j ranged from the best to the worst. Part 2: The ranked LCR matrix, constructed by sorting the LCR in each column (each cancer) in the original LCR matrix from the lowest to the highest. We denote the level of EH (row) in the ranked LCR matrix as EHlat, i.e., the first row of the ranked LCR matrix is regarded as the optimal EHlat of all 17 cancers in 423 registries, followed by the second optimal EHlat, until to the worst EHlat. b For the ith EHlat (row) in the ranked LCR matrix, the LCRi attributes to the ith LSCDi, which is caused by the ith EHlat i. However, the true number of stem cell divisions under each EHlat (LSCD1,,LSCD423) cannot be observed, we can only obtain LSCD0 under the laboratory environment. Dotted grey nodes represent the unmeasured variables
Fig. 3
Fig. 3
Variation in cancer risk among tissues explained by genetic and environmental factors. a, c and e The spatial distribution of registries (counties) in global-wide, national-wide in China, and Shandong province, respectively, besides, a and e show the substantial variation in cancer risks of all 17 cancer types across different registries (counties). [Maps of China and Shandong province were obtained from the Resource and Environment Science and Data Center at http://www.resdc.cn/Default.aspx]. b, d, and f bar charts of the estimated 1-Ri2 from curve g(LCRi)=φi0+φi1LSCD0+ε1i fitting in each EHlat i in global scope, national scope and provincial scope, respectively, representing the contributions of genetic and environmental factors from the optimal EHlat (left) to the worst EHlat (right) to the variation of cancer risks in global scope, national scope, and provincial scope, respectively. EH: a single variable denoting all the genetic and environmental factors that do not exist in the laboratory environment; LSCD: the true total number of divisions of all stem cells within this tissue per lifetime (from birth to age 74); LSCD0: the error-prone value of LSCD calculated using parameters estimated based on results of cell culture from mouse or human tissues in the laboratory environment; LCR: the observed lifetime cancer risk. EHlat i: the ith level (row) of EH in the ranked LCR matrix
Fig. 4
Fig. 4
The results of sensitivity analysis assuming that tumours may originate from a hierarchy of cells. a bar chart of the estimated Ri2 from the curve g(LCRi)=γ0i+γ1iLTCD0+ε2i in each EHlat i (i=1,,423) using global-wide ranked LCR matrix, representing the contributions of LTCD0 from the optimal EHlat (left) to the worst EHlat (right) to the variation of cancer risks; b bar chart of the estimated Ri2 from curve g(LCRi)=λ0i+λ1iSMN0+ε3i in each EHlat i (i=1,,423) using global-wide ranked LCR matrix, representing the contributions of SMN0 from the optimal EHlat (left) to the worst EHlat (right) to the variation of cancer risks. LTCD0: the error-prone value of the total number of tissue cell divisions per lifetime calculated in the laboratory environment; SMN0: the error-prone value of the somatic mutation number calculated in the laboratory environment; LCR: the observed lifetime cancer risk, EHlat: the level of EH (row) in the ranked LCR matrix
Fig. 5
Fig. 5
Lifetime risk of each organ-specific cancer explained by genetic and environmental factors in global scope. The left panel denotes the contribution of each EHlat (Ci,i=1,,423) to the risk of each organ-specific cancer, and the lattices from left to right denote C1(EHlat 1) to C423(EHlat 423), respectively. The right panel denotes the average contribution of genetic and environmental factors (Ctotal) to the risk of each organ-specific cancer. EHlat i: the ith level (row) of EH in the ranked ACR matrix
Fig. 6
Fig. 6
Lifetime risk of each organ-specific cancer explained by genetic and environmental factors in Shandong province. The left panel denotes the contribution of each EHlat (Ci,i=1,,139) to the risk of each organ-specific cancer, and the lattices from left to right denote C1(EHlat 1) to C139 (EHlat 139), respectively. The right panel denotes the average contribution of genetic and environmental factors (Ctotal) to the risk of each organ-specific cancer. EHlat i: the ith level (row) of EH in the ranked ACR matrix

Similar articles

Cited by

References

    1. Tomasetti C, Vogelstein B. Variation in cancer risk among tissues can be explained by the number of stem cell divisions. Science. 2015;347:78–81. doi: 10.1126/science.1260825. - DOI - PMC - PubMed
    1. Wu S, Powers S, Zhu W, Hannun YA. Substantial contribution of extrinsic risk factors to cancer development. Nature. 2016;529:43–47. doi: 10.1038/nature16166. - DOI - PMC - PubMed
    1. Nunney L, Muir B. Peto's paradox and the hallmarks of cancer: constructing an evolutionary framework for understanding the incidence of cancer. Philos Trans R Soc Lond B Biol Sci. 2015;370:20150161. doi: 10.1098/rstb.2015.0161. - DOI - PMC - PubMed
    1. Weinberg CR, Zaykin D. Is bad luck the main cause of cancer? J Natl Cancer Inst. 2015;107:djv25. doi: 10.1093/jnci/djv125. - DOI - PMC - PubMed
    1. Tomasetti C, Li L, Vogelstein B. Stem cell divisions, somatic mutations, cancer etiology, and cancer prevention. Science. 2017;355:1330–4. - PMC - PubMed

LinkOut - more resources