

Cysteine restriction-specific effects of sulfur amino acid restriction on lipid metabolism
- PMID: 36403077
- PMCID: PMC9741510
- DOI: 10.1111/acel.13739
Cysteine restriction-specific effects of sulfur amino acid restriction on lipid metabolism
Abstract
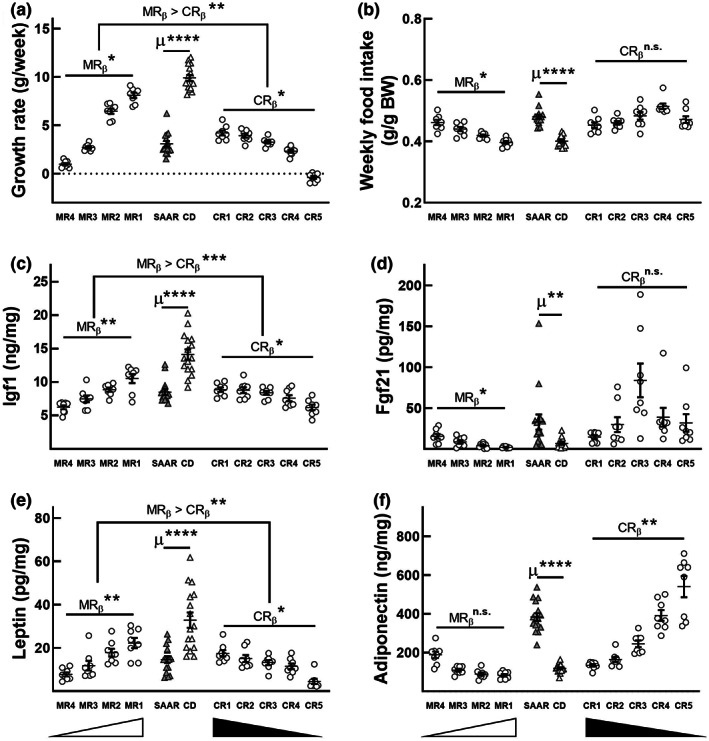
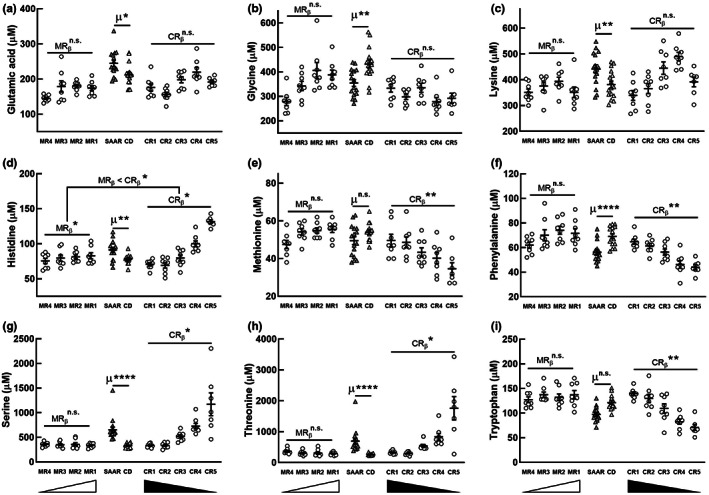
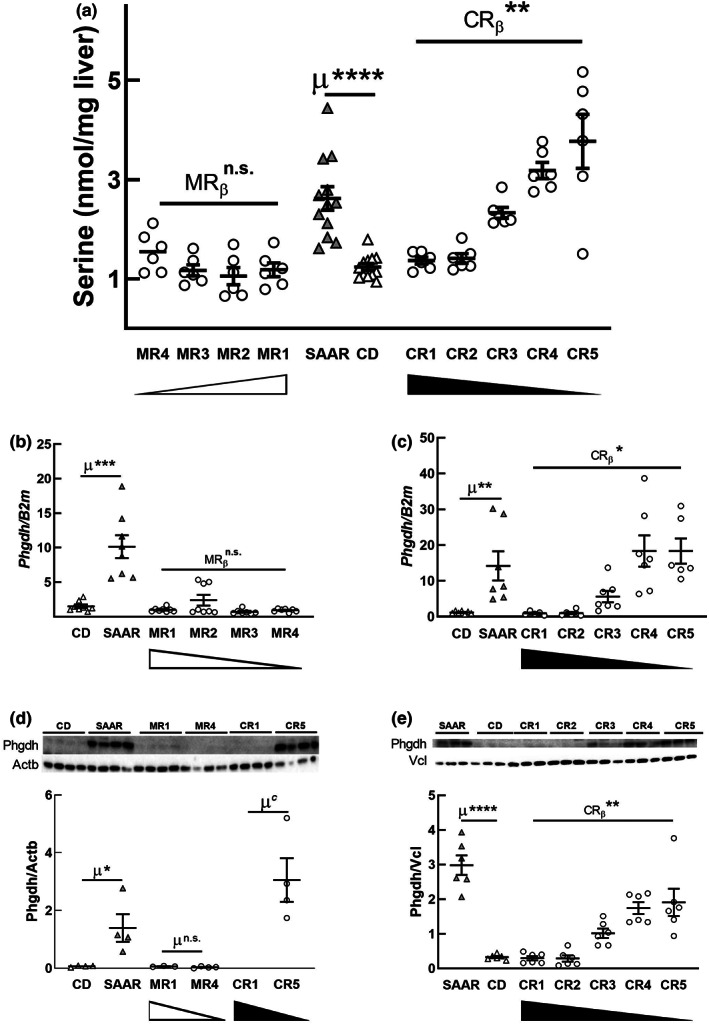
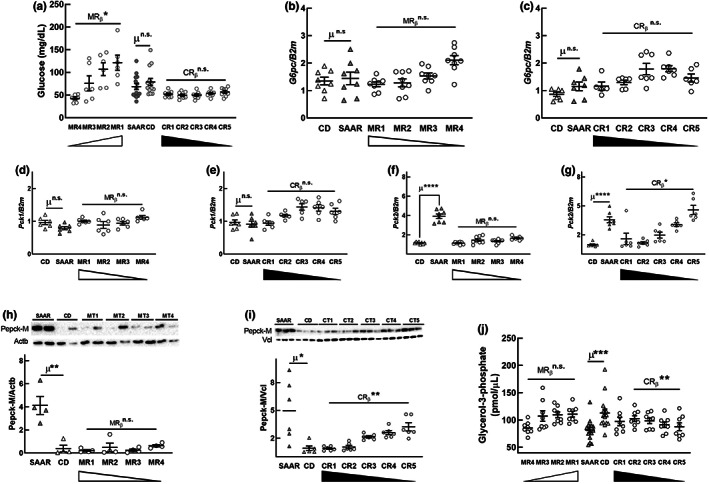
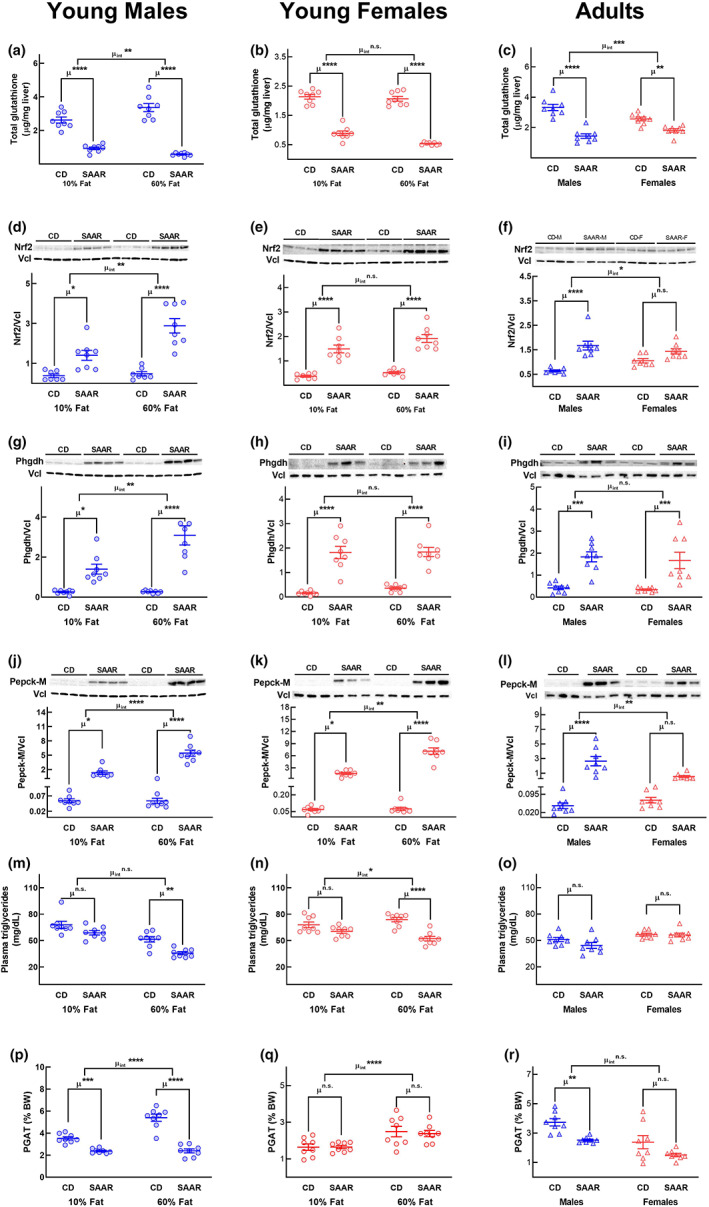
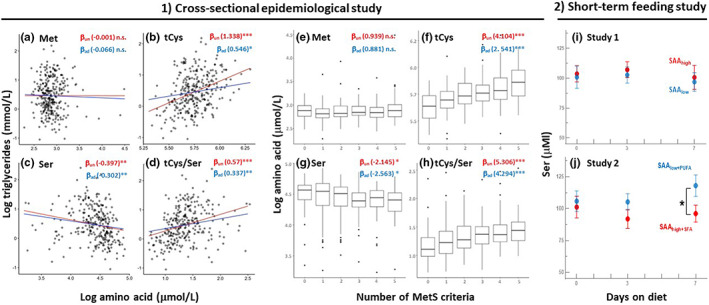
Decreasing the dietary intake of methionine exerts robust anti-adiposity effects in rodents but modest effects in humans. Since cysteine can be synthesized from methionine, animal diets are formulated by decreasing methionine and eliminating cysteine. Such diets exert both methionine restriction (MR) and cysteine restriction (CR), that is, sulfur amino acid restriction (SAAR). Contrarily, SAAR diets formulated for human consumption included cysteine, and thus might have exerted only MR. Epidemiological studies positively correlate body adiposity with plasma cysteine but not methionine, suggesting that CR, but not MR, is responsible for the anti-adiposity effects of SAAR. Whether this is true, and, if so, the underlying mechanisms are unknown. Using methionine- and cysteine-titrated diets, we demonstrate that the anti-adiposity effects of SAAR are due to CR. Data indicate that CR increases serinogenesis (serine biosynthesis from non-glucose substrates) by diverting substrates from glyceroneogenesis, which is essential for fatty acid reesterification and triglyceride synthesis. Molecular data suggest that CR depletes hepatic glutathione and induces Nrf2 and its downstream targets Phgdh (the serine biosynthetic enzyme) and Pepck-M. In mice, the magnitude of SAAR-induced changes in molecular markers depended on dietary fat concentration (60% fat >10% fat), sex (males > females), and age-at-onset (young > adult). Our findings are translationally relevant as we found negative and positive correlations of plasma serine and cysteine, respectively, with triglycerides and metabolic syndrome criteria in a cross-sectional epidemiological study. Controlled feeding of low-SAA, high-polyunsaturated fatty acid diets increased plasma serine in humans. Serinogenesis might be a target for treating hypertriglyceridemia.
Keywords: aging; caloric restriction; cysteine; metabolic syndrome; methionine; nutrition; sulfur amino acids; triglycerides.
© 2022 The Authors. Aging Cell published by Anatomical Society and John Wiley & Sons Ltd.
Conflict of interest statement
No authors have any conflict of interest.
Figures
Similar articles
-
Pharmacological recapitulation of the lean phenotype induced by the lifespan-extending sulfur amino acid-restricted diet.Aging (Albany NY). 2025 Apr 7;17(4):960-981. doi: 10.18632/aging.206237. Epub 2025 Apr 7. Aging (Albany NY). 2025. PMID: 40202448 Free PMC article.
-
Dietary Methionine and Total Sulfur Amino Acid Restriction in Healthy Adults.J Nutr Health Aging. 2023;27(2):111-123. doi: 10.1007/s12603-023-1883-3. J Nutr Health Aging. 2023. PMID: 36806866 Free PMC article.
-
Dietary sulfur amino acid restriction in humans with overweight and obesity: Evidence of an altered plasma and urine sulfurome, and a novel metabolic signature that correlates with loss of fat mass and adipose tissue gene expression.Redox Biol. 2024 Jul;73:103192. doi: 10.1016/j.redox.2024.103192. Epub 2024 May 17. Redox Biol. 2024. PMID: 38776754 Free PMC article. Clinical Trial.
-
Disease prevention and delayed aging by dietary sulfur amino acid restriction: translational implications.Ann N Y Acad Sci. 2018 Apr;1418(1):44-55. doi: 10.1111/nyas.13584. Epub 2018 Feb 5. Ann N Y Acad Sci. 2018. PMID: 29399808 Review.
-
Sulfur-Containing Amino Acids and Lipid Metabolism.J Nutr. 2020 Oct 1;150(Suppl 1):2524S-2531S. doi: 10.1093/jn/nxaa243. J Nutr. 2020. PMID: 33000164 Review.
Cited by
-
Cysteine-lowering treatment with mesna against obesity: Proof of concept and results from a human phase I, dose-finding study.Diabetes Obes Metab. 2023 Nov;25(11):3161-3170. doi: 10.1111/dom.15210. Epub 2023 Jul 12. Diabetes Obes Metab. 2023. PMID: 37435697 Free PMC article.
-
Dietary cystine restriction increases the proliferative capacity of the small intestine of mice.PLoS One. 2024 Jan 5;19(1):e0290493. doi: 10.1371/journal.pone.0290493. eCollection 2024. PLoS One. 2024. PMID: 38181033 Free PMC article.
-
Acute effects of oral mesna administration on the full amino acid profile and 3-methylhistidine: secondary results from the CYLOB dose-finding study.Amino Acids. 2024 Jun 6;56(1):39. doi: 10.1007/s00726-024-03398-2. Amino Acids. 2024. PMID: 38844567 Free PMC article. Clinical Trial.
-
Metabolic regulation of immunological aging.Nat Aging. 2025 Aug;5(8):1425-1440. doi: 10.1038/s43587-025-00921-2. Epub 2025 Aug 14. Nat Aging. 2025. PMID: 40813811 Review.
-
Causal Effects of Blood Metabolites and Obstructive Sleep Apnea: A Mendelian Randomization Study.Curr Neurovasc Res. 2024;21(1):101-109. doi: 10.2174/0115672026266627230921052416. Curr Neurovasc Res. 2024. PMID: 37877151
References
-
- Antoniades, C. , Shirodaria, C. , Leeson, P. , Baarholm, O. A. , Van‐Assche, T. , Cunnington, C. , Pillai, R. , Ratnatunga, C. , Tousoulis, D. , Stefanadis, C. , Refsum, H. , & Channon, K. M. (2009). MTHFR 677 C>T Polymorphism reveals functional importance for 5‐methyltetrahydrofolate, not homocysteine, in regulation of vascular redox state and endothelial function in human atherosclerosis. Circulation, 119(18), 2507–2515. 10.1161/CIRCULATIONAHA.108.808675 - DOI - PubMed
-
- Bidlingmeyer, B. A. , Cohen, S. A. , & Tarvin, T. L. (1984). Rapid analysis of amino acids using pre‐column derivatization. Journal of Chromatography, 336(1), 93–104. - PubMed
MeSH terms
Substances
Grants and funding
LinkOut - more resources
Full Text Sources
Miscellaneous
