. 2022 Nov 18;14(22):9103-9127.
doi: 10.18632/aging.204388. Epub 2022 Nov 18.

Exploring the mechanisms underlying the therapeutic effect of the Radix Bupleuri-Rhizoma Cyperi herb pair on hepatocellular carcinoma using multilevel data integration and molecular docking

Affiliations

Exploring the mechanisms underlying the therapeutic effect of the Radix Bupleuri-Rhizoma Cyperi herb pair on hepatocellular carcinoma using multilevel data integration and molecular docking

Luzhi Qing et al. Aging (Albany NY). .

Abstract

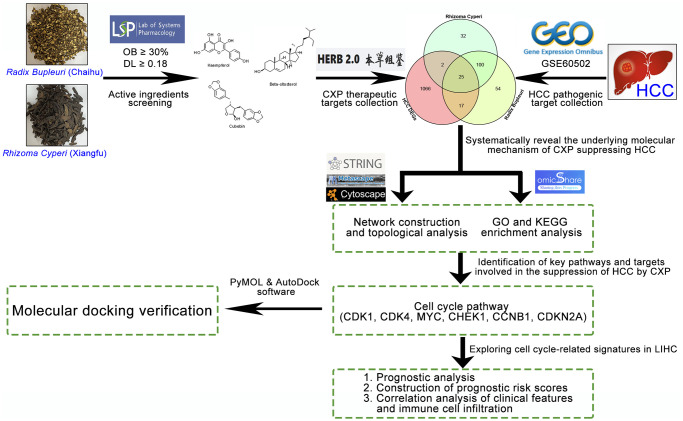
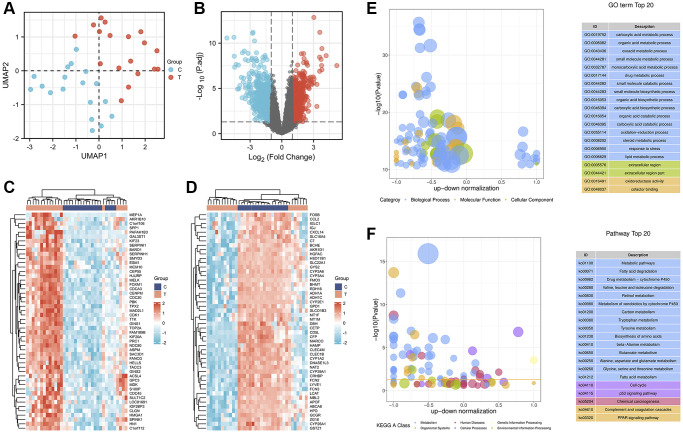
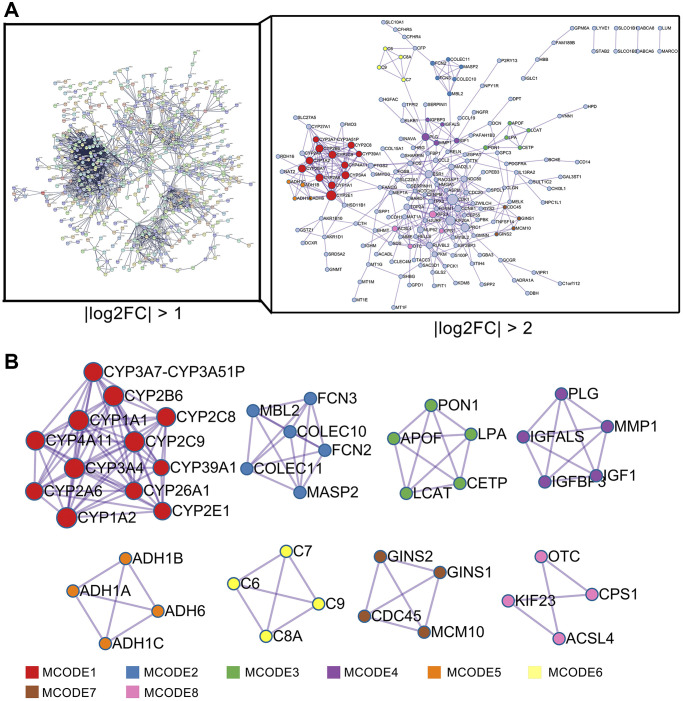
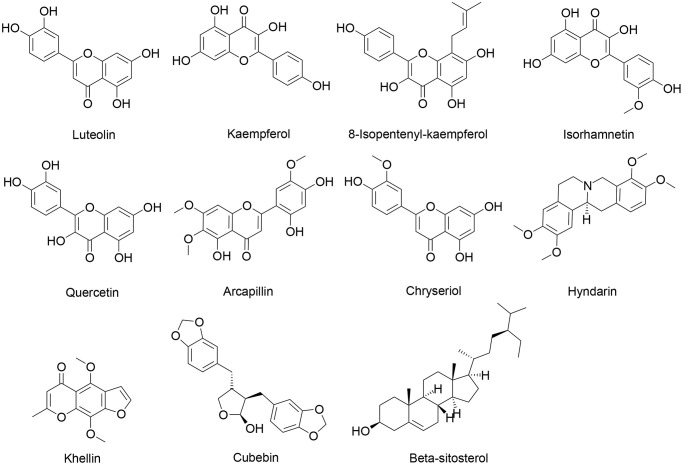
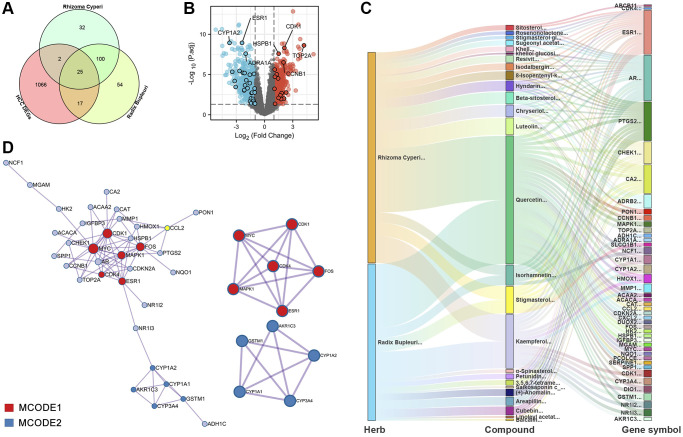
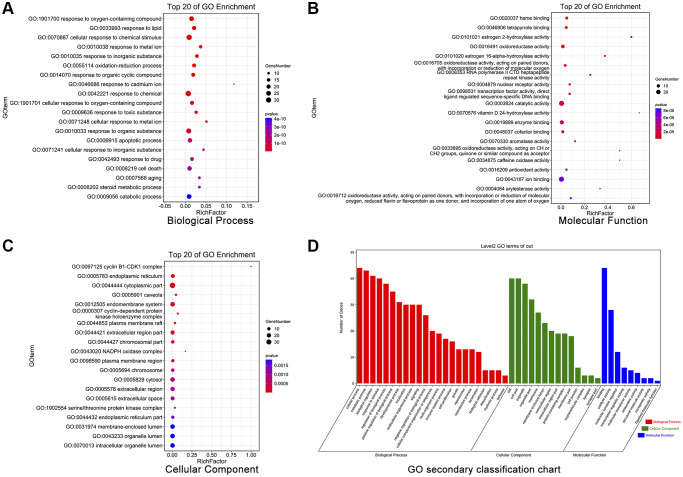
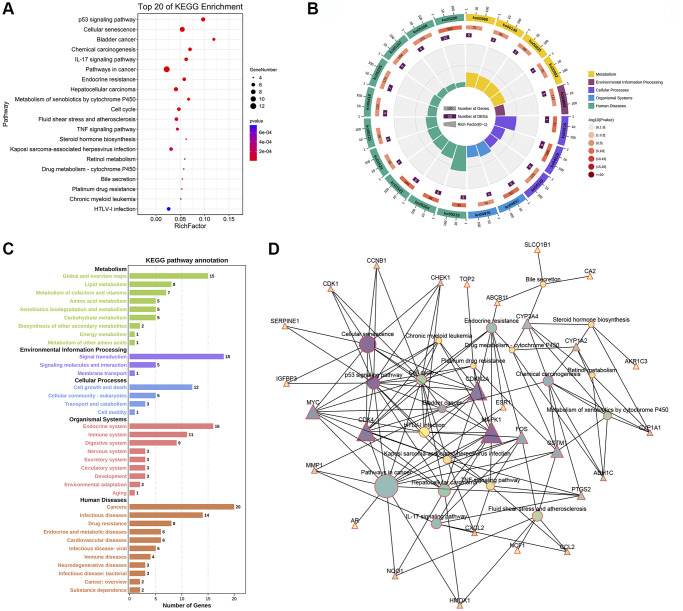
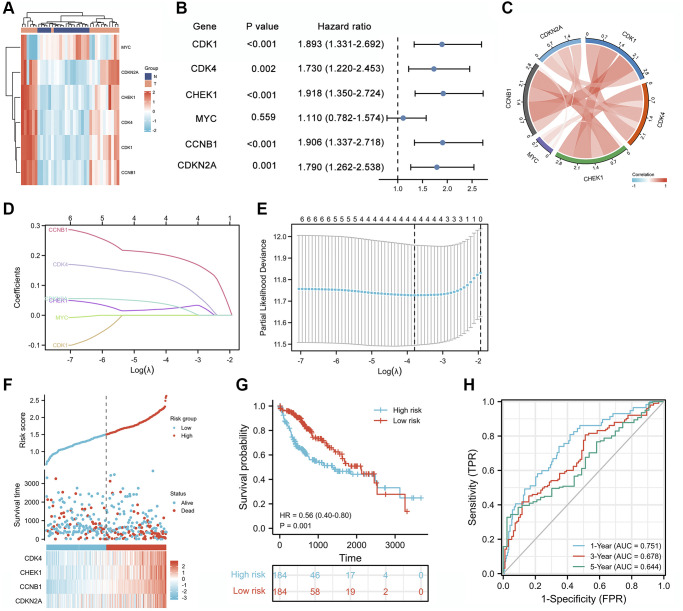
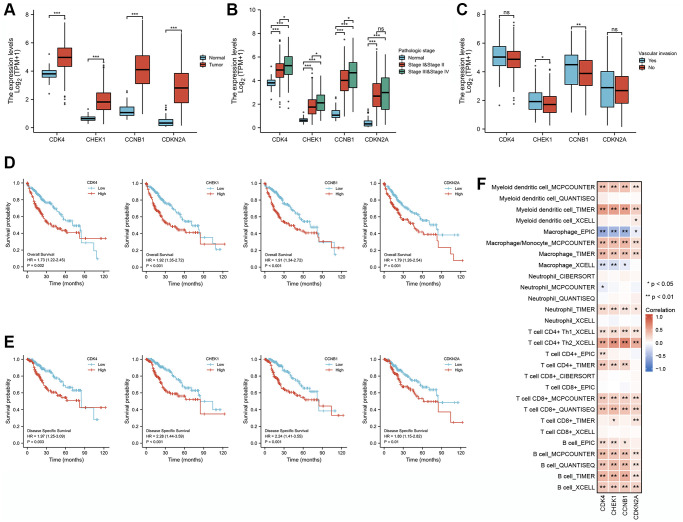
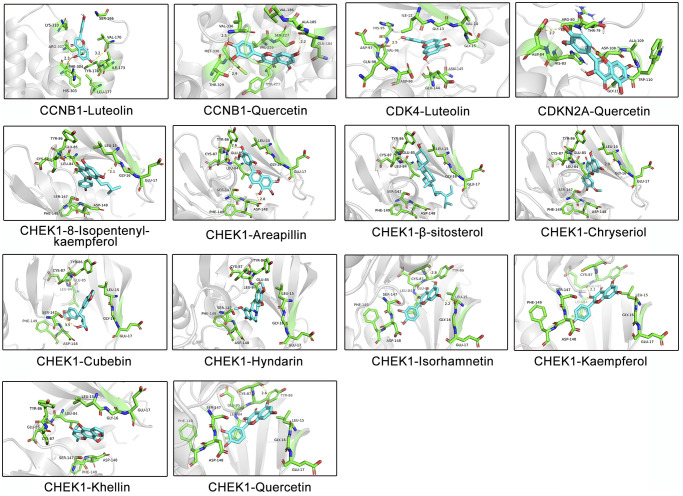
Traditional Chinese medicine (TCM) is a promising and effective treatment for cancer with minimal side effects through a multi-active ingredient multitarget network. Radix Bupleuri and Rhizoma Cyperi are listed as herbs dispersing stagnated liver Qi in China. They have been used clinically to treat liver diseases for many years and recent pharmacological studies have shown that they inhibit the proliferation of hepatocellular carcinoma (HCC). However, the pharmacological mechanisms, potential targets, and clinical value of the Radix Bupleuri-Rhizoma Cyperi herb pair (CXP) for suppressing HCC growth have not been fully elucidated. We identified 44 CXP targets involved in the treatment of HCC using the GEO dataset and HERB database. An analysis of the Traditional Chinese Medicine System Pharmacology Database (TCMSP) showed that CXP exerts synergistic effects through 4 active ingredients, including quercetin, stigmasterol, isorhamnetin, and kaempferol. GO and KEGG analyses revealed that CXP mainly regulates HCC progression through metabolic pathways, the p53 signaling pathway, and the cell cycle. Additionally, we applied The Cancer Genome Atlas (TCGA)-liver hepatocellular carcinoma (LIHC) database to perform the expression patterns, clinical features, and prognosis of 6 genes (CCNB1, CDK1, CDK4, MYC, CDKN2A, and CHEK1) in cell cycle pathways to reveal that CXP suppresses HCC clinical therapeutic value. Moreover, based on molecular docking, we further verified that CXP exerts its anti-HCC activity through the interaction of multiple active components with cell cycle-related genes. We systematically revealed the potential pharmacological mechanisms and targets of CXP in HCC using multilevel data integration and molecular docking strategies.

Keywords: Radix Bupleuri-Rhizoma cyperi herb pair (CXP); cell cycle; hepatocellular carcinoma (HCC); molecular docking; traditional chinese medicine (TCM).


Conflict of interest statement

CONFLICTS OF INTEREST: The authors declare no conflicts of interest related to this study.

Figures

Figure 1
Figure 1
Flowchart of the analytical procedures used in the study.
Figure 2
Figure 2
Identification and enrichment analysis of DEGs in adjacent nontumor liver tissues and HCC tissues. (A) The UMAP scatter plot. (B) The expression patterns of DEGs are shown in volcano plots. Red and blue dots represent upregulated genes (log2FC ≥ 1) and downregulated genes (log2FC ≤ −1), respectively, while gray represents genes with no significant difference in expression (P.adj < 0.05). Heatmap analysis of the top 50 up- (C) and downregulated (D) DEGs. Bubble plot showing the top 20 enriched GO terms (E) and KEGG (F) pathways. The larger the ordinate value in the bubble chart, the more significant the corresponding GO or KEGG result. The abscissa represents the normalized upregulation and downregulation value (the ratio of the difference between the number of upregulated genes and the number of downregulated genes to the total number of DEGs). The higher the value, the greater the number of upregulated genes enriched in the GO/KEGG pathway; conversely, the lower the value, the higher the number of downregulated genes enriched in the GO/KEGG pathway.
Figure 3
Figure 3
PPI network analysis of DEGs in HCC. (A) PPI network analysis of 1110 DEGs (right panel, STRING database) and 224 DEGs (left panel, Metascape web tool). (B) MCODE module for the gene clustering analysis.
Figure 4
Figure 4
Chemical structures of some active ingredients of CXP.
Figure 5
Figure 5
PPI and H-C-T network analysis of 44 potential therapeutic targets for CXP in HCC. (A) Venn diagram. (B) The distribution of 44 potential therapeutic targets of CXP in the treatment of HCC in the volcano plot of DEGs in HCC. (C) H-C-T network analysis. (D) PPI network and gene clustering analysis (Metascape web tool).
Figure 6
Figure 6
GO enrichment analysis of 44 potential therapeutic targets for CXP in HCC. (A) Biological processes. (B) Molecular functions. (C) Cellular components. (D) Secondary classification chart of enriched GO terms.
Figure 7
Figure 7
KEGG enrichment and KEGG pathway-gene network analyses of 44 potential therapeutic targets for CXP in HCC. (A) Top 20 KEGG pathways. (B) Secondary classification of the top 20 KEGG pathways. (C) Secondary classification of all KEGG pathways. (D) KEGG pathway-gene network.
Figure 8
Figure 8
Prognostic analysis of cell cycle-related genes and establishment of a prognostic model. (A) Heatmap of the expression patterns of 6 cell cycle-related genes in 18 pairs of adjacent non-tumor liver tissues and HCC tissues. (B) Forest plot of the univariate Cox analysis of 6 cell cycle-related genes. (C) Correlation network of 6 cell cycle-related genes. (D) LASSO coefficient profiles of 6 cell cycle-related genes. (E) Cross-validation for tuning parameter selection in the LASSO regression analysis. (F) The distribution of risk scores, gene expression levels, and survival status of patients with LIHC in the training cohort. (G) Kaplan–Meier curves of the OS of all patients with LIHC in TCGA cohort based on the risk score. (H) Time-dependent ROC curve analysis of the prognostic model (1, 3, and 5 years).
Figure 9
Figure 9
Correlation analysis of the expression of four cell cycle-related genes with clinical features and immune cell infiltration in patients with LIHC. (A) The differential expression of CCNB1, CDK4, CDKN2A, and CHEK1 between normal and tumor tissues. (B) CCNB1, CDK4, CDKN2A, and CHEK1 mRNA expression in normal individuals or individuals with different pathologic stages (stage I and II, and stage III and IV). (C) Differences expression of CCNB1, CDK4, CDKN2A, and CHEK1 mRNA in patients with different types of vascular invasion. (D) Kaplan-Meier curves of OS for different cell cycle-related genes. (E) Kaplan-Meier curves of DSS for different cell cycle-related genes. (F) Correlation analysis between four cell cycle-related genes and infiltration levels of different immune cells estimated using TIMER, EPIC, XCELL, CIBERSORT, and QUANTISEQ. *, **, and *** represent P < 0.05, P < 0.01, and P < 0.001, respectively.
Figure 10
Figure 10
Molecular models of the binding of different active ingredients to 4 cell cycle-related targets, which are shown as predicted protein–ligand binding diagrams and 3D interaction diagrams displayed using PyMOL. Green represents the surrounding amino acid residues in the binding pocket, and cyan represents the active ingredient.

Similar articles

Cited by

References

    1. Trefts E, Gannon M, Wasserman DH. The liver. Curr Biol. 2017; 27:R1147–51. 10.1016/j.cub.2017.09.019 - DOI - PMC - PubMed
    1. Yang JD, Hainaut P, Gores GJ, Amadou A, Plymoth A, Roberts LR. A global view of hepatocellular carcinoma: trends, risk, prevention and management. Nat Rev Gastroenterol Hepatol. 2019; 16:589–604. 10.1038/s41575-019-0186-y - DOI - PMC - PubMed
    1. Fitzmaurice C, Abate D, Abbasi N, Abbastabar H, Abd-Allah F, Abdel-Rahman O, Abdelalim A, Abdoli A, Abdollahpour I, Abdulle ASM, Abebe ND, Abraha HN, Abu-Raddad LJ, et al., and Global Burden of Disease Cancer Collaboration. Global, Regional, and National Cancer Incidence, Mortality, Years of Life Lost, Years Lived With Disability, and Disability-Adjusted Life-Years for 29 Cancer Groups, 1990 to 2017: A Systematic Analysis for the Global Burden of Disease Study. JAMA Oncol. 2019; 5:1749–68. 10.1001/jamaoncol.2019.2996 - DOI - PMC - PubMed
    1. Craig AJ, von Felden J, Garcia-Lezana T, Sarcognato S, Villanueva A. Tumour evolution in hepatocellular carcinoma. Nat Rev Gastroenterol Hepatol. 2020; 17:139–52. 10.1038/s41575-019-0229-4 - DOI - PubMed
    1. Llovet JM, De Baere T, Kulik L, Haber PK, Greten TF, Meyer T, Lencioni R. Locoregional therapies in the era of molecular and immune treatments for hepatocellular carcinoma. Nat Rev Gastroenterol Hepatol. 2021; 18:293–313. 10.1038/s41575-020-00395-0 - DOI - PubMed

MeSH terms

Substances