

Longitudinal neural and vascular recovery following ultraflexible neural electrode implantation in aged mice
- PMID: 36403326
- PMCID: PMC9701172
- DOI: 10.1016/j.biomaterials.2022.121905
Longitudinal neural and vascular recovery following ultraflexible neural electrode implantation in aged mice
Abstract
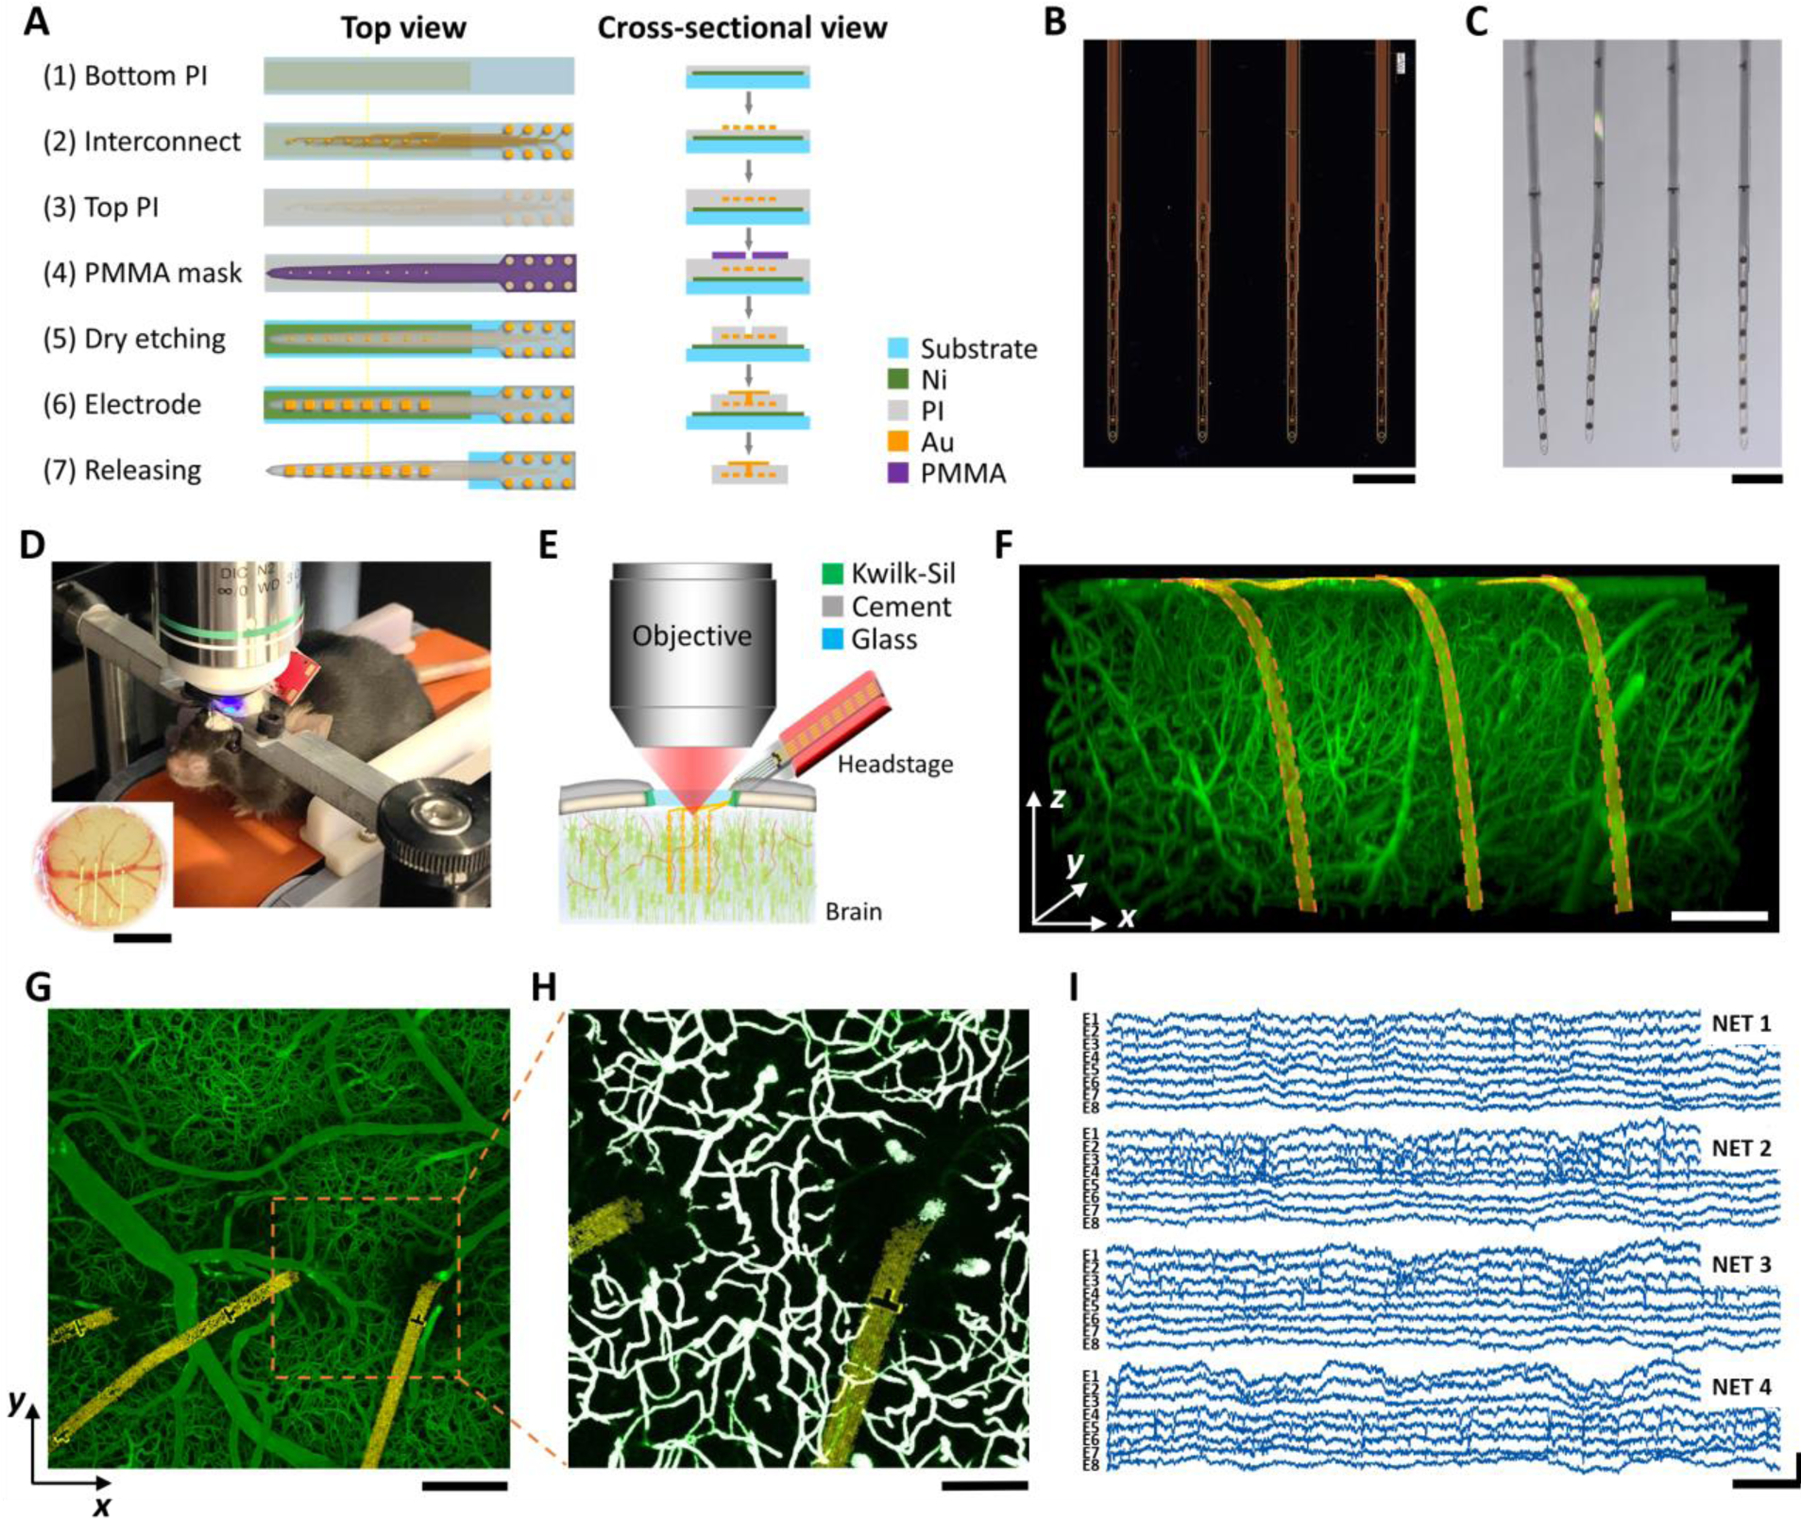
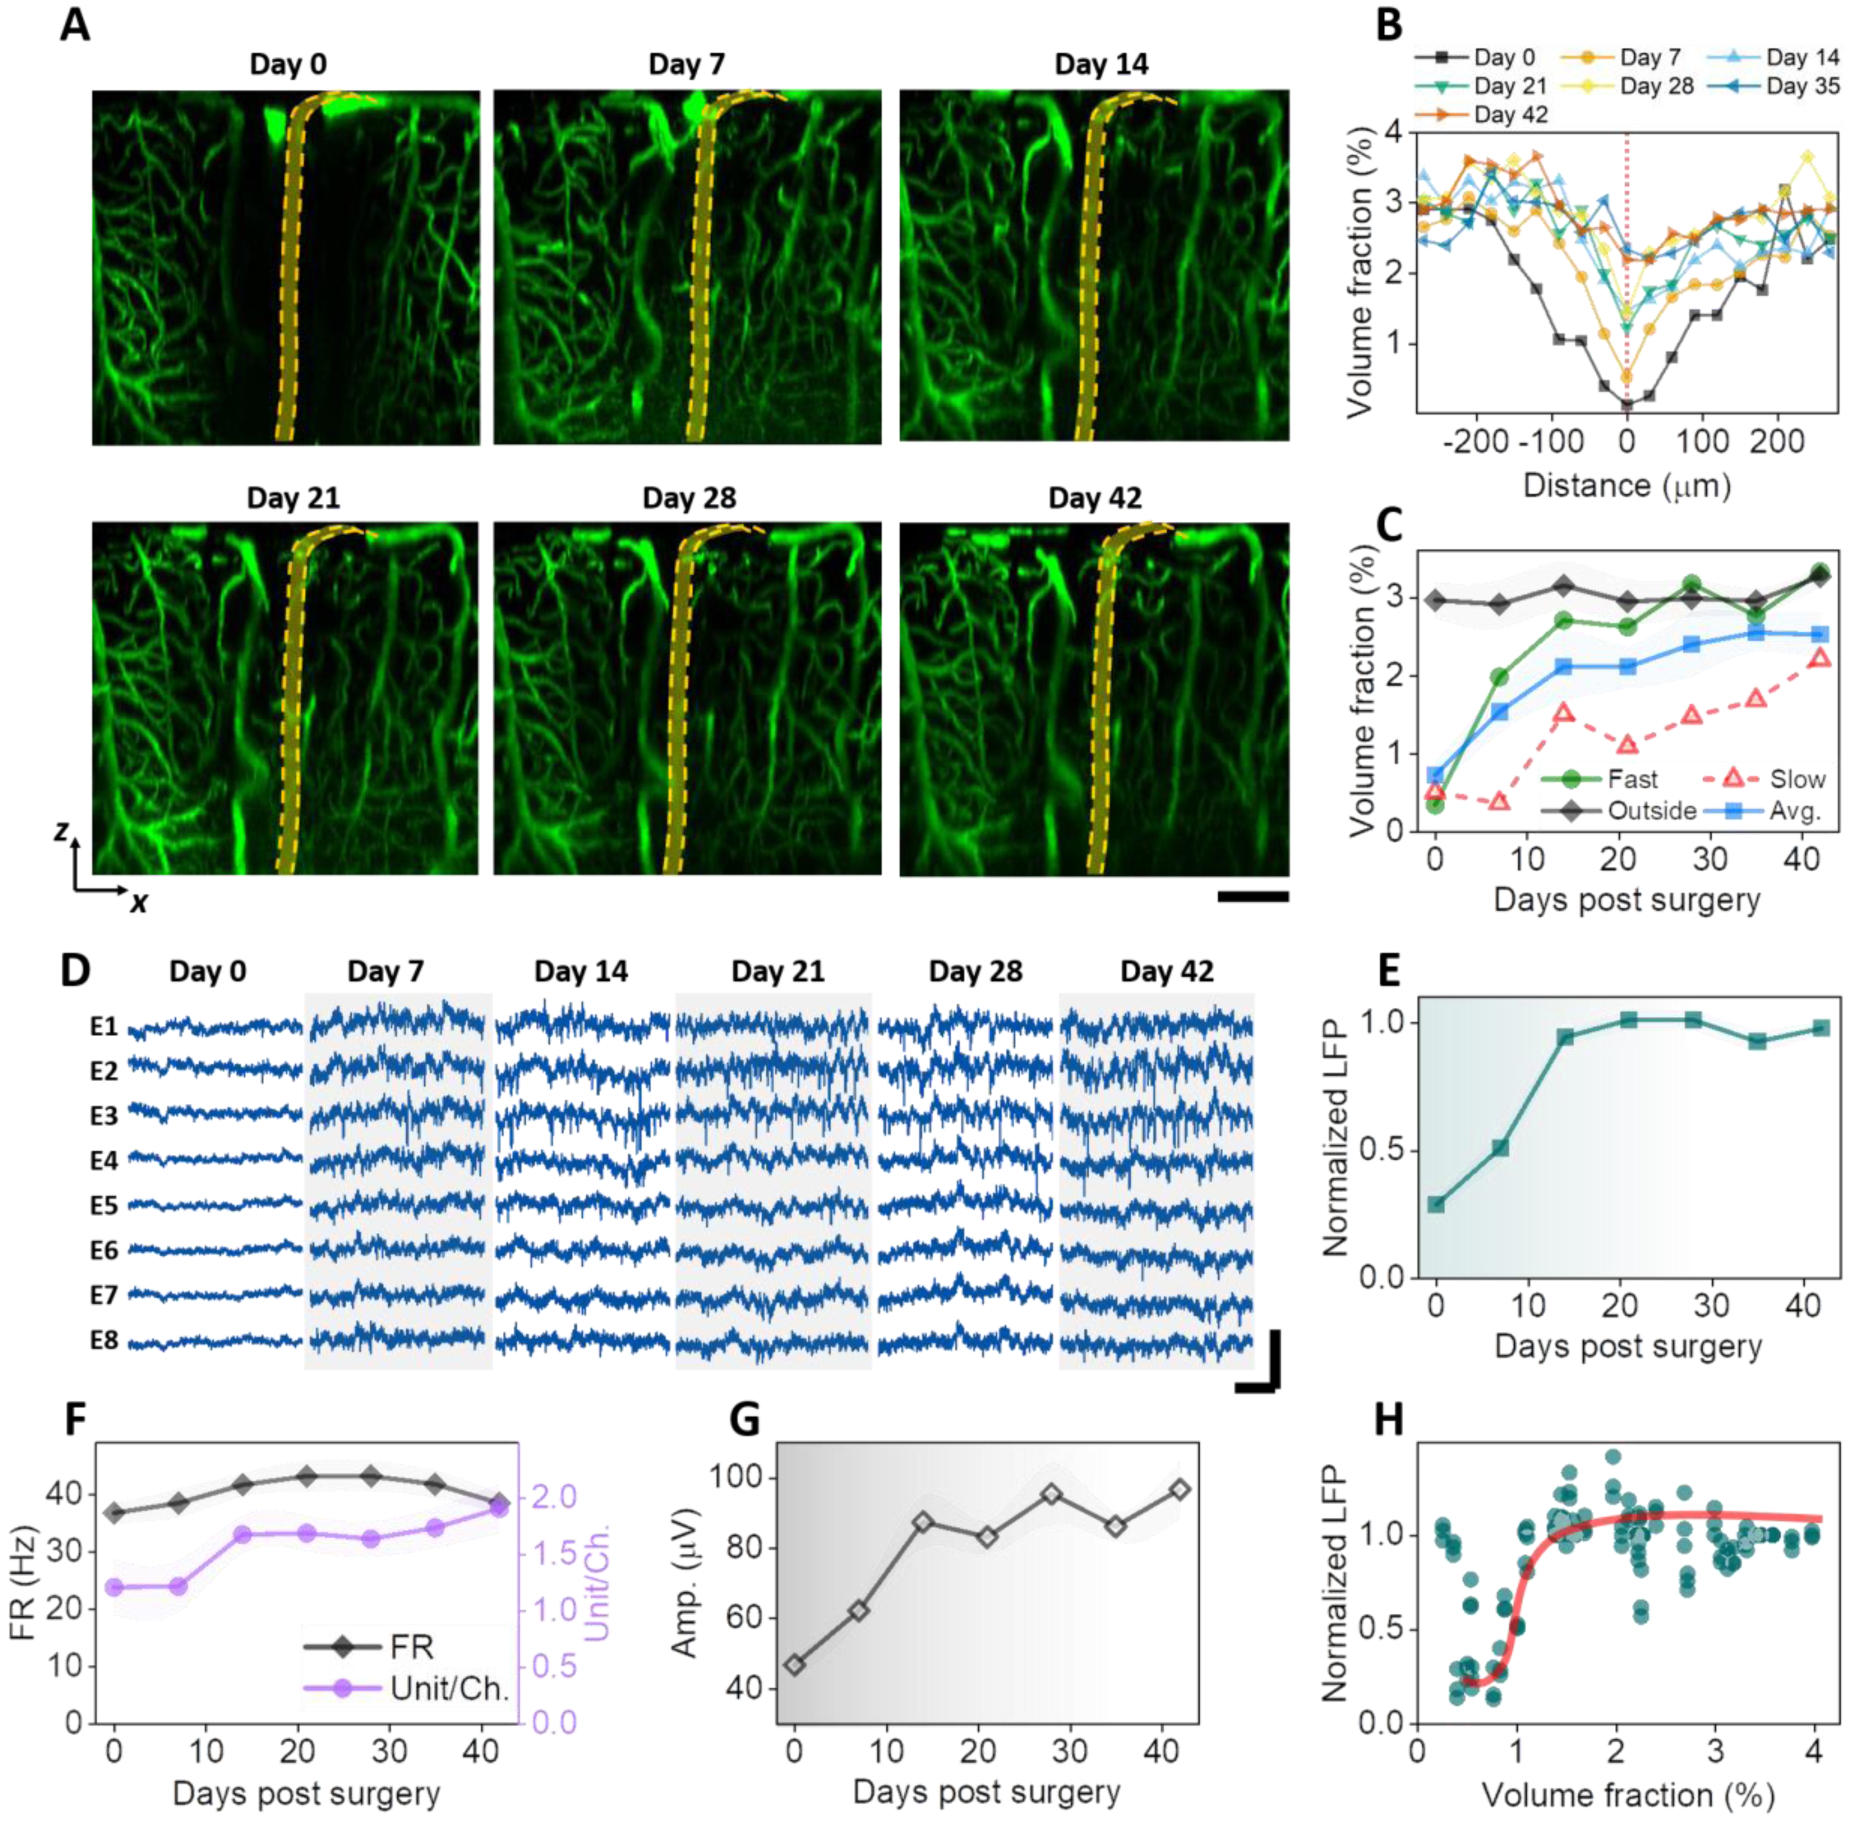
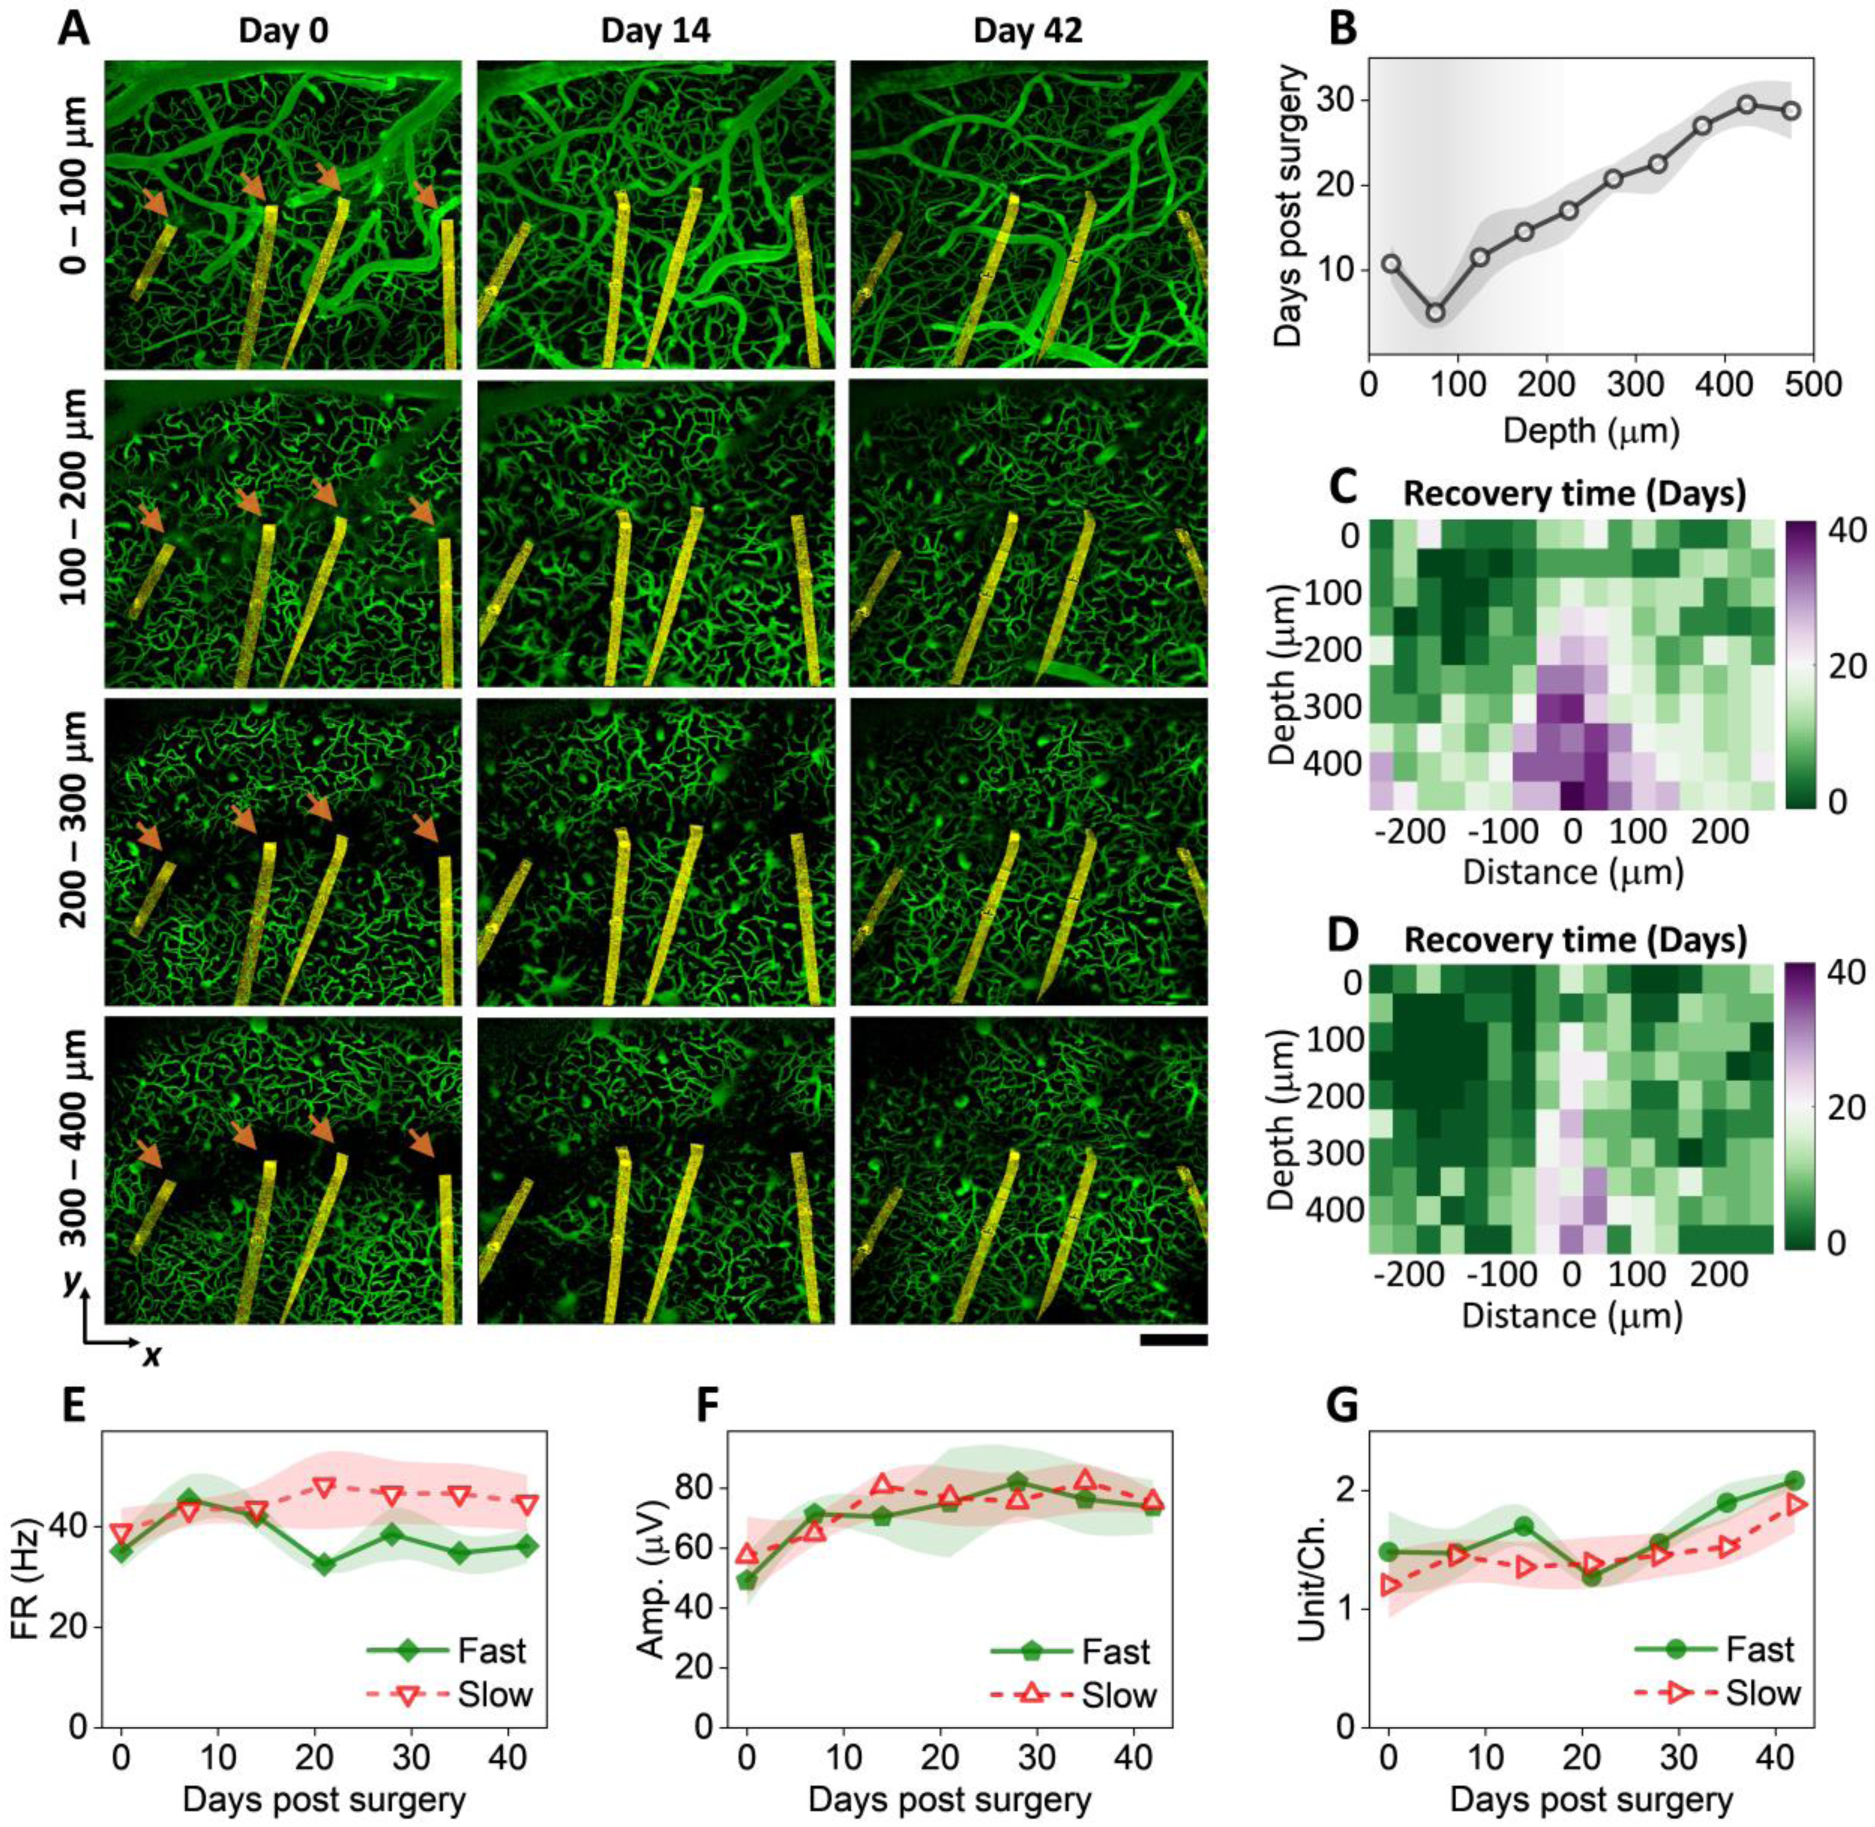
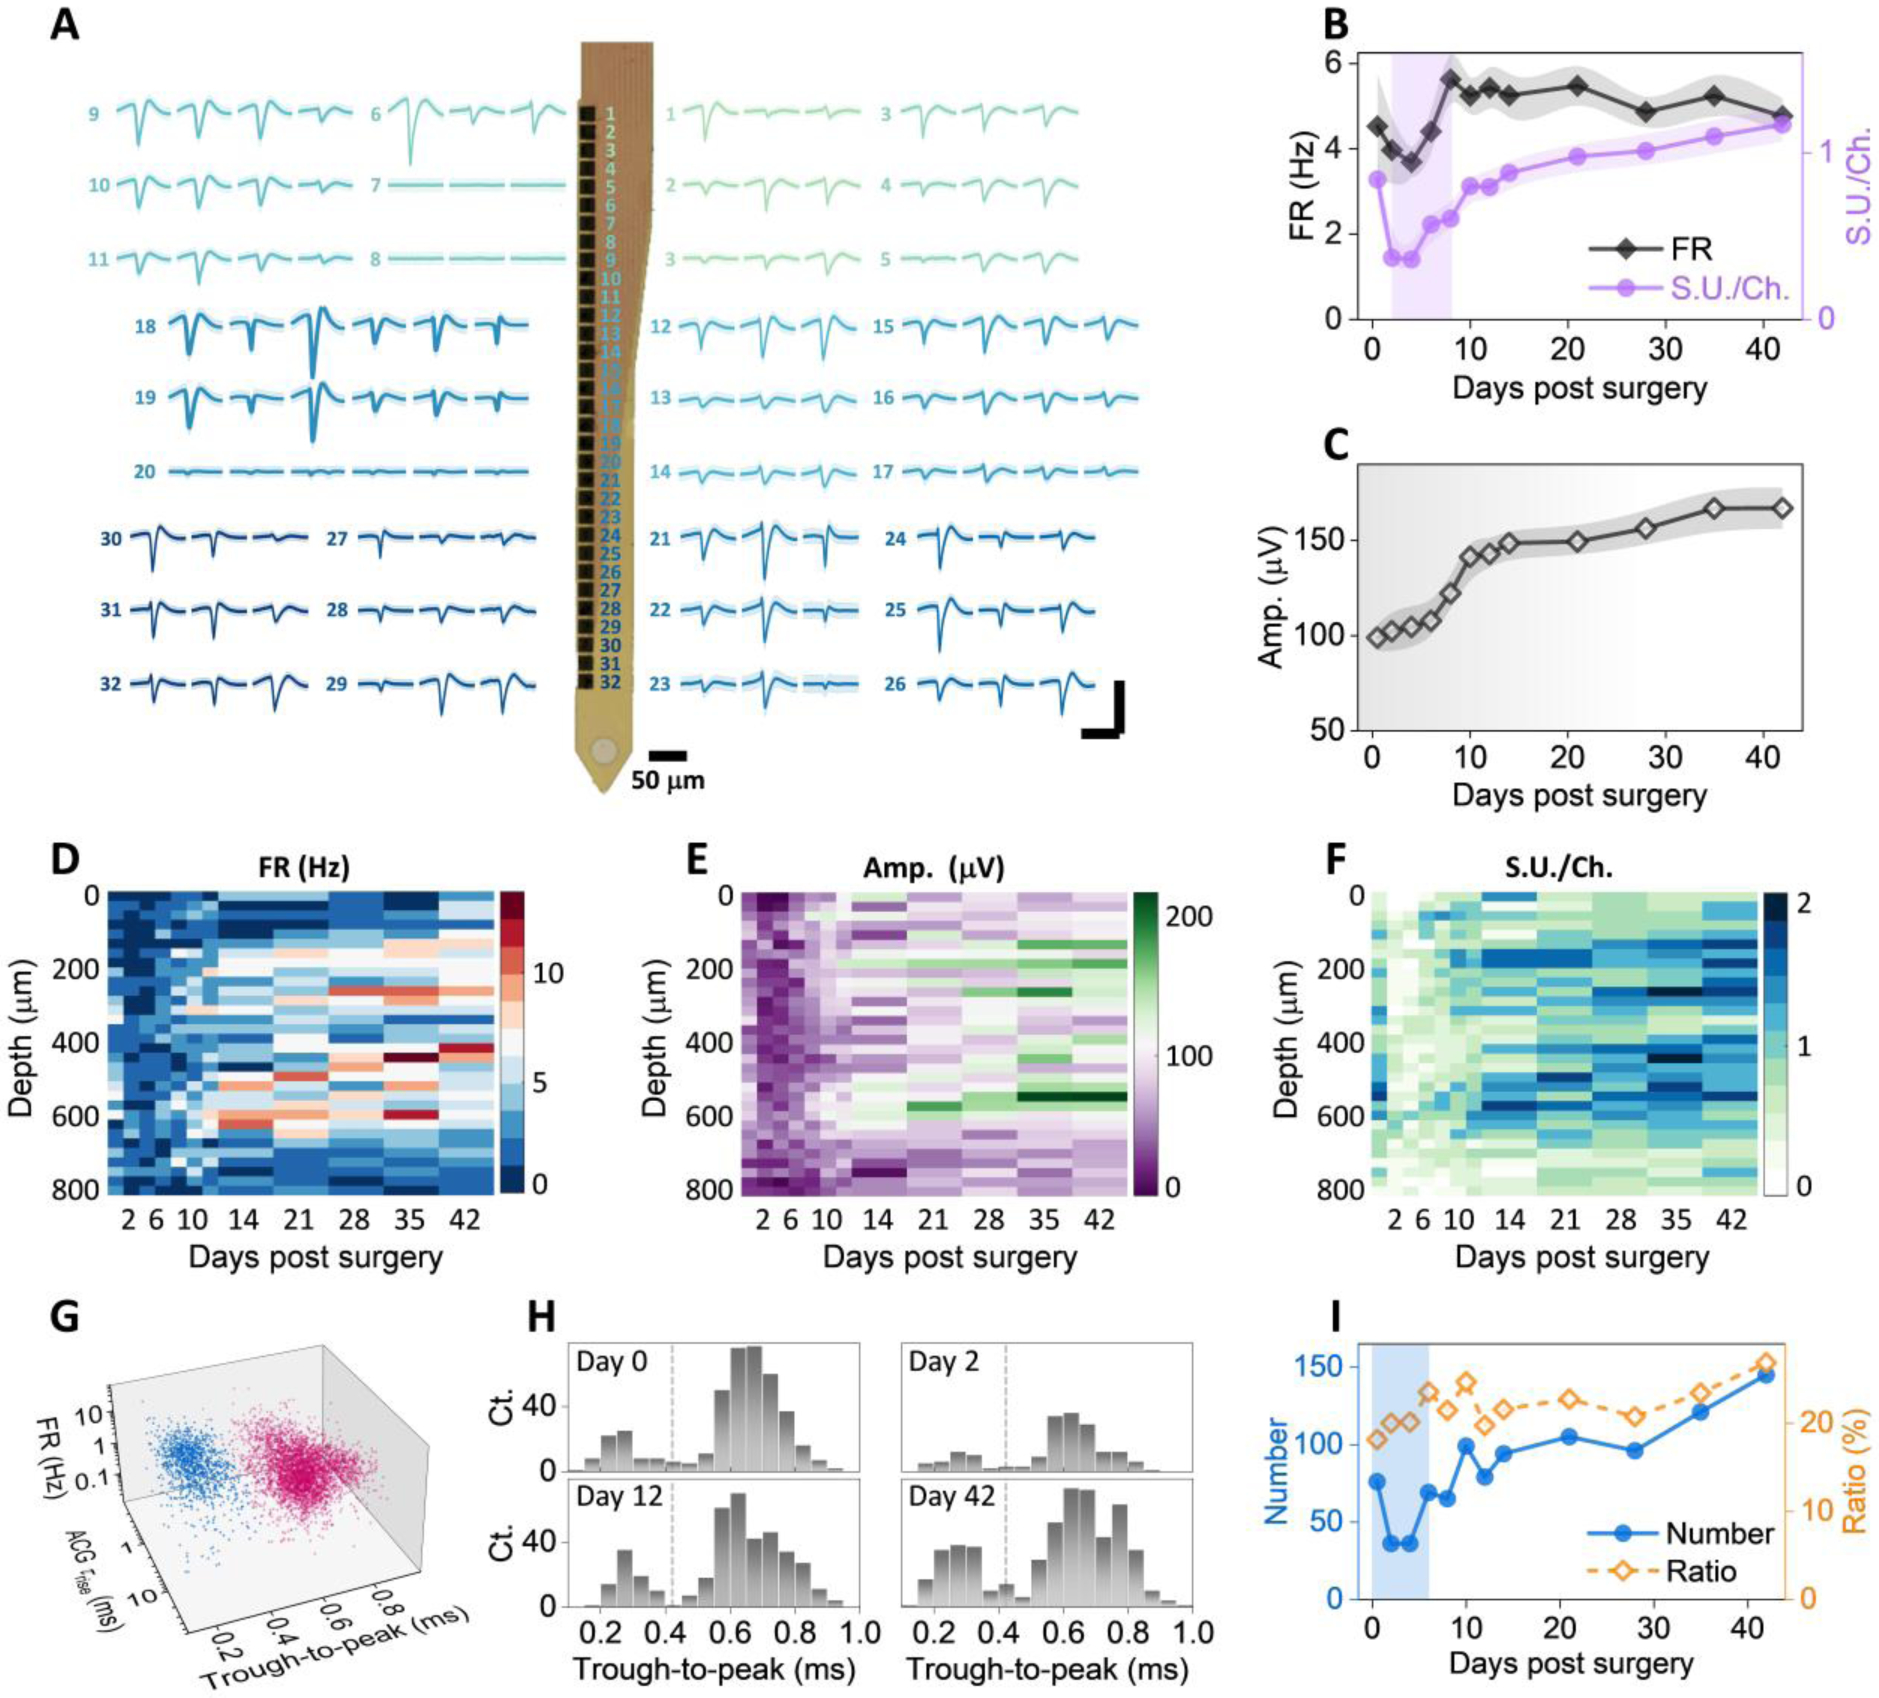
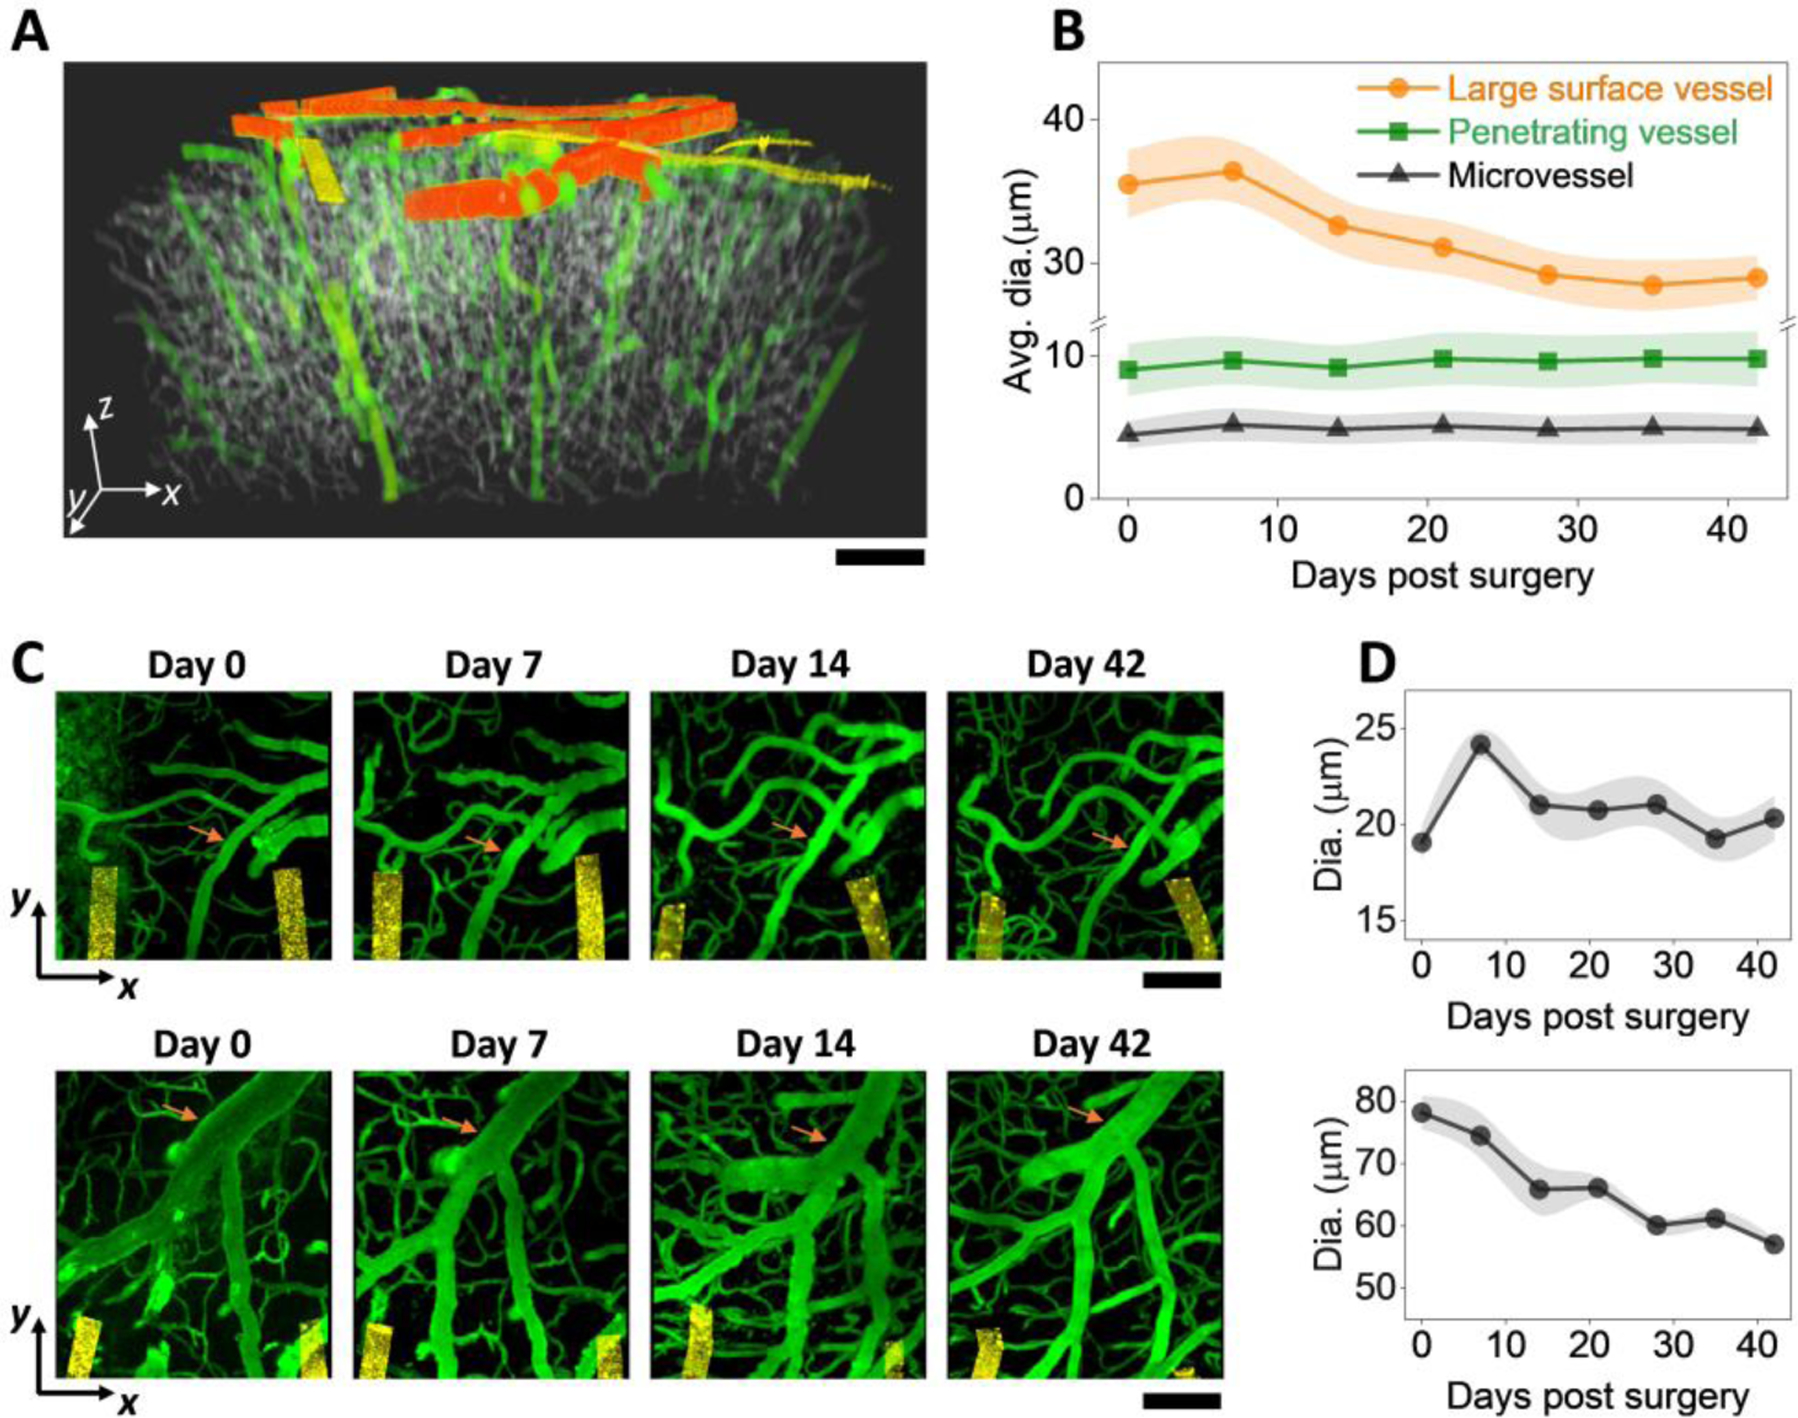
Flexible neural electrodes improve the recording longevity and quality of individual neurons by promoting tissue-electrode integration. However, the intracortical implantation of flexible electrodes inevitably induces tissue damage. Understanding the longitudinal neural and vascular recovery following the intracortical implantation is critical for the ever-growing applications of flexible electrodes in both healthy and disordered brains. Aged animals are of particular interest because they play a key role in modeling neurological disorders, but their tissue-electrode interface remains mostly unstudied. Here we integrate in-vivo two-photon imaging and electrophysiological recording to determine the time-dependent neural and vascular dynamics after the implantation of ultraflexible neural electrodes in aged mice. We find heightened angiogenesis and vascular remodeling in the first two weeks after implantation, which coincides with the rapid increase in local field potentials and unit activities detected by electrophysiological recordings. Vascular remodeling in shallow cortical layers preceded that in deeper layers, which often lasted longer than the recovery of neural signals. By six weeks post-implantation vascular abnormalities had subsided, resulting in normal vasculature and microcirculation. Putative cell classification based on firing pattern and waveform shows similar recovery time courses in fast-spiking interneurons and pyramidal neurons. These results elucidate how structural damages and remodeling near implants affecting recording efficacy, and support the application of ultraflexible electrodes in aged animals at minimal perturbations to endogenous neurophysiology.
Keywords: Chronic; Electrophysiology; In vivo two-photon imaging; Tissue-electrode interface; Ultraflexible electrode; Vasculature.
Copyright © 2022 Elsevier Ltd. All rights reserved.
Conflict of interest statement
Declaration of competing interest The authors declare the following financial interests/personal relationships which may be considered as potential competing interests:
Figures

Similar articles
-
Chronic co-implantation of ultraflexible neural electrodes and a cranial window.Neurophotonics. 2022 Jul;9(3):032204. doi: 10.1117/1.NPh.9.3.032204. Epub 2022 Jan 7. Neurophotonics. 2022. PMID: 35036472 Free PMC article.
-
Ultraflexible Neural Electrodes Enabled Synchronized Long-Term Dopamine Detection and Wideband Chronic Recording Deep in Brain.ACS Nano. 2024 Dec 17;18(50):34272-34287. doi: 10.1021/acsnano.4c12429. Epub 2024 Dec 4. ACS Nano. 2024. PMID: 39628388
-
Ultraflexible Neural Electrodes for Long-Lasting Intracortical Recording.iScience. 2020 Aug 21;23(8):101387. doi: 10.1016/j.isci.2020.101387. Epub 2020 Jul 20. iScience. 2020. PMID: 32745989 Free PMC article. Review.
-
Fluidic Microactuation of Flexible Electrodes for Neural Recording.Nano Lett. 2018 Jan 10;18(1):326-335. doi: 10.1021/acs.nanolett.7b04184. Epub 2017 Dec 15. Nano Lett. 2018. PMID: 29220192 Free PMC article.
-
Electric field-induced effects on neuronal cell biology accompanying dielectrophoretic trapping.Adv Anat Embryol Cell Biol. 2003;173:III-IX, 1-77. doi: 10.1007/978-3-642-55469-8. Adv Anat Embryol Cell Biol. 2003. PMID: 12901336 Review.
Cited by
-
Longitudinal, Multimodal Tracking Reveals Lasting Neurovascular Impact of Individual Microinfarcts.Adv Sci (Weinh). 2025 Jun;12(22):e2417003. doi: 10.1002/advs.202417003. Epub 2025 Mar 31. Adv Sci (Weinh). 2025. PMID: 40163360 Free PMC article.
-
Ultraflexible electrodes for recording neural activity in the mouse spinal cord during motor behavior.Cell Rep. 2024 May 28;43(5):114199. doi: 10.1016/j.celrep.2024.114199. Epub 2024 May 9. Cell Rep. 2024. PMID: 38728138 Free PMC article.
-
Behavioral paradigm for the evaluation of stimulation-evoked somatosensory perception thresholds in rats.Front Neurosci. 2023 Jun 13;17:1202258. doi: 10.3389/fnins.2023.1202258. eCollection 2023. Front Neurosci. 2023. PMID: 37383105 Free PMC article.
-
Low-threshold, high-resolution, chronically stable intracortical microstimulation by ultraflexible electrodes.Cell Rep. 2023 Jun 27;42(6):112554. doi: 10.1016/j.celrep.2023.112554. Epub 2023 May 24. Cell Rep. 2023. PMID: 37235473 Free PMC article.
-
Multi-channel microelectrode arrays for detection of single-cell level neural information in the hippocampus CA1 under general anesthesia induced by low-dose isoflurane.Fundam Res. 2023 Jun 19;5(1):72-81. doi: 10.1016/j.fmre.2023.05.015. eCollection 2025 Jan. Fundam Res. 2023. PMID: 40166120 Free PMC article.
References
Publication types
MeSH terms
Grants and funding
LinkOut - more resources
Full Text Sources
