. 2022 Dec 31:637:170-180.
doi: 10.1016/j.bbrc.2022.11.014. Epub 2022 Nov 13.

Sirtuin 1 aggravates hypertrophic heart failure caused by pressure overload via shifting energy metabolism

Affiliations

Sirtuin 1 aggravates hypertrophic heart failure caused by pressure overload via shifting energy metabolism

Tran Ngoc Van Le et al. Biochem Biophys Res Commun. .

Abstract

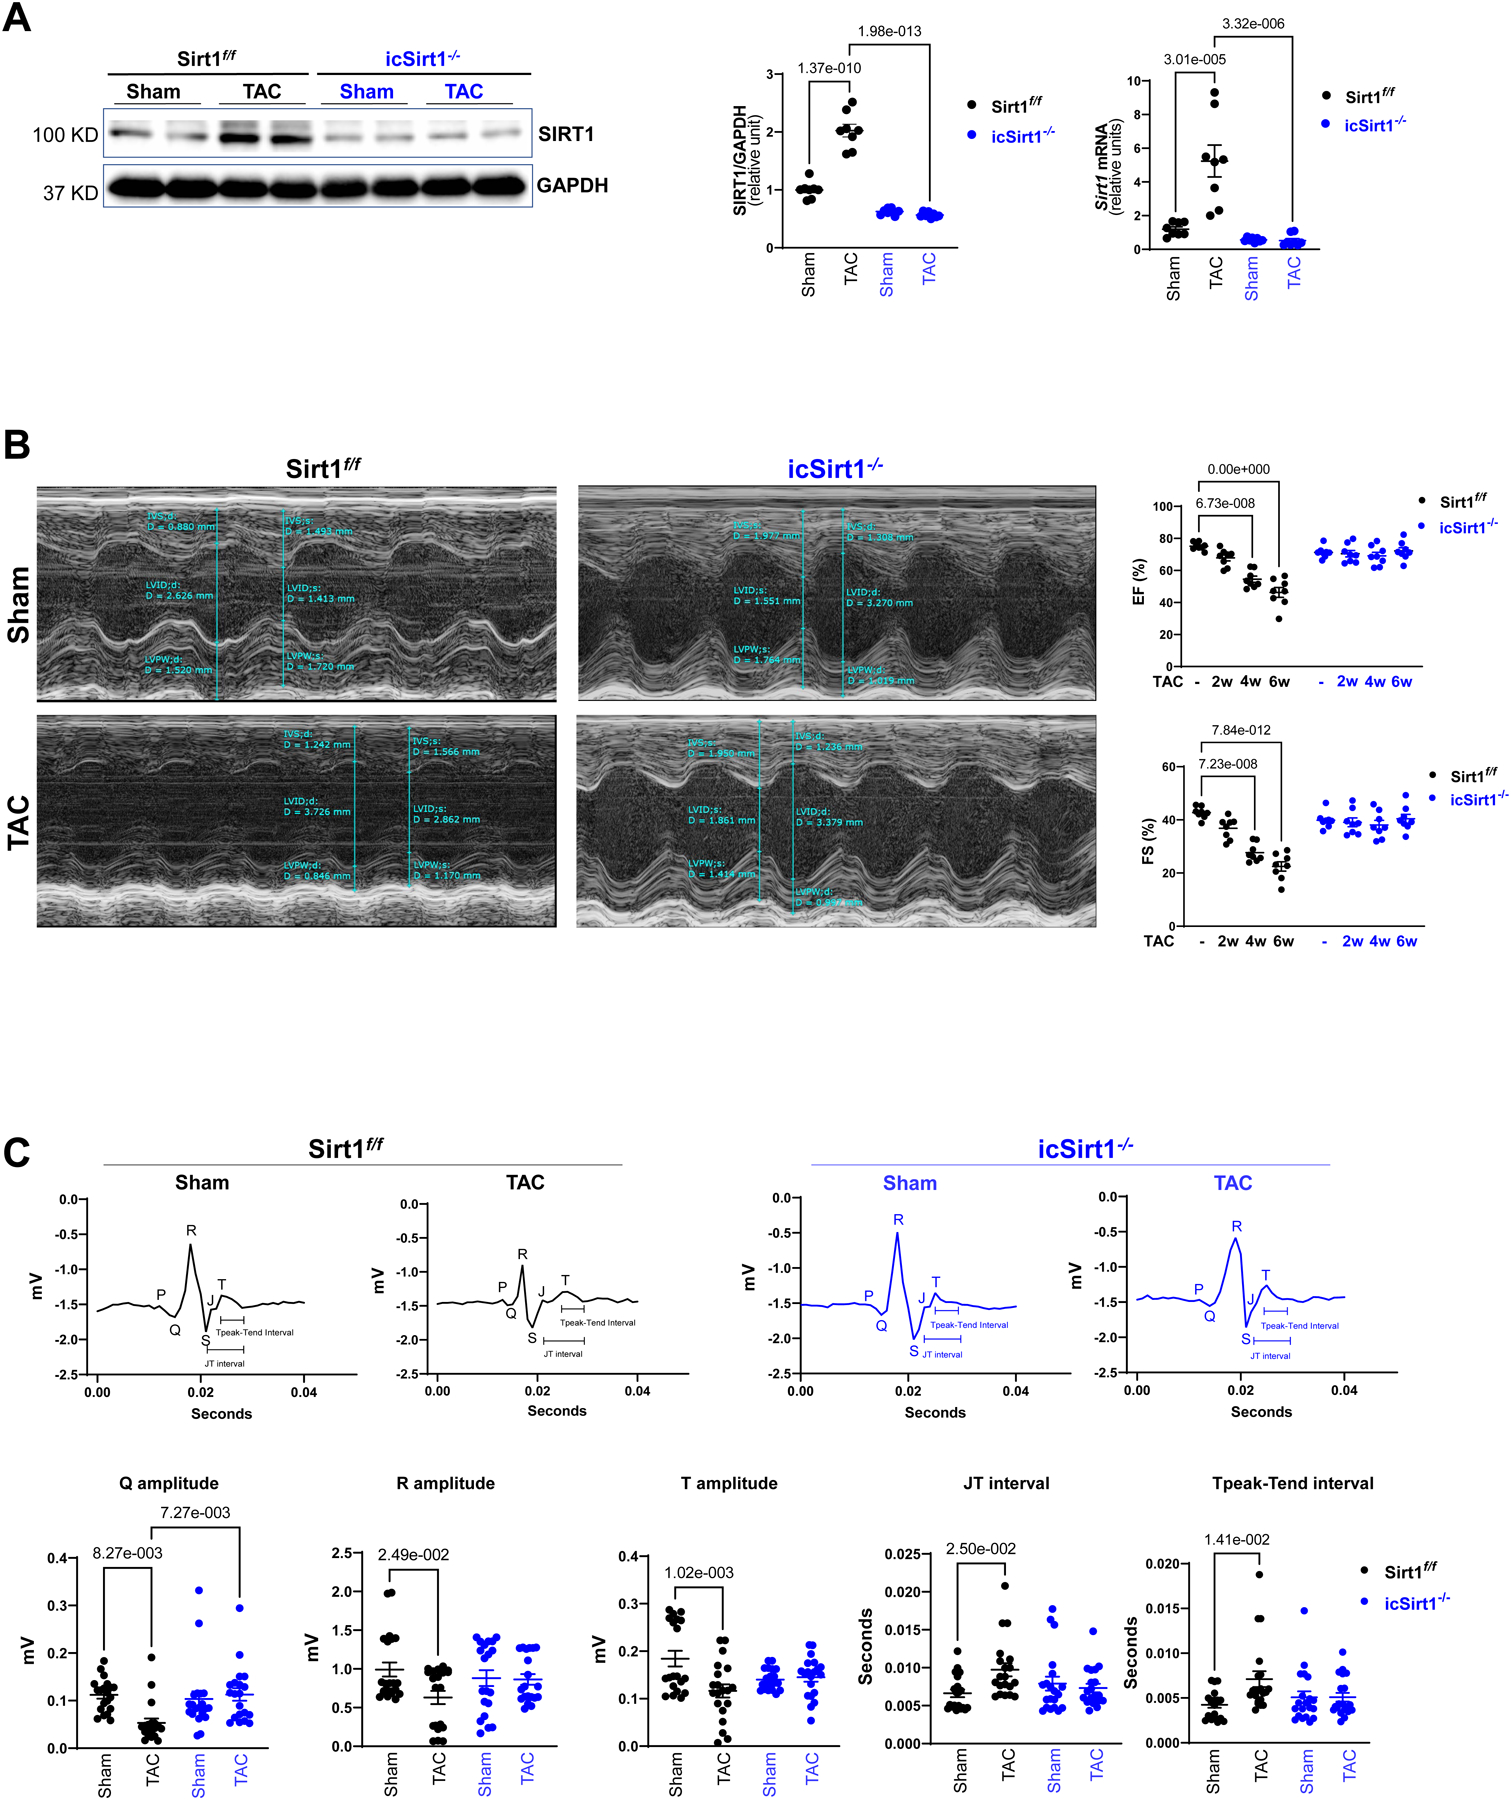
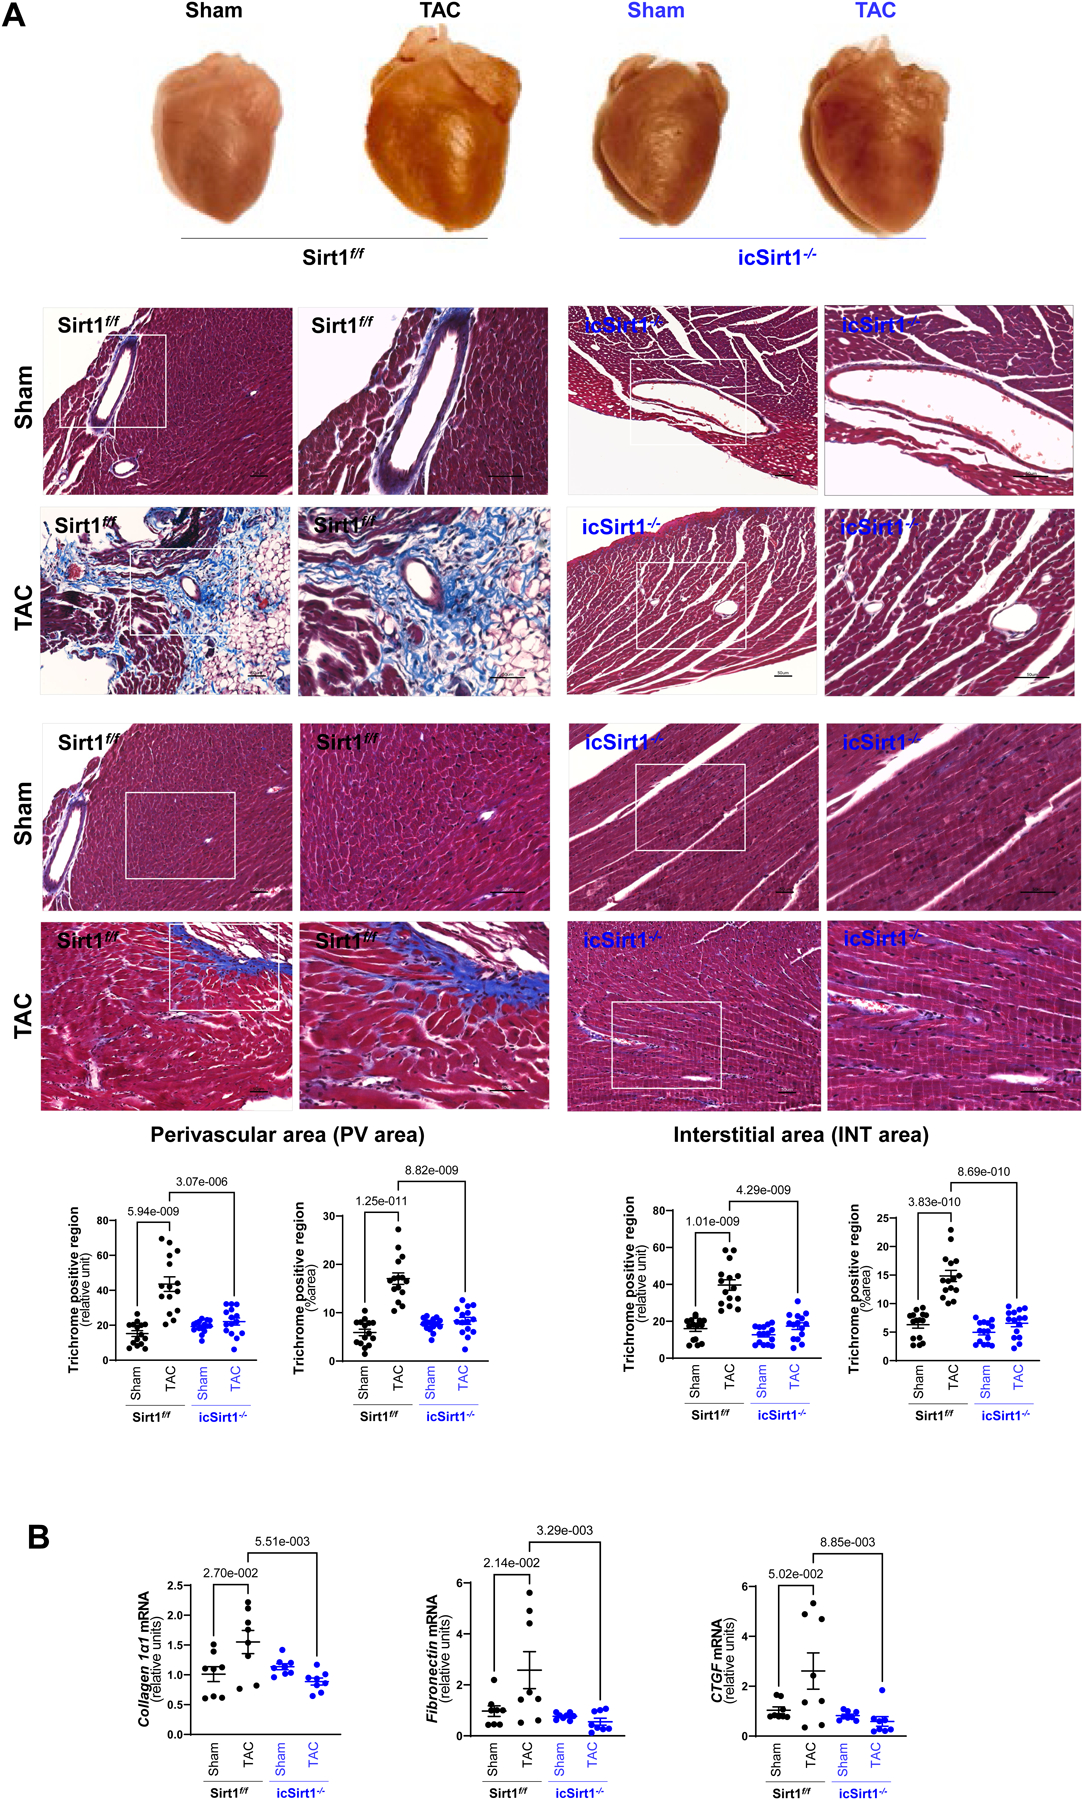
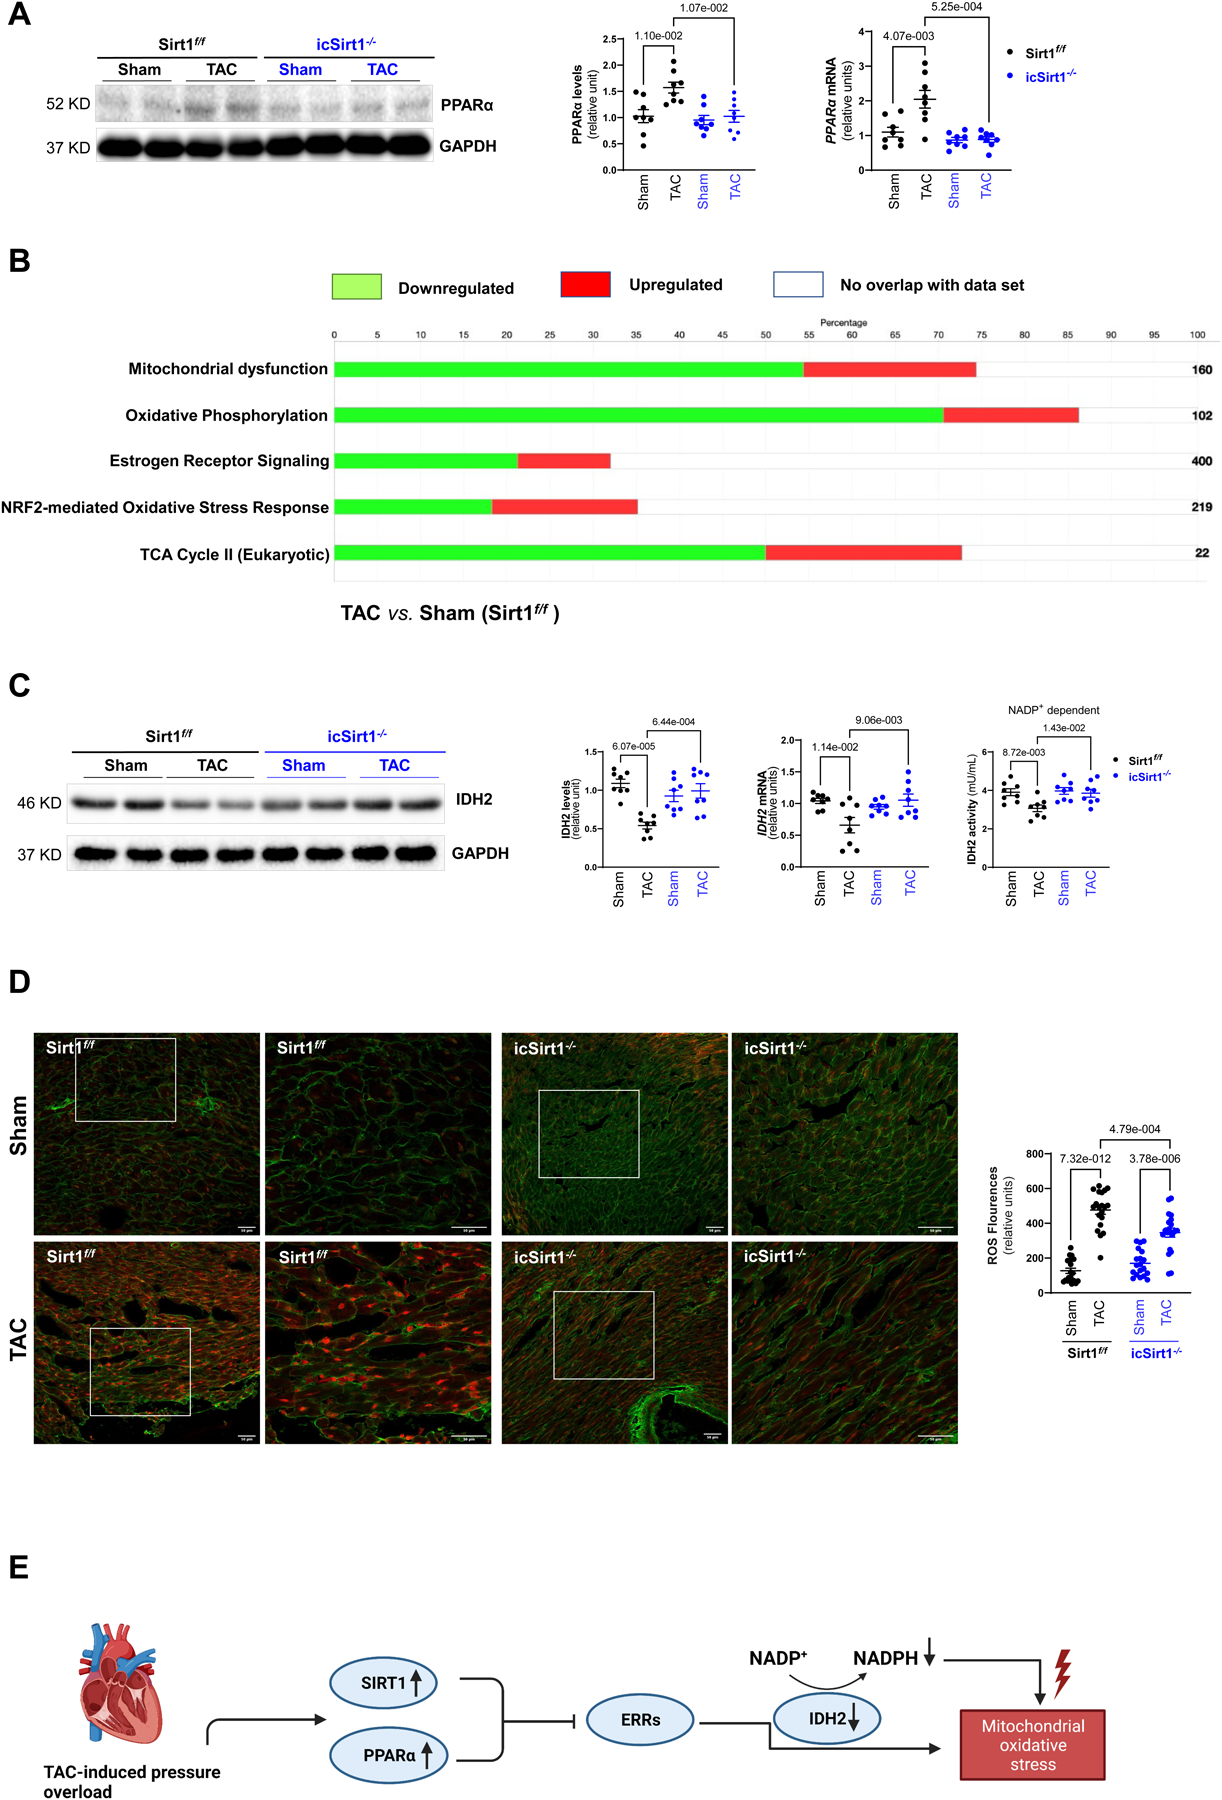
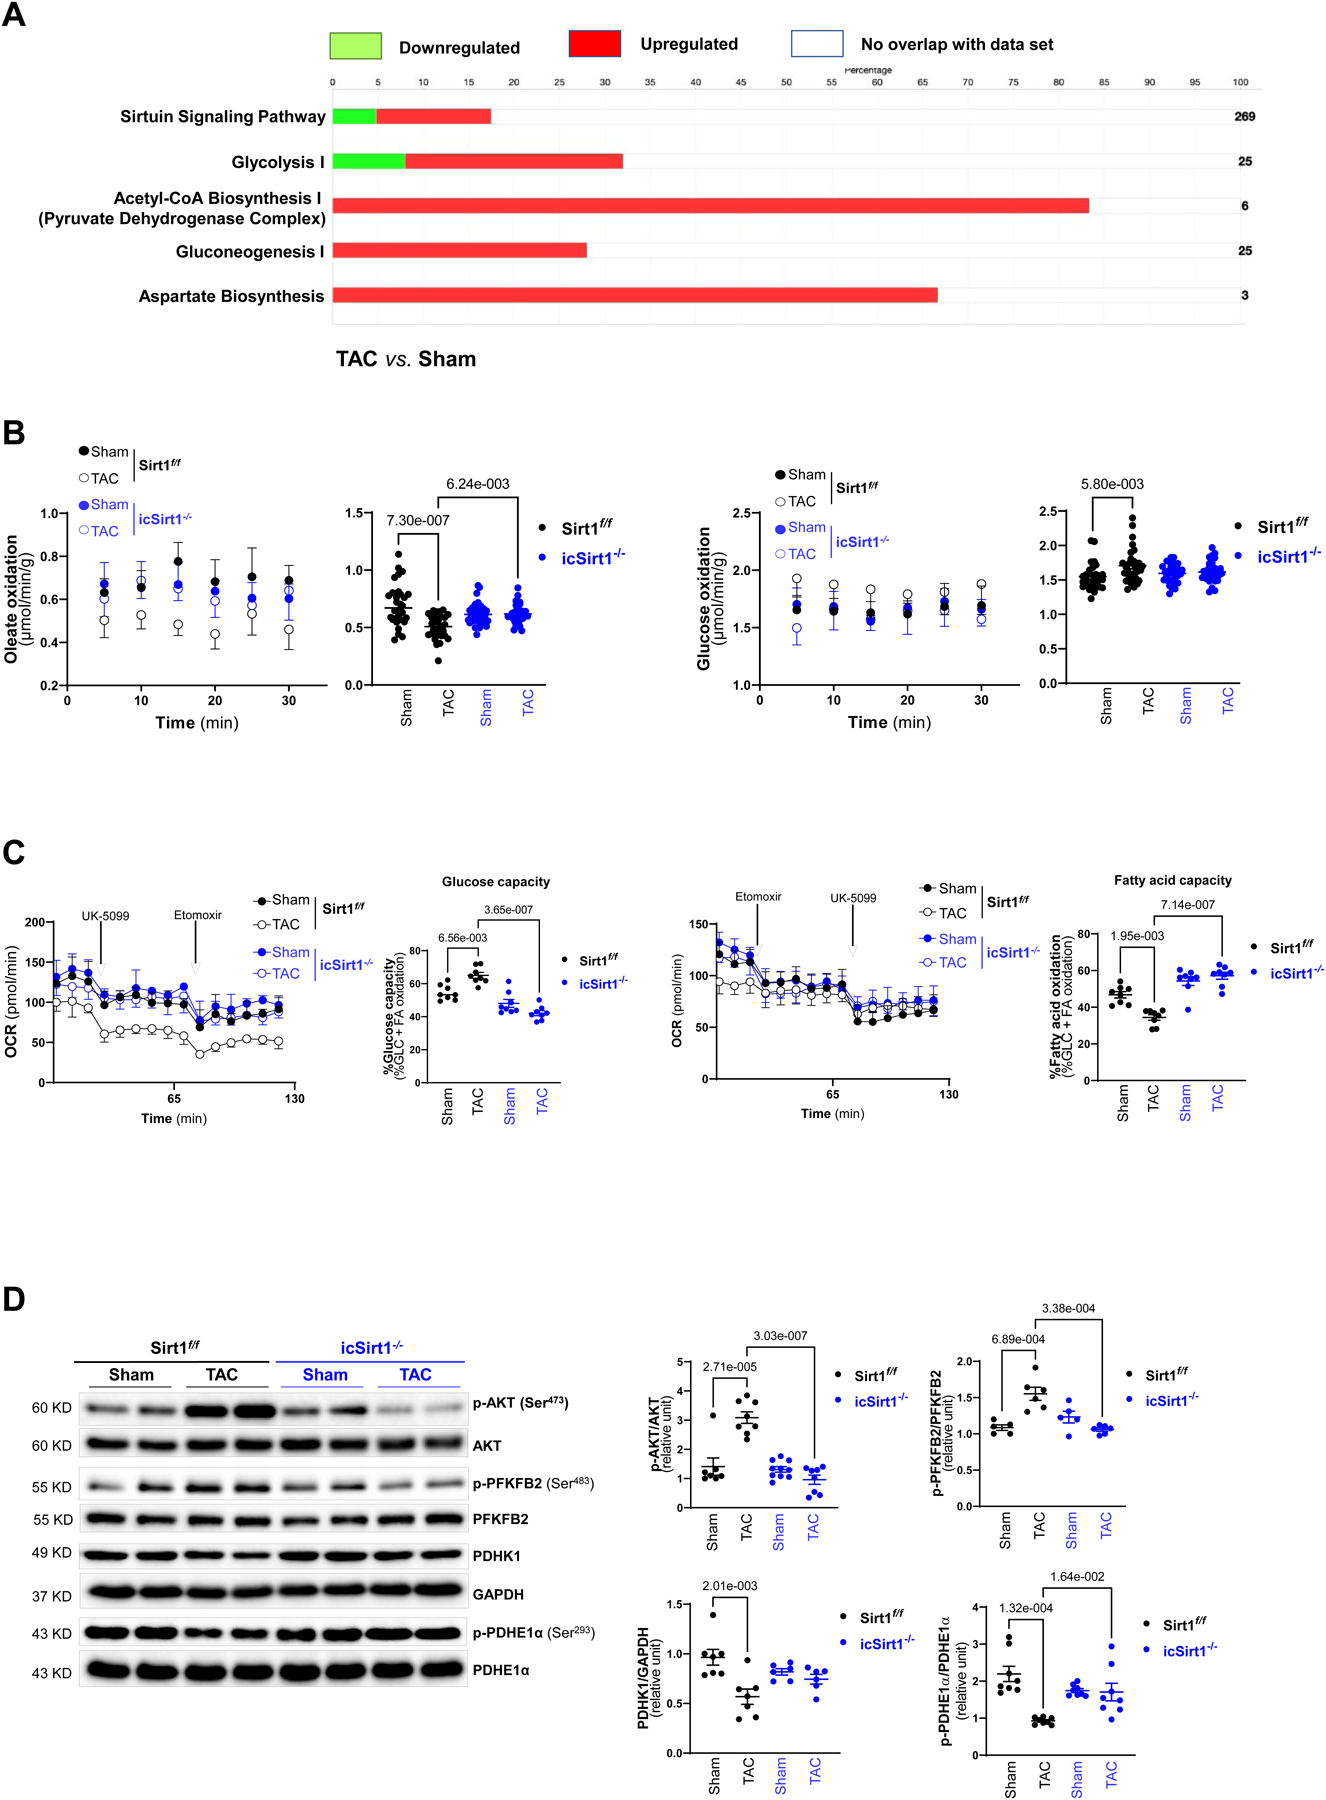
Sirtuin1 (SIRT1) is involved in regulating substrate metabolism in the cardiovascular system. Metabolic homeostasis plays a critical role in hypertrophic heart failure. We hypothesize that cardiac SIRT1 can modulate substrate metabolism during pressure overload-induced heart failure. The inducible cardiomyocyte Sirt1 knockout (icSirt1-/-) and its wild type littermates (Sirt1f/f) C57BL/6J mice were subjected to transverse aortic constriction (TAC) surgery to induce pressure overload. The pressure overload induces upregulation of cardiac SIRT1 in Sirt1f/f but not icSirt1-/- mice. The cardiac contractile dysfunctions caused by TAC-induced pressure overload occurred in Sirt1f/f but not in icSirt1-/- mice. Intriguingly, Sirt1f/f heart showed a drastic reduction in systolic contractility and electric signals during post-TAC surgery, whereas icSirt1-/- heart demonstrated significant resistance to pathological stress by TAC-induced pressure overload as evidenced by no significant changes in systolic contractile functions and electric properties. The targeted proteomics showed that the pressure overload triggered downregulation of the SIRT1-associated IDH2 (isocitrate dehydrogenase 2) that resulted in increased oxidative stress in mitochondria. Moreover, metabolic alterations were observed in Sirt1f/f but not in icSirt1-/- heart in response to TAC-induced pressure overload. Thus, SIRT1 interferes with metabolic homeostasis through mitochondrial IDH2 during pressure overload. Inhibition of SIRT1 activity benefits cardiac functions under pressure overload-related pathological conditions.

Keywords: Mitochondria; Pressure overload; SIRT1; Substrate metabolism.


Conflict of interest statement

Declaration of competing interest The authors declare no conflict of interest.

Figures

Figure 1.
Figure 1.. Upregulated SIRT1 exacerbated cardiac dysfunction under pressure overload-induced heart failure (HF).
(A) The protein and mRNA expression levels of SIRT1 were upregulated in the left ventricles (LV) of Sirt1f/f heart after 6 weeks of transverse aortic constriction (TAC)-induced pressure overload. Biological replicates N=8 for each group. P value was determined by two-way ANOVA with Tukey’s post-hoc test. (B) Echocardiography showed that Sirt1f/f mice were vulnerable to TAC-induced pressure overload, as shown by decreased ejection fraction (EF) and fractional shortening (FS). Left: Representative images of M-mode echocardiography. Right: Quantification of echocardiography measurements for EF and FS. Biological replicates N=8 for each group. P value was determined by two-way ANOVA with Tukey’s post-hoc test. (C) Electrocardiography (ECG) showed that Sirt1f/f mice developed cardiac contractile dysfunction under 6 weeks of post TAC with reduced Q, R, and T amplitudes and prolonged JT and Tpeak-Tend interval. Upper: Representative images of ECG parameters. Lower: Quantification of ECG measurements. Biological replicates N=8 for each group. P value was determined by two-way ANOVA with Tukey’s post-hoc test. Biological replicates N=8 for each group. P value was determined by two-way ANOVA with Tukey’s post-hoc test.
Figure 2.
Figure 2.. Deletion of cardiomyocyte SIRT1 attenuated cardiac remodeling induced by pressure overload.
(A) Upper: Representative hearts from Sirt1f/f and icSirt1−/− under sham operations (Sham) or 6 weeks of TAC surgery-induced pressure overload (TAC). Middle: Representative images of perivascular and interstitial fibrosis measured by Masson’s trichrome staining. The scale bars are 50 μm. Lower: Quantification analysis of Masson’s trichrome staining. Biological replicates N=5 for each group. P value was determined by two-way ANOVA with Tukey’s post-hoc test. (B) Quantitation for real time RT-PCR for mRNA expression of collagen type 1 alpha 1 chain (Col1α1), fibronectin (Fn1), and connective tissue growth factor (Ctgf) in LV tissue. Biological replicates N=8 for each group. P value was determined by two-way ANOVA with Tukey’s post-hoc test.
Figure 3.
Figure 3.. SIRT1 plays a role in mitochondrial oxdative phosphorylation in response to TAC-induced pressure overload.
(A) TAC-induced pressure overload stress increased protein and mRNA expression levels of PPARα in Sirt1f/f mice. Biological replicates N=8 for each group. P value was determined by two-way ANOVA with Tukey’s post-hoc test. (B) Ingenuity pathway analysis (IPA) enrichment analysis of targeted proteomics of Sirt1f/f heart with 6 weeks of post TAC versus sham group. Green bars representing the percentage of genes in the pathway were downregulated in Sirt1f/f 6 weeks of post TAC versus Sham. Red bars representing the percentage of genes in the pathway were upregulated in Sirt1f/f 6 weeks of post TAC versus Sham. White bars representing the percentage of genes in the pathway were not altered in Sirt1f/f 6 weeks of post TAC versus Sham. Biological replicates N=3 for each group. (C) Reduction of the IDH2 protein, mRNA expression levels, and NADP+ dependent activity in Sirt1f/f but not in icSirt1−/− heart in response to 6 weeks of TAC-induced stress. Biological replicates N=8 for each group. P value was determined by two-way ANOVA with Tukey’s post-hoc test. (D) MitoSOX staining showed a substantial increase in superoxide accumulation in the heart of Sirt1f/f after 6 weeks of TAC. Left: Representative microscopy images of reactive oxygen species staining. The scale bars are 50 μm. Right: Quantification analysis of MitoSOX staining. Biological replicates N=5 for each group. P value was determined by two-way ANOVA with Tukey’s post-hoc test. (E) Schematic representations of the regulatory roles of SIRT1 and PPARα in mitochondrial oxidative stress during TAC-induced pathological conditions.
Figure 4.
Figure 4.. SIRT1-AKT signaling cascade modulates glucose metabolism in response to TAC-induced pathological stress.
(A) Ingenuity pathway analysis (IPA) enrichment analysis of SIRT1 associated proteins in Sirt1f/f 6 weeks of post TAC versus sham. Green bars representing the percentage of genes in the pathway were downregulated in Sirt1f/f 6 weeks of post TAC versus sham. Red bars representing the percentage of genes in the pathway were upregulated in Sirt1f/f 6 weeks of post TAC versus sham. White bars representing the percentage of genes in the pathway were not altered in response to TAC or not associated with SIRT1 under physiolocal and pathological conditions. Biological replicates N=3 for each group. (B) Glucose oxidation and oleate oxidation were analyzed by measuring [14C]-glucose incorporation into 14CO2 and incorporation of [9,10-3H] oleate into 3H2O, respectively, in the ex vivo mouse working heart system for 30 minutes. Sirt1f/f 6 weeks of post TAC resulted in increased glucose utilization and decreased fatty acid oxidation. Biological replicates N=6 for each group. P value was determined by two-way ANOVA with Tukey’s post-hoc test. (C) Seahorse fuel flex assay examined substrate utilization by measuring the OCR in Sirt1f/f and icSirt1−/− hearts under sham or 6 weeks of TAC. UK5099 (8 μM) and Etomoxir (4 μM) were added to isolated cardiomyocytes of all groups. Left: Representatives of mitochondrial fuel flex assay. Right: Quantitative analysis of substrate metabolism parameters (glucose capacity and fatty acid capacity). Biological replicates N=6 for each group. P value was determined by two-way ANOVA with Tukey’s post-hoc test. (D) The immunoblotting analysis for AKT, PFKFB2, PDHK1, PDHE1α, and GAPDH signaling response of Sirt1f/f and icSirt1−/− hearts under sham or 6 weeks of TAC conditions. Biological replicates N=8 for each group. P value was determined by two-way ANOVA with Tukey’s post-hoc test.

References

    1. Russell LK, Finck BN, Kelly DP, Mouse models of mitochondrial dysfunction and heart failure, J Mol Cell Cardiol 38 (2005) 81–91. 10.1016/j.yjmcc.2004.10.010. - DOI - PubMed
    1. Ritterhoff J, Young S, Villet O, Shao D, Neto FC, Bettcher LF, Hsu YA, Kolwicz SC Jr., Raftery D, Tian R, Metabolic Remodeling Promotes Cardiac Hypertrophy by Directing Glucose to Aspartate Biosynthesis, Circ Res 126 (2020) 182–196. 10.1161/CIRCRESAHA.119.315483. - DOI - PMC - PubMed
    1. Gu C, Xing Y, Jiang L, Chen M, Xu M, Yin Y, Li C, Yang Z, Yu L, Ma H, Impaired cardiac SIRT1 activity by carbonyl stress contributes to aging-related ischemic intolerance, PLoS One 8 (2013) e74050. 10.1371/journal.pone.0074050. - DOI - PMC - PubMed
    1. Alcendor RR, Gao S, Zhai P, Zablocki D, Holle E, Yu X, Tian B, Wagner T, Vatner SF, Sadoshima J, Sirt1 regulates aging and resistance to oxidative stress in the heart, Circ Res 100 (2007) 1512–1521. 01.RES.0000267723.65696.4a [pii]10.1161/01.RES.0000267723.65696.4a. - DOI - PubMed
    1. Sundaresan NR, Pillai VB, Gupta MP, Emerging roles of SIRT1 deacetylase in regulating cardiomyocyte survival and hypertrophy, J Mol Cell Cardiol 51 (2011) 614–618. 10.1016/j.yjmcc.2011.01.008. - DOI - PMC - PubMed

Publication types