. 2022 Dec;25(4):100865.
doi: 10.1016/j.tvir.2022.100865. Epub 2022 Sep 6.

Venous Evaluation

Affiliations

Venous Evaluation

Akshaar Brahmbhatt et al. Tech Vasc Interv Radiol. 2022 Dec.

Abstract

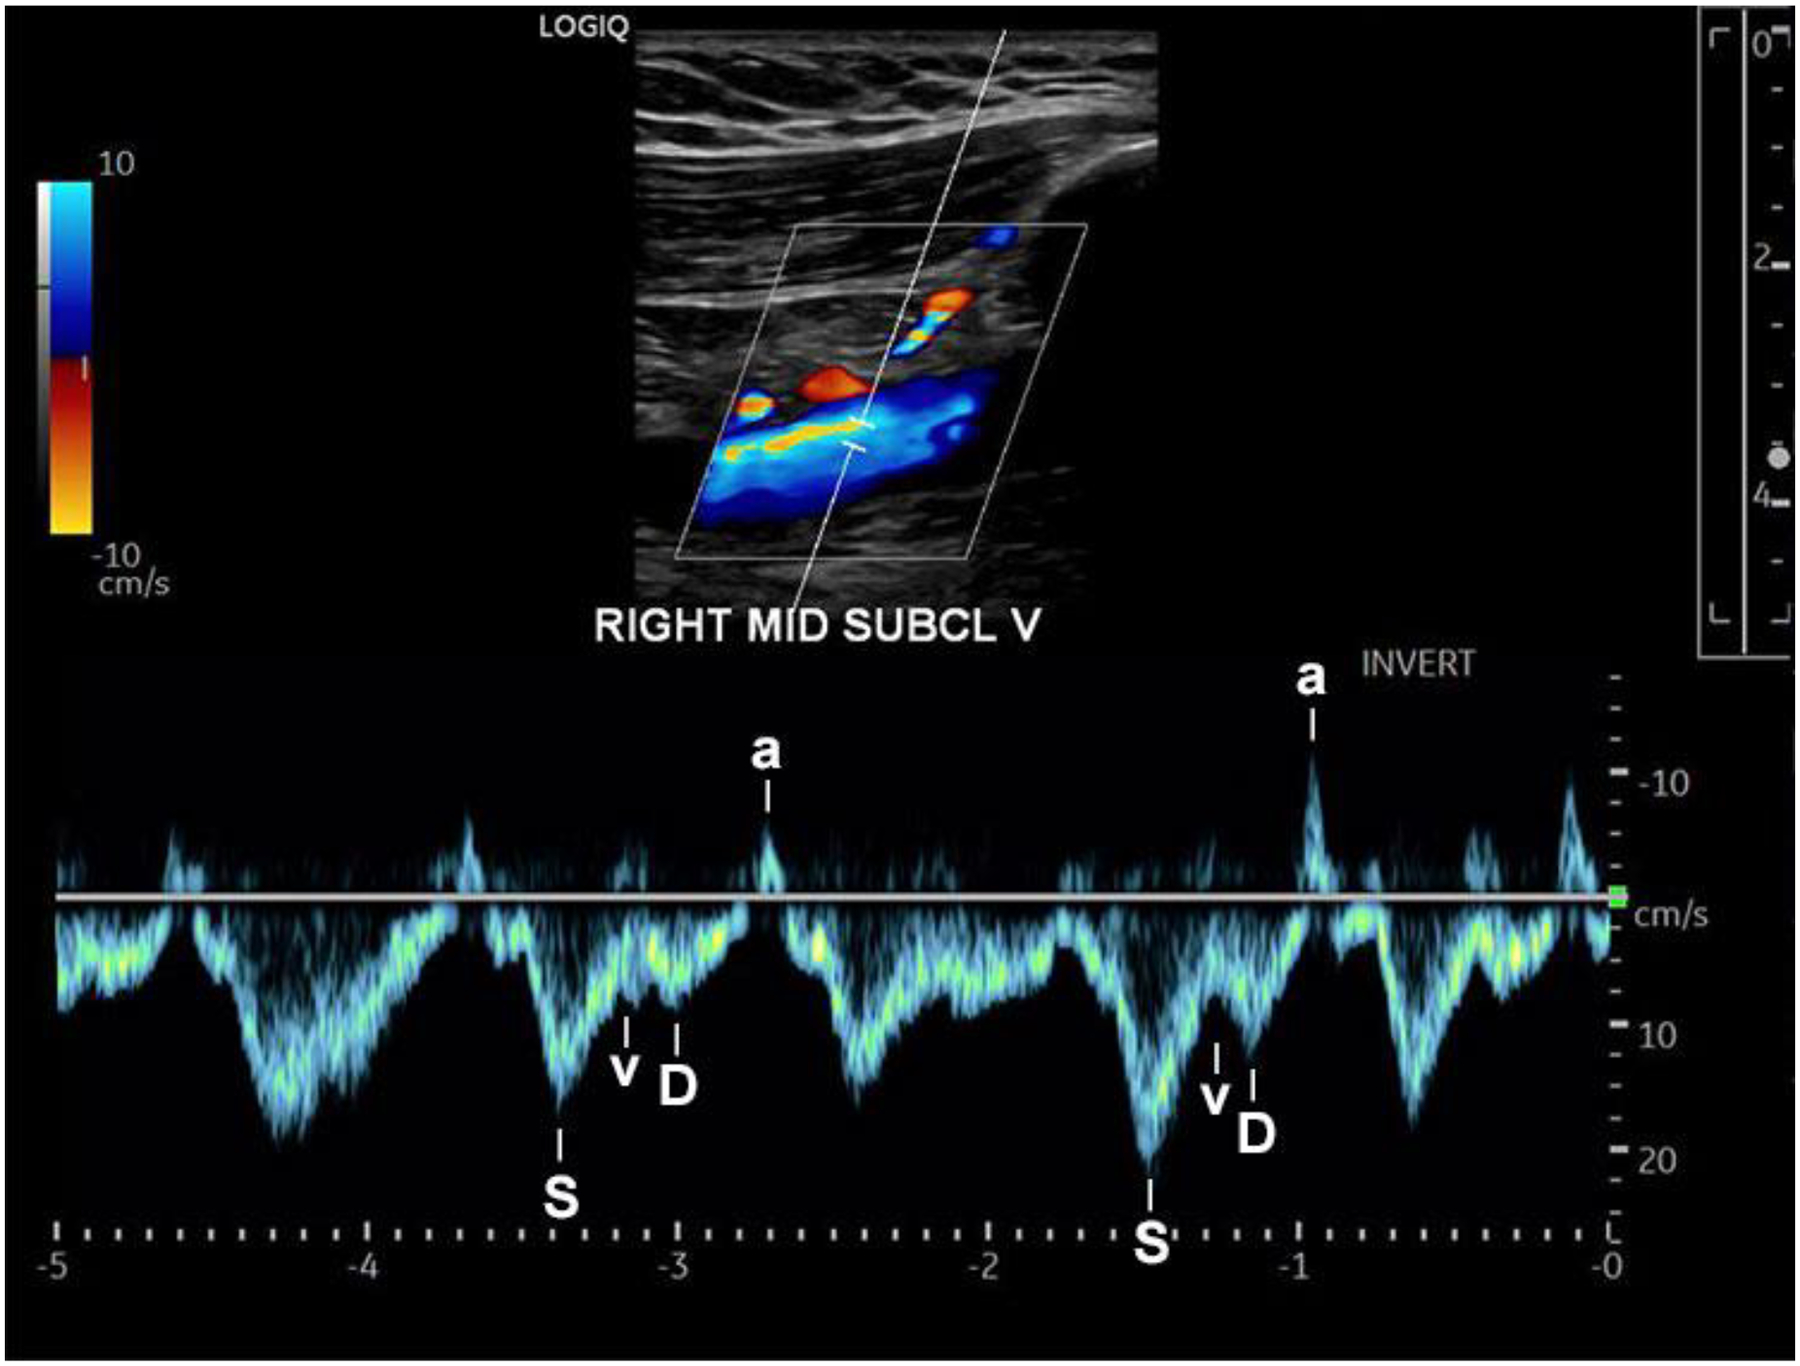
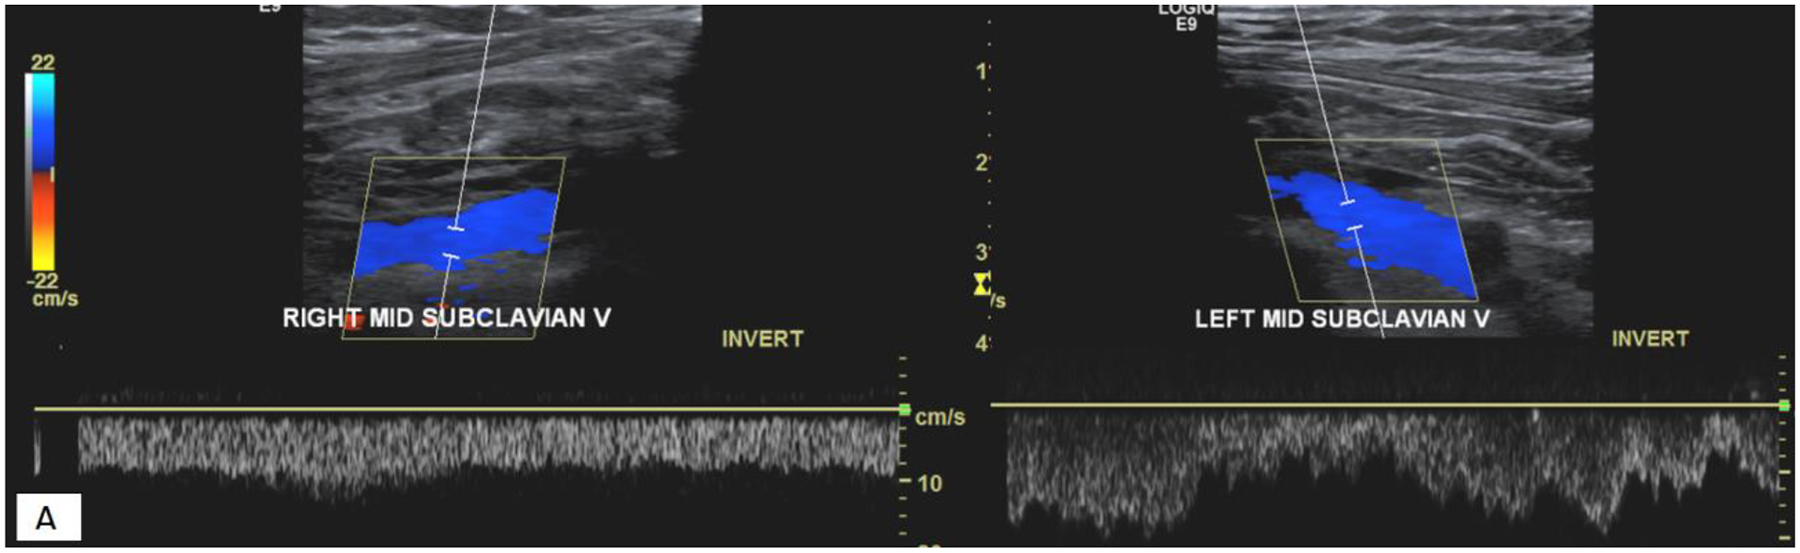
The vascular lab (VL) provides unequalled information regarding venous disease especially in the depiction and characterization of venous waveforms. This article provides the indications, protocol, and diagnostic criteria for peripheral and central venous disease and venous mapping. Venous evaluation is one of the most common studies performed at vascular labs (VL). Patient may present with swelling for evaluation of thrombosis, central obstruction, or venous insufficiency, or may need preoperative planning prior to a bypass or dialysis access creation. It is my hope that the added value a VL brings to the sonographic evaluation of veins, beyond the compressibility of the veins, is the utmost respect and attention to the depiction and characterization of the venous waveform.

Keywords: vascular lab; venous insufficiency; venous mapping; venous waveforms.


Figures

Figure 1.
Figure 1.
Cardiac cycle is reflected in the venous waveform. The S wave (S) results from negative intraatrial pressures due to movement of the atrioventricular septum towards the cardiac apex. The v wave (v) is due to the positive intaatrial pressure due to overfilling of the right atrium. The Diastolic wave (D) happens when there is negative intraatrial pressure caused by the opening of the tricuspid value, and the atrial systole wave (a) is due to positive pressure during atrial systole.
Figure 2.
Figure 2.
Expiration and Inspiration, respiratory variation, is reflected in the venoous waveform. As a person breathes in the chest wall expands and creates a negative pressure in the chest cavity for blood flow to flow towards the heart in a larger volume. With expiration, the chest cavity pressure is positive decreasing volume of blood flow to the heart.
Figure 3.
Figure 3.
A Spectral waveform in the right subclavian vein demonstrates dampening of the typical waveform due to central obstruction from tumor. The contralateral side demonstrates the normal waveform with reflection of the cardiac cycle and respiratory variation. B. Demonstrates a right upper extremity venogram with compression at the right braciocephalic/SVC confluence which is relieved by a stent. C. demonstrates improvement in the abnormal venous waveform pattern after the stent.
Figure 3.
Figure 3.
A Spectral waveform in the right subclavian vein demonstrates dampening of the typical waveform due to central obstruction from tumor. The contralateral side demonstrates the normal waveform with reflection of the cardiac cycle and respiratory variation. B. Demonstrates a right upper extremity venogram with compression at the right braciocephalic/SVC confluence which is relieved by a stent. C. demonstrates improvement in the abnormal venous waveform pattern after the stent.
Figure 4.
Figure 4.
Three different waveforms are depicted representing the spectrum of what is considered a normal waveform in the lower extremities to exclude significant central obstruction.
Figure 5.
Figure 5.
Abnormal spectral waveform with loss of the normal pattern in this patient with central obstruction.
Figure 6.
Figure 6.
A Demonstrates the typical positioning of the probe to visualize the IVC. B demonstrates gray scale imaging of the stented IVC. C demonstrates spectral waveform of the patent stented IVC with an acceptable waveform pattern
Figure 7.
Figure 7.
Spectral waveform of the GSV demonstrates reflux time of 7.85 seconds, Grade 4, with open white arrow denoting start of the reflux while patient performed Valsalva.
Figure 8.
Figure 8.
A. Gray scale image with chronic thrombus in a GSV. B. Color image demonstrating partially patent GSV

References

    1. https://www.cms.gov/medicare-coverage-database/, accessed July 27, 2022
    1. Riherd J (2013). GUNDERSEN/LUTHERAN ULTRASOUND DEPARTMENT POLICY AND PROCEDURE MANUAL
    1. Chin EE, Zimmerman PT, Grant EG. Sonographic evaluation of upper extremity deep venous thrombosis. Journal of ultrasound in medicine : official journal of the American Institute of Ultrasound in Medicine. 2005;24(6):829–838; quiz 839–840. - PubMed
    1. Czihal M, Hoffmann U. Upper extremity deep venous thrombosis. Vasc Med. 2011;16(3):191–202. - PubMed
    1. Selis JE, Kadakia S. Venous Doppler Sonography of the Extremities: A Window to Pathology of the Thorax, Abdomen, and Pelvis. American Journal of Roentgenology. 2009;193(5):1446–1451. - PubMed