

Quantitative proteomics identified circulating biomarkers in lung adenocarcinoma diagnosis
- PMID: 36404333
- PMCID: PMC9677906
- DOI: 10.1186/s12014-022-09381-x
Quantitative proteomics identified circulating biomarkers in lung adenocarcinoma diagnosis
Abstract
Background: Lung cancer (LC) is a common malignant tumor with a high incidence and poor prognosis. Early LC could be cured, but the 5-year-survival rate for patients advanced is extremely low. Early screening of tumor biomarkers through plasma could allow more LC to be detected at an early stage, leading to a earlier treatment and a better prognosis.
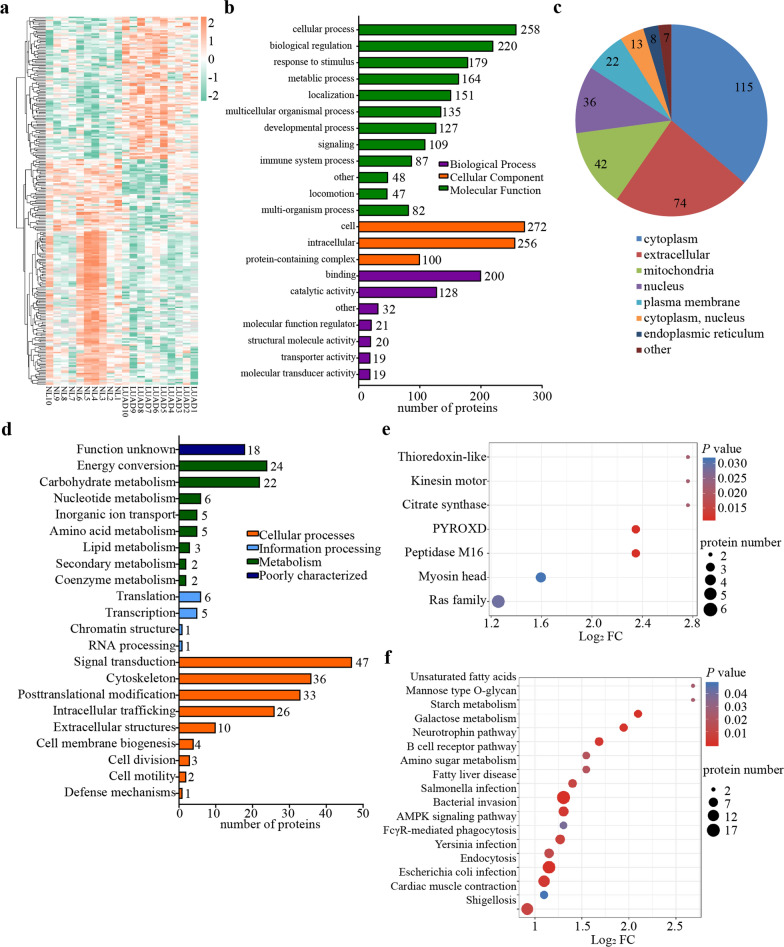
Methods: This study was based on total proteomic analysis and parallel reaction monitoring validation of peripheral blood from 20 lung adenocarcinoma patients and 20 healthy individuals. Furthermore, differentially expressed proteins closely related to prognosis were analysed using Kaplan-Meier Plotter and receiver operating characteristic curve (ROC) curve analysis.
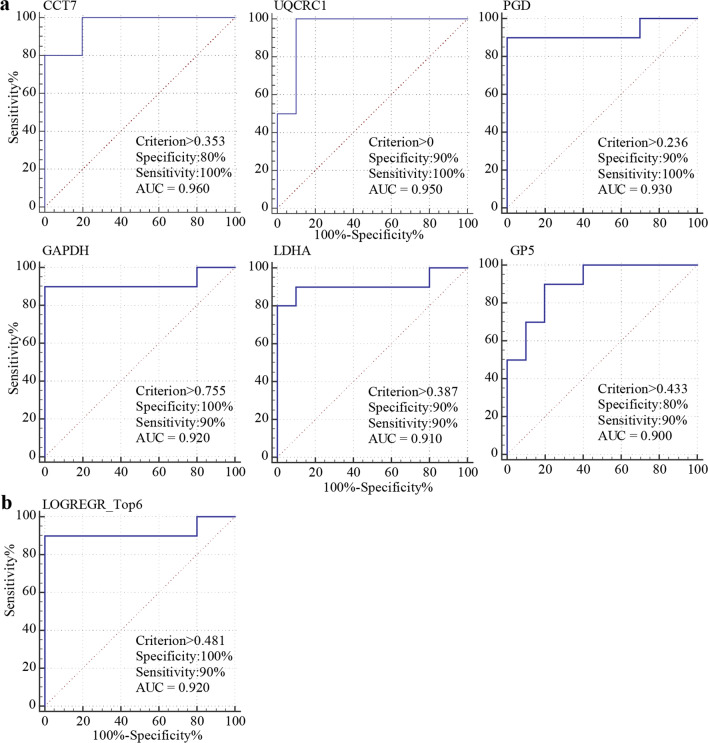
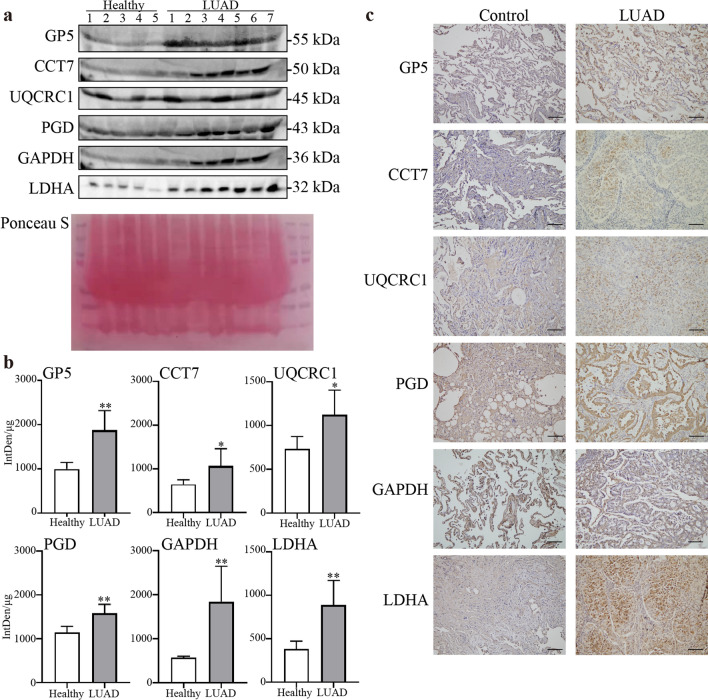
Results: The candidate proteins GAPDH and RAC1 showed the highest connectivity with other differentially expressed proteins between the lung adenocarcinoma group and the healthy group using STRING. Kaplan-Meier Plotter analysis showed that lung adenocarcinoma patients with positive ATCR2, FHL1, RAB27B, and RAP1B expression had observably longer overall survival than patients with negative expression (P < 0.05). The high expression of ARPC2, PFKP, PNP, RAC1 was observably negatively correlated with prognosis (P < 0.05). 17 out of 27 proteins showed a high area under the curve (> 0.80) between the lung adenocarcinoma and healthy plasma groups. Among those proteins, UQCRC1 had an area under the curve of 0.960, and 5 proteins had an area under the curve from 0.90 to 0.95, suggesting that these hub proteins might have discriminatory potential in lung adenocarcinoma, P < 0.05.
Conclusions: These findings provide UQCRC1, GAPDH, RAC1, PFKP have potential as novel biomarkers for the early screening of lung adenocarcinoma.
Keywords: Biomarkers; Early diagnosis; Lung adenocarcinoma; Proteomics; RAC1; UQCRC1.
© 2022. The Author(s).
Conflict of interest statement
The authors declare no competing interests.
Figures


Similar articles
-
IL-11 and CCL-1: Novel Protein Diagnostic Biomarkers of Lung Adenocarcinoma in Bronchoalveolar Lavage Fluid (BALF).J Thorac Oncol. 2016 Dec;11(12):2183-2192. doi: 10.1016/j.jtho.2016.07.026. Epub 2016 Aug 12. J Thorac Oncol. 2016. PMID: 27524264
-
Cancer-testis antigen KK-LC-1 is a potential biomarker associated with immune cell infiltration in lung adenocarcinoma.BMC Cancer. 2022 Jul 30;22(1):834. doi: 10.1186/s12885-022-09930-5. BMC Cancer. 2022. PMID: 35907786 Free PMC article.
-
Quantitative proteomic analysis of human plasma using tandem mass tags to identify novel biomarkers for herpes zoster.J Proteomics. 2020 Aug 15;225:103879. doi: 10.1016/j.jprot.2020.103879. Epub 2020 Jun 30. J Proteomics. 2020. PMID: 32585426
-
Exhaled breath condensate biomarkers for the early diagnosis of lung cancer using proteomics.Am J Physiol Lung Cell Mol Physiol. 2017 Oct 1;313(4):L664-L676. doi: 10.1152/ajplung.00119.2017. Epub 2017 Jun 15. Am J Physiol Lung Cell Mol Physiol. 2017. PMID: 28619761
-
Analysis of the Expression of Cell Division Cycle-Associated Genes and Its Prognostic Significance in Human Lung Carcinoma: A Review of the Literature Databases.Biomed Res Int. 2020 Feb 12;2020:6412593. doi: 10.1155/2020/6412593. eCollection 2020. Biomed Res Int. 2020. PMID: 32104702 Free PMC article. Review.
Cited by
-
Advances in the Clinical Application of High-throughput Proteomics.Explor Res Hypothesis Med. 2024 Jul-Sep;9(3):209-220. doi: 10.14218/erhm.2024.00006. Epub 2024 Jul 3. Explor Res Hypothesis Med. 2024. PMID: 39148720 Free PMC article.
-
Role of four and a half LIM domain protein 1 in tumors (Review).Oncol Lett. 2024 Oct 29;29(1):37. doi: 10.3892/ol.2024.14783. eCollection 2025 Jan. Oncol Lett. 2024. PMID: 39512507 Free PMC article. Review.
-
Phosphofructokinase-1 redefined: a metabolic hub orchestrating cancer hallmarks through multi-dimensional control networks.J Transl Med. 2025 Aug 6;23(1):873. doi: 10.1186/s12967-025-06897-2. J Transl Med. 2025. PMID: 40770805 Free PMC article. Review.
References
-
- Cancer today. http://gco.iarc.fr/today/home. Accessed 13 Feb 2022.
Grants and funding
LinkOut - more resources
Full Text Sources
Research Materials
Miscellaneous