

Identification of molecular subtypes based on chromatin regulator and tumor microenvironment infiltration characterization in papillary renal cell carcinoma
- PMID: 36404389
- PMCID: PMC11796837
- DOI: 10.1007/s00432-022-04482-4
Identification of molecular subtypes based on chromatin regulator and tumor microenvironment infiltration characterization in papillary renal cell carcinoma
Abstract
Background: Papillary renal cell carcinoma (pRCC) is the second most common histological type of renal cell carcinoma. The prognosis of local pRCC is better than that of ccRCC, but the situation has changed greatly after pRCC metastasis. Chromatin regulators (CRs) are indispensable in epigenetic regulation, and their abnormal expression in tumors leads to the occurrence and development of tumor. However, the role of CRs in pRCC has not been studied yet.
Materials and methods: 291 samples were obtained from TCGA-KIPR cohort. Unsupervised clustering analysis was utilized to divide the patients of pRCC into two subtypes. Lasso Cox regression analysis was performed to construct a CRs_score model for predicting OS. The unique characteristics of different molecular subtypes were determined by TME cell infiltration analysis, GO and KEGG analysis and drug sensitivity analysis. We also carried out drug sensitivity experiments in vitro to verify the effect of signature genes on drug sensitivity to sunitinib.
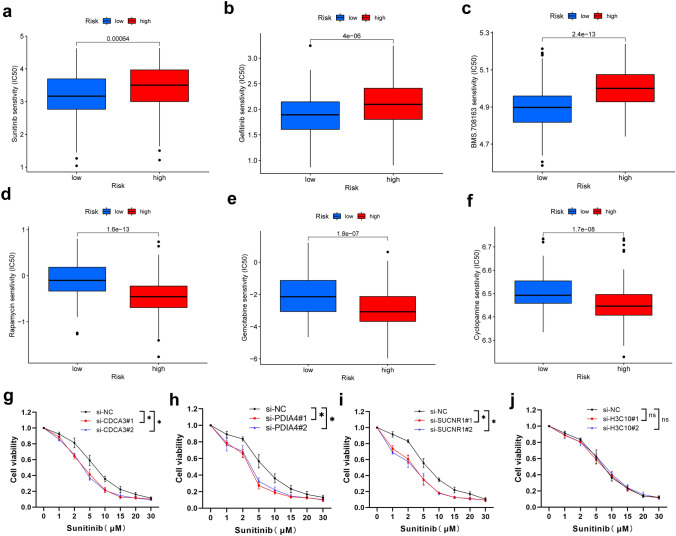
Results: We described the transcriptional and genetic alteration of 19 prognosis-related CRs genes in 291 cases of TCGA-KIRP cohort. We identified two distinct molecular subtypes, which have significant differences in prognosis, clinicopathological features and tumor immune microenvironment (TME). Then, four signature genes were selected by lasso regression analysis to construct a CRs_score for predicting OS, and its predictive ability for patients with pRCC was verified. A nomogram was established to improve the clinical applicability of CRs_score. We found that there was a significant difference in the proportion of immune cell infiltration between high- and low-CRs_score. In addition, CRs_score was significantly correlated with chemosensitivity. Finally, we found that SK-RC-39 cell lines were more sensitive to sunitinib after knocking down the signature gene CDCA3, PDIA4, or SUCNR1.
Conclusions: Our comprehensive analysis of CRs gene in pRCC showed that CRs gene plays a potential role in TME, prognosis and drug resistance in pRCC. These findings may lay a foundation for further study of the regulatory role of CRs gene in pRCC, and provide a new method for evaluating prognosis and developing more effective targeted therapy.
Keywords: Chromatin regulators; Lasso; Molecular subtypes; Papillary renal cell carcinoma; Tumor microenvironment.
© 2022. The Author(s), under exclusive licence to Springer-Verlag GmbH Germany, part of Springer Nature.
Conflict of interest statement
The authors declare no potential conflicts of interesting.
Figures


Similar articles
-
Identification and verification of a novel anoikis-related gene signature with prognostic significance in clear cell renal cell carcinoma.J Cancer Res Clin Oncol. 2023 Oct;149(13):11661-11678. doi: 10.1007/s00432-023-05012-6. Epub 2023 Jul 5. J Cancer Res Clin Oncol. 2023. PMID: 37402968 Free PMC article.
-
Molecular subtypes of lung adenocarcinoma patients for prognosis and therapeutic response prediction with machine learning on 13 programmed cell death patterns.J Cancer Res Clin Oncol. 2023 Oct;149(13):11351-11368. doi: 10.1007/s00432-023-05000-w. Epub 2023 Jun 28. J Cancer Res Clin Oncol. 2023. PMID: 37378675 Free PMC article.
-
A novel copper-induced cell death-related lncRNA prognostic signature associated with immune infiltration and clinical value in gastric cancer.J Cancer Res Clin Oncol. 2023 Sep;149(12):10543-10559. doi: 10.1007/s00432-023-04916-7. Epub 2023 Jun 8. J Cancer Res Clin Oncol. 2023. PMID: 37291405 Free PMC article.
-
Systemic pharmacological treatments for chronic plaque psoriasis: a network meta-analysis.Cochrane Database Syst Rev. 2021 Apr 19;4(4):CD011535. doi: 10.1002/14651858.CD011535.pub4. Cochrane Database Syst Rev. 2021. Update in: Cochrane Database Syst Rev. 2022 May 23;5:CD011535. doi: 10.1002/14651858.CD011535.pub5. PMID: 33871055 Free PMC article. Updated.
-
Systemic pharmacological treatments for chronic plaque psoriasis: a network meta-analysis.Cochrane Database Syst Rev. 2017 Dec 22;12(12):CD011535. doi: 10.1002/14651858.CD011535.pub2. Cochrane Database Syst Rev. 2017. Update in: Cochrane Database Syst Rev. 2020 Jan 9;1:CD011535. doi: 10.1002/14651858.CD011535.pub3. PMID: 29271481 Free PMC article. Updated.
Cited by
-
PPARG and the PTEN-PI3K/AKT Signaling Axis May Cofunction in Promoting Chemosensitivity in Hypopharyngeal Squamous Cell Carcinoma.PPAR Res. 2024 Mar 11;2024:2271214. doi: 10.1155/2024/2271214. eCollection 2024. PPAR Res. 2024. PMID: 38505269 Free PMC article.
-
Comprehensive molecular analyses and experimental validation of CDCAs with potential implications in kidney renal papillary cell carcinoma prognosis.Heliyon. 2024 Jun 13;10(12):e33045. doi: 10.1016/j.heliyon.2024.e33045. eCollection 2024 Jun 30. Heliyon. 2024. PMID: 38988558 Free PMC article.
References
-
- Chandrasekar T, Klaassen Z, Goldberg H, Kulkarni GS, Hamilton RJ, Fleshner NE (2017) Metastatic renal cell carcinoma: patterns and predictors of metastases-A contemporary population-based series. Urol Oncol 35(11):661.e667-661.e614. 10.1016/j.urolonc.2017.06.060 - PubMed
MeSH terms
Substances
Grants and funding
LinkOut - more resources
Full Text Sources
Medical
Miscellaneous
