

Glioblastoma-derived extracellular vesicle subpopulations following 5-aminolevulinic acid treatment bear diagnostic implications
- PMID: 36404434
- PMCID: PMC9676504
- DOI: 10.1002/jev2.12278
Glioblastoma-derived extracellular vesicle subpopulations following 5-aminolevulinic acid treatment bear diagnostic implications
Erratum in
-
Erratum.J Extracell Vesicles. 2023 Mar;12(3):e12313. doi: 10.1002/jev2.12313. J Extracell Vesicles. 2023. PMID: 36916607 Free PMC article. No abstract available.
Abstract
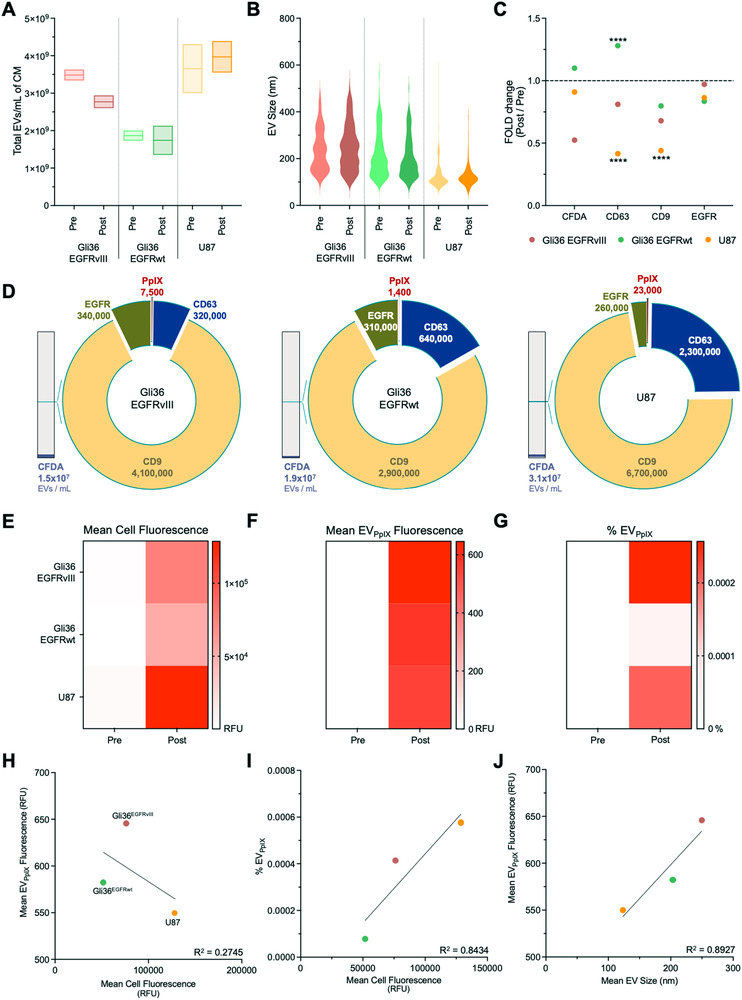
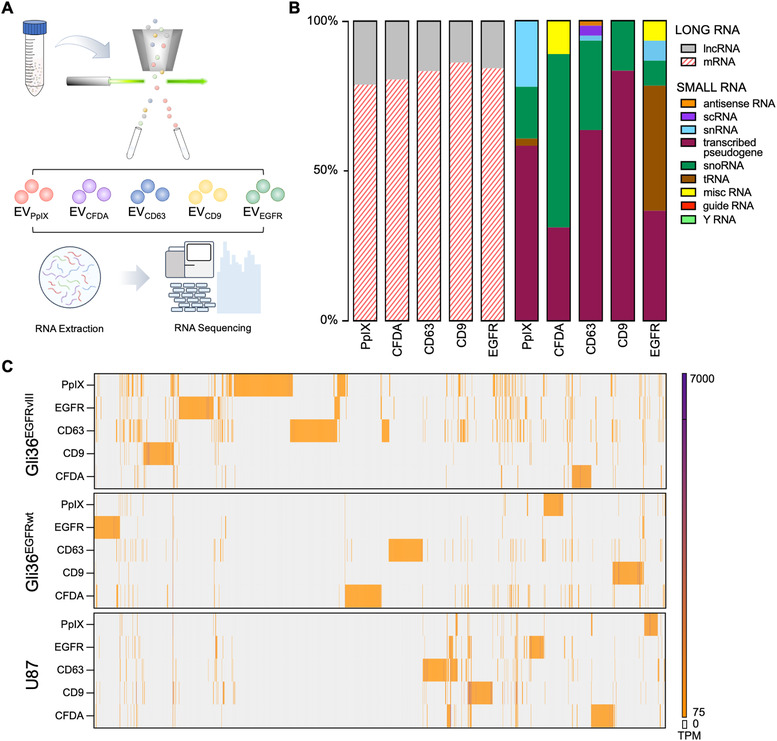
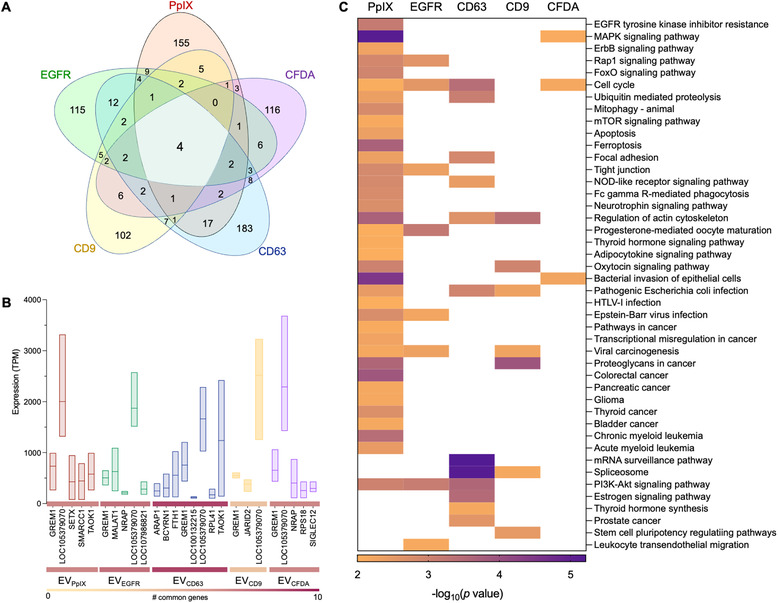
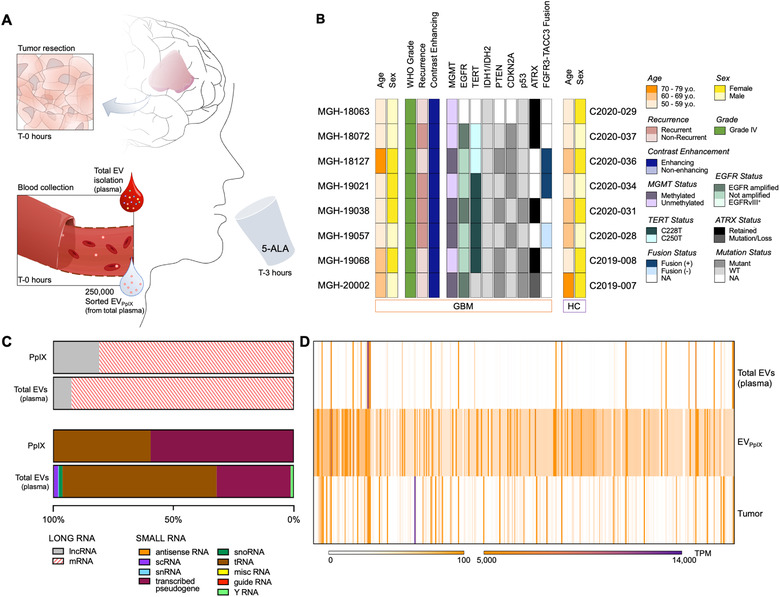
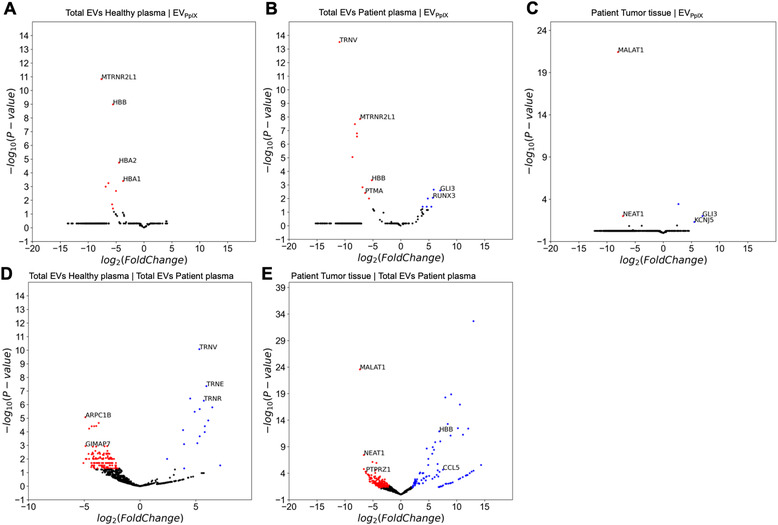
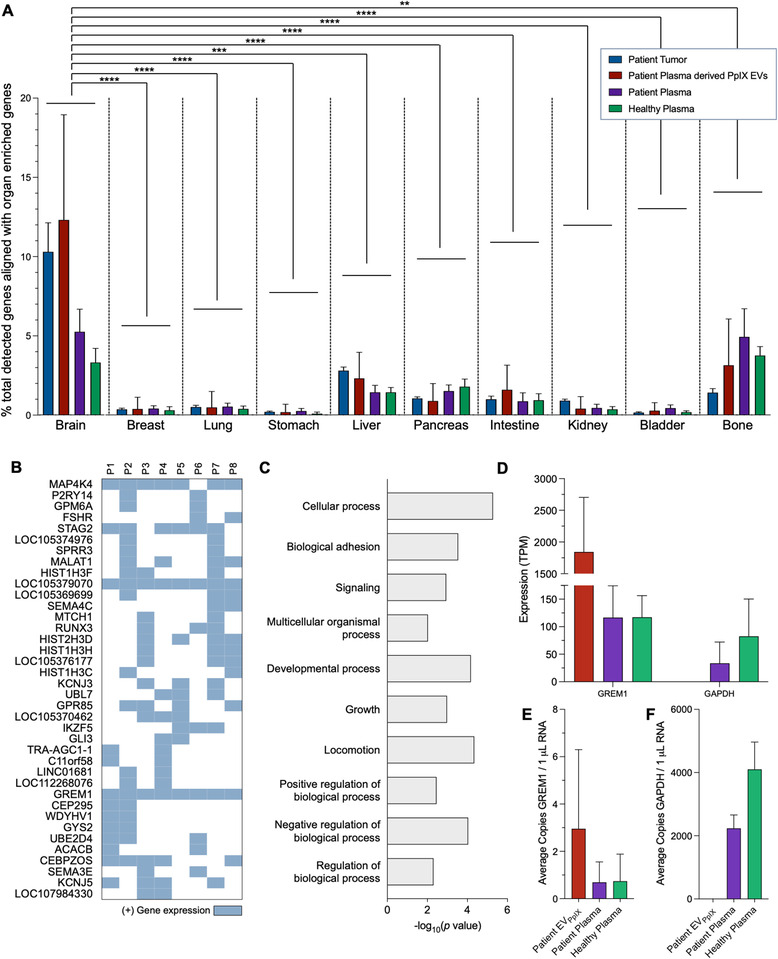
Liquid biopsy is a minimally invasive alternative to surgical biopsy, encompassing different analytes including extracellular vesicles (EVs), circulating tumour cells (CTCs), circulating tumour DNA (ctDNA), proteins, and metabolites. EVs are released by virtually all cells, but at a higher rate by faster cycling, malignant cells. They encapsulate cargo native to the originating cell and can thus provide a window into the tumour landscape. EVs are often analysed in bulk which hinders the analysis of rare, tumour-specific EV subpopulations from the large host EV background. Here, we fractionated EV subpopulations in vitro and in vivo and characterized their phenotype and generic cargo. We used 5-aminolevulinic acid (5-ALA) to induce release of endogenously fluorescent tumour-specific EVs (EVPpIX ). Analysis of five different subpopulations (EVPpIX , EVCD63 , EVCD9 , EVEGFR , EVCFDA ) from glioblastoma (GBM) cell lines revealed unique transcriptome profiles, with the EVPpIX transcriptome demonstrating closer alignment to tumorigenic processes over the other subpopulations. Similarly, isolation of tumour-specific EVs from GBM patient plasma showed enrichment in GBM-associated genes, when compared to bulk EVs from plasma. We propose that fractionation of EV populations facilitates detection and isolation of tumour-specific EVs for disease monitoring.
Keywords: 5-ALA; 5-aminolevulinic acid; EV; IFC; PpIX; extracellular vesicles; glioblastoma; imaging flow cytometry; liquid biopsy; nano-FACS; nanoparticle fluorescence activated sorting; protoporphyrin IX.
© 2022 The Authors. Journal of Extracellular Vesicles published by Wiley Periodicals, LLC on behalf of the International Society for Extracellular Vesicles.
Figures
Similar articles
-
Characterization of plasma-derived protoporphyrin-IX-positive extracellular vesicles following 5-ALA use in patients with malignant glioma.EBioMedicine. 2019 Oct;48:23-35. doi: 10.1016/j.ebiom.2019.09.025. Epub 2019 Oct 15. EBioMedicine. 2019. PMID: 31628025 Free PMC article.
-
Assessment of technical and clinical utility of a bead-based flow cytometry platform for multiparametric phenotyping of CNS-derived extracellular vesicles.Cell Commun Signal. 2023 Oct 6;21(1):276. doi: 10.1186/s12964-023-01308-9. Cell Commun Signal. 2023. PMID: 37803478 Free PMC article.
-
Advancements and Technical Considerations for Extracellular Vesicle Isolation and Biomarker Identification in Glioblastoma.Neurosurgery. 2023 Jul 1;93(1):33-42. doi: 10.1227/neu.0000000000002393. Epub 2023 Feb 7. Neurosurgery. 2023. PMID: 36749103
-
Extracellular vesicles as source for the identification of minimally invasive molecular signatures in glioblastoma.Semin Cancer Biol. 2022 Dec;87:148-159. doi: 10.1016/j.semcancer.2022.11.004. Epub 2022 Nov 11. Semin Cancer Biol. 2022. PMID: 36375777 Review.
-
The emerging clinical potential of circulating extracellular vesicles for non-invasive glioma diagnosis and disease monitoring.Brain Tumor Pathol. 2019 Apr;36(2):29-39. doi: 10.1007/s10014-019-00335-0. Epub 2019 Mar 11. Brain Tumor Pathol. 2019. PMID: 30859343 Review.
Cited by
-
A tumor microenvironment model for glioma diagnosis and therapeutic evaluation based on the analysis of tissues and biological fluids.iScience. 2025 Jun 13;28(7):112881. doi: 10.1016/j.isci.2025.112881. eCollection 2025 Jul 18. iScience. 2025. PMID: 40655095 Free PMC article.
-
Rigorous Comparison of Extracellular Vesicle Processing to Enhance Downstream Analysis for Glioblastoma Characterization.Adv Biol (Weinh). 2024 Jan;8(1):e2300233. doi: 10.1002/adbi.202300233. Epub 2023 Sep 5. Adv Biol (Weinh). 2024. PMID: 37670402 Free PMC article.
-
Shared and distinct changes in the molecular cargo of extracellular vesicles in different neurodegenerative diseases.Cell Mol Life Sci. 2024 Dec 3;81(1):479. doi: 10.1007/s00018-024-05522-7. Cell Mol Life Sci. 2024. PMID: 39627617 Free PMC article. Review.
-
Identification of 7-HOCA as a Potential Biomarker in Glioblastoma: Evidence from Genome-Wide Association Study and Clinical Validation.Int J Gen Med. 2024 Dec 13;17:6185-6197. doi: 10.2147/IJGM.S493488. eCollection 2024. Int J Gen Med. 2024. PMID: 39691836 Free PMC article.
-
Deciphering the causal relationship between plasma and cerebrospinal fluid metabolites and glioblastoma multiforme: a Mendelian Randomization study.Aging (Albany NY). 2024 May 10;16(9):8306-8319. doi: 10.18632/aging.205818. Epub 2024 May 10. Aging (Albany NY). 2024. PMID: 38742944 Free PMC article.
References
Publication types
MeSH terms
Substances
Grants and funding
LinkOut - more resources
Full Text Sources
Research Materials
Miscellaneous
