

Cancer associated fibroblast derived gene signature determines cancer subtypes and prognostic model construction in head and neck squamous cell carcinomas
- PMID: 36404634
- PMCID: PMC10028128
- DOI: 10.1002/cam4.5383
Cancer associated fibroblast derived gene signature determines cancer subtypes and prognostic model construction in head and neck squamous cell carcinomas
Abstract
Background: Head and neck squamous cell carcinomas (HNSCC) are the most common type of head and neck cancer with an unimproved prognosis over the past decades. Although the role of cancer-associated-fibroblast (CAF) has been demonstrated in HNSCC, the correlation between CAF-derived gene expression and patient prognosis remains unknown.
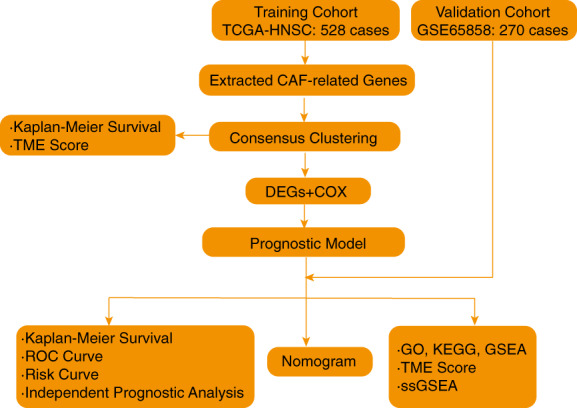
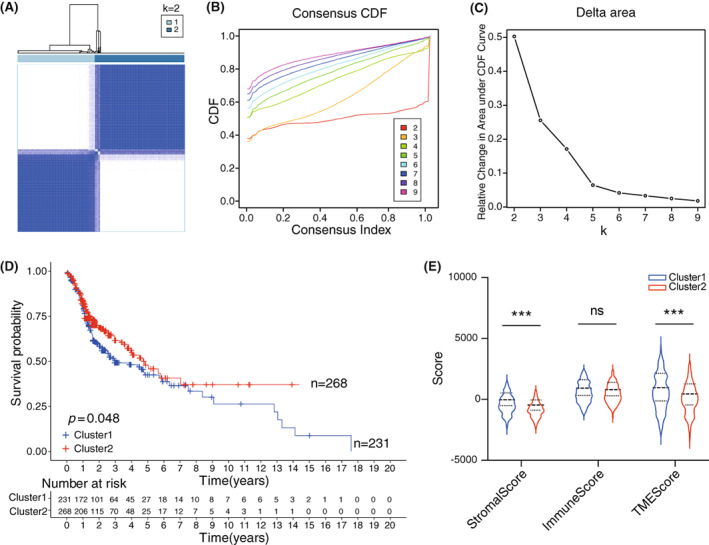
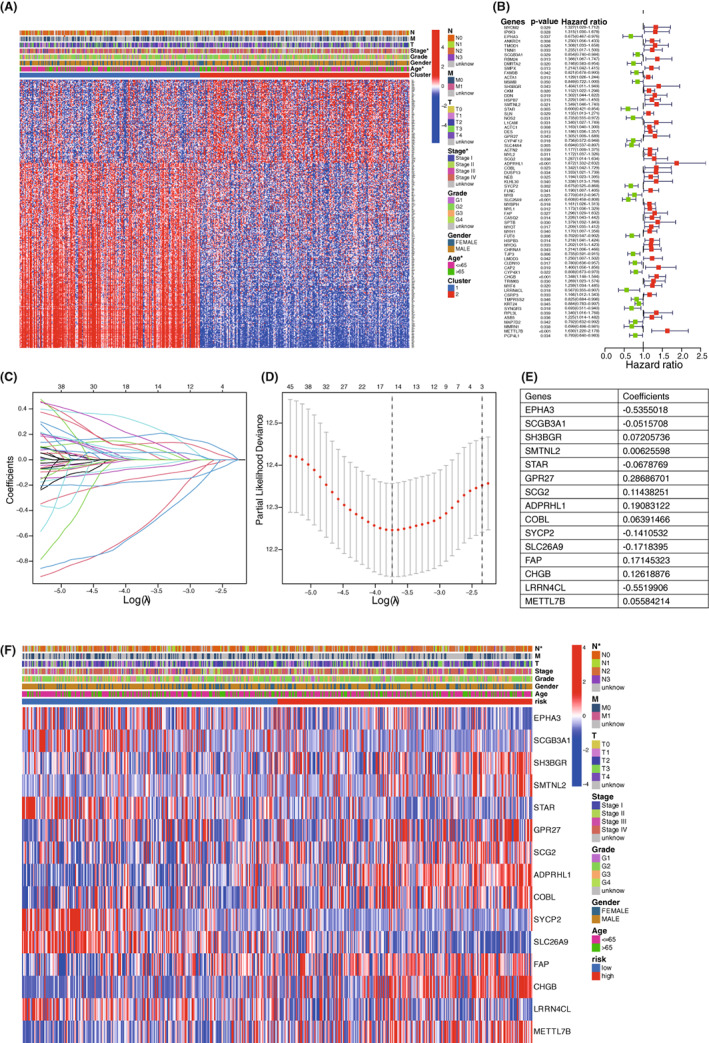
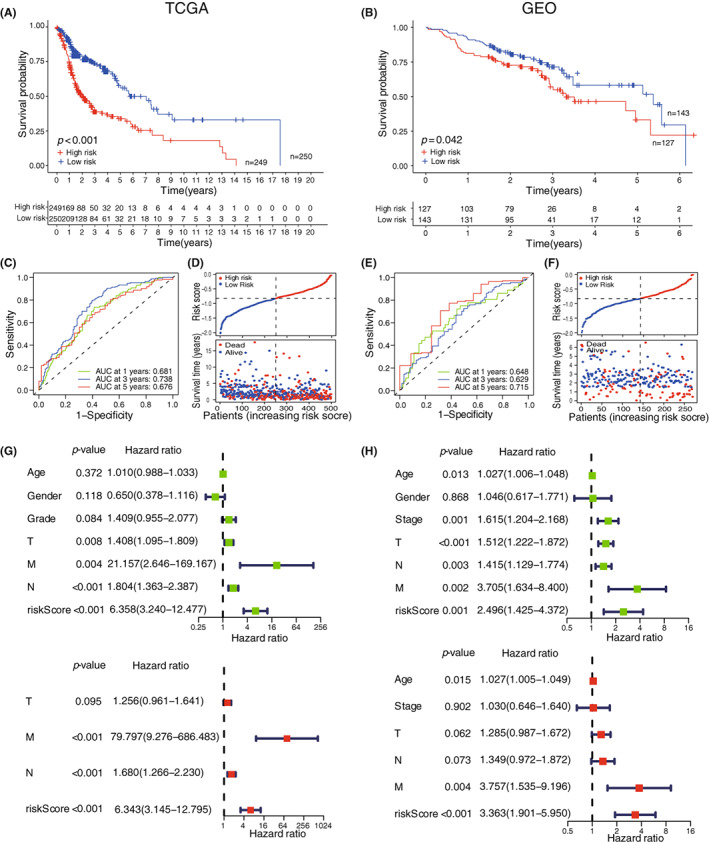
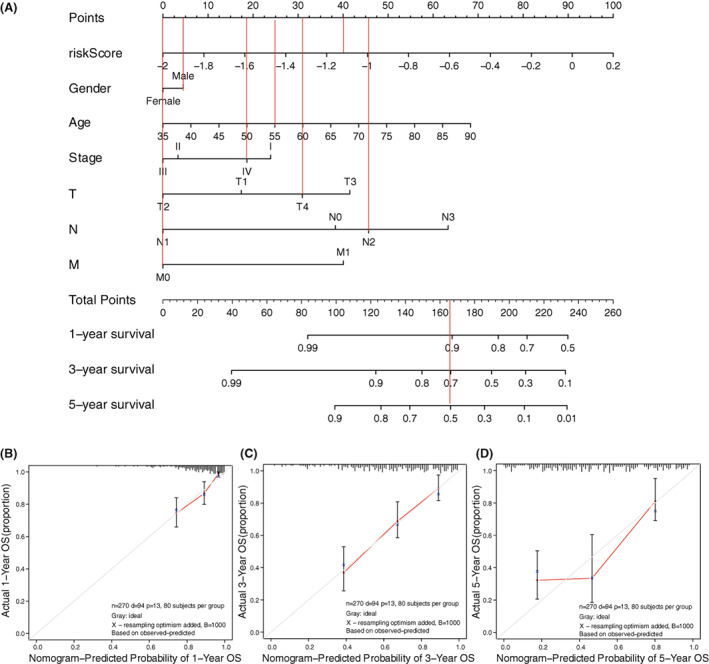
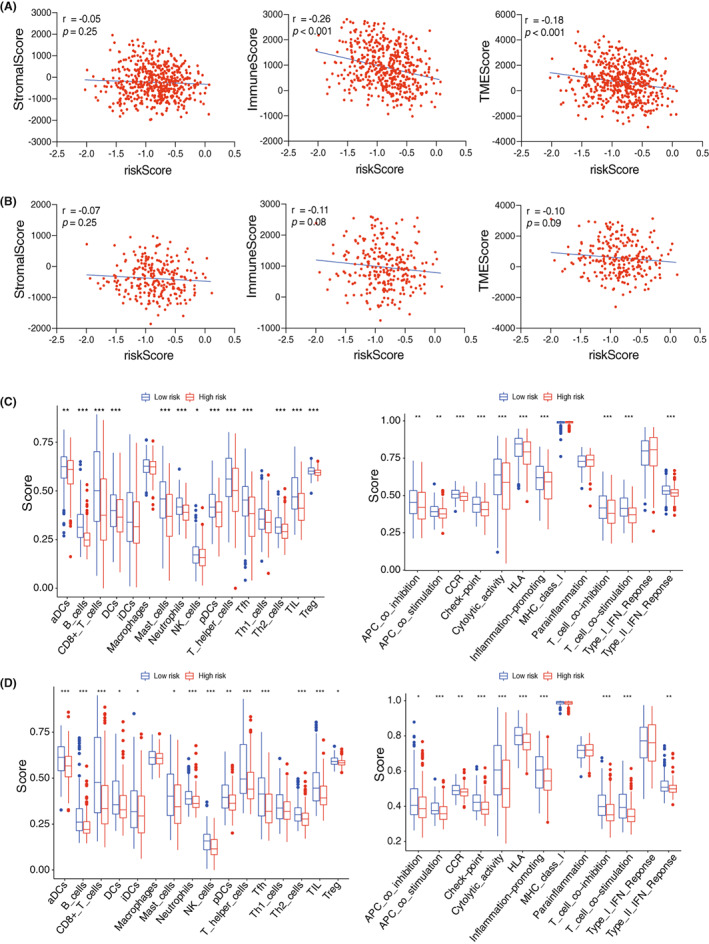
Methods: A total of 528 patients from TCGA database and 270 patients from GSE65858 database were contained in this study. After extracting 66 CAF-related gene expression data from TCGA database, consensus clustering was performed to identify different HNSCC subtypes. Limma package was used to distinguish the differentially expression genes (DEGs) between these subtypes, followed by Lasso regression analysis to construct a prognostic model. The model was validated by performing Kaplan-Meier survival, ROC and risk curve, univariate and multivariate COX regression analysis. GO, KEGG, GSEA, ESTIMATE and ssGSEA analyses was performed to explort the potential mechanism leading to different prognosis.
Results: Based on the 66 CAF-related gene expression pattern we stratitied HNSCC patients into two previously unreported subtypes with different clinical outcomes. A prognostic model composed of 15 DEGs was constructed and validated. In addition, bioinformatics analysis showed that the prognostic risk of HNSCC patients was also negatively correlated to immune infiltration, implying the role of tumor immune escape in HNSCC prognosis and treatment option.
Conclusions: The study develops a reliable prognostic prediction tool and provides a theoretical treatment guidance for HNSCC patients.
Keywords: Cancer subtypes; Cancer-Associated-Fibroblast; Gene signature; Head and Neck Squamous Cell Carcinoma; Prognostic Model.
© 2022 The Authors. Cancer Medicine published by John Wiley & Sons Ltd.
Conflict of interest statement
The authors declare that they have no competing interests.
Figures
Similar articles
-
Tumor Mutation Burden, Immune Cell Infiltration, and Construction of Immune-Related Genes Prognostic Model in Head and Neck Cancer.Int J Med Sci. 2021 Jan 1;18(1):226-238. doi: 10.7150/ijms.51064. eCollection 2021. Int J Med Sci. 2021. PMID: 33390791 Free PMC article.
-
Identification and verification of eight cancer-associated fibroblasts related genes as a prognostic signature for head and neck squamous cell carcinoma.Heliyon. 2023 Feb 28;9(3):e14003. doi: 10.1016/j.heliyon.2023.e14003. eCollection 2023 Mar. Heliyon. 2023. PMID: 36938461 Free PMC article.
-
A model of seven immune checkpoint-related genes predicting overall survival for head and neck squamous cell carcinoma.Eur Arch Otorhinolaryngol. 2021 Sep;278(9):3467-3477. doi: 10.1007/s00405-020-06540-4. Epub 2021 Jan 15. Eur Arch Otorhinolaryngol. 2021. PMID: 33449165
-
Development and experimental verification of a prognosis model for disulfidptosis-associated genes in HNSCC.Medicine (Baltimore). 2024 Mar 22;103(12):e37308. doi: 10.1097/MD.0000000000037308. Medicine (Baltimore). 2024. PMID: 38518012 Free PMC article. Review.
-
Heterogeneity of cancer-associated fibroblasts and tumor-promoting roles in head and neck squamous cell carcinoma.Front Mol Biosci. 2024 Jun 20;11:1340024. doi: 10.3389/fmolb.2024.1340024. eCollection 2024. Front Mol Biosci. 2024. PMID: 38966131 Free PMC article. Review.
Cited by
-
High-Resolution Profiling of Head and Neck Squamous Cells Carcinoma Identifies Specific Biomarkers and Expression Subtypes of Clinically Relevant Vulnerabilities.Curr Med Chem. 2024;31(17):2431-2448. doi: 10.2174/0109298673276128231031112655. Curr Med Chem. 2024. PMID: 37936459
References
-
- Sung H, Ferlay J, Siegel RL, et al. Global Cancer Statistics 2020: GLOBOCAN estimates of incidence and mortality worldwide for 36 cancers in 185 countries. CA Cancer J Clin. 2021;71(3):209‐249. - PubMed
-
- Chow LQM. Head and neck cancer. N Engl J Med. 2020;382(1):60‐72. - PubMed
-
- Medicine UNLo . Head and neck squamous cell carcinoma. Genetics Home Reference. 2020.
-
- Head and neck squamous cell carcinoma. Nat Rev Dis Primers. 2020;6(1):93. - PubMed
-
- Weber CE, Kuo PC. The tumor microenvironment. Surg Oncol. 2012;21(3):172‐177. - PubMed
Publication types
MeSH terms
LinkOut - more resources
Full Text Sources
Medical
Miscellaneous
