. 2023 Mar;89(3):908-921.
doi: 10.1002/mrm.29531. Epub 2022 Nov 20.

Motion-robust, blood-suppressed, reduced-distortion diffusion MRI of the liver

Affiliations

Motion-robust, blood-suppressed, reduced-distortion diffusion MRI of the liver

Ruiqi Geng et al. Magn Reson Med. 2023 Mar.

Abstract

Purpose: To evaluate feasibility and reproducibility of liver diffusion-weighted (DW) MRI using cardiac-motion-robust, blood-suppressed, reduced-distortion techniques.

Methods: DW-MRI data were acquired at 3T in an anatomically accurate liver phantom including controlled pulsatile motion, in eight healthy volunteers and four patients with known or suspected liver metastases. Standard monopolar and motion-robust (M1-nulled, and M1-optimized) DW gradient waveforms were each acquired with single-shot echo-planar imaging (ssEPI) and multishot EPI (msEPI). In the motion phantom, apparent diffusion coefficient (ADC) was measured in the motion-affected volume. In healthy volunteers, ADC was measured in the left and right liver lobes separately to evaluate ADC reproducibility between the two lobes. Image distortions were quantified using the normalized cross-correlation coefficient, with an undistorted T2-weighted reference.

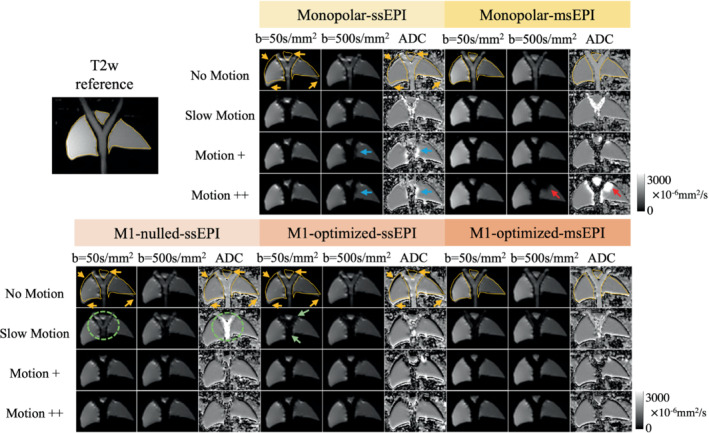
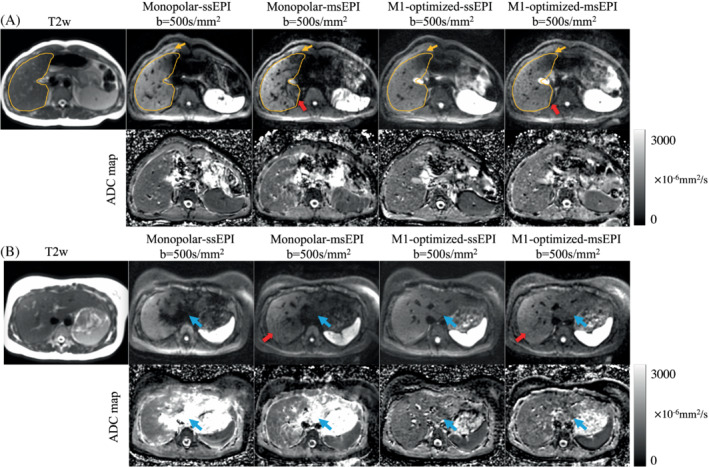
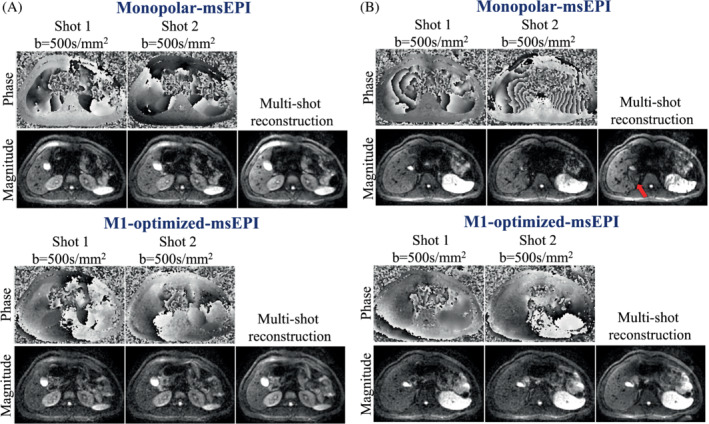
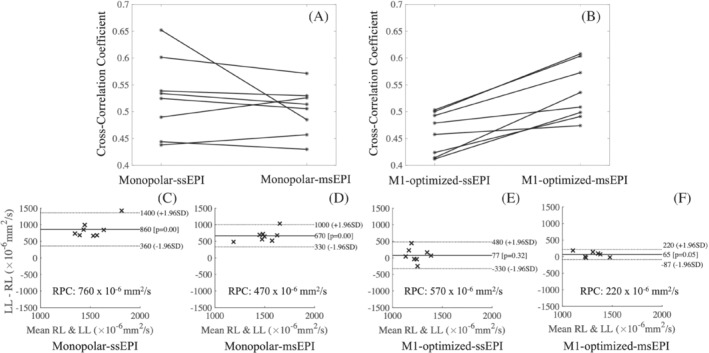
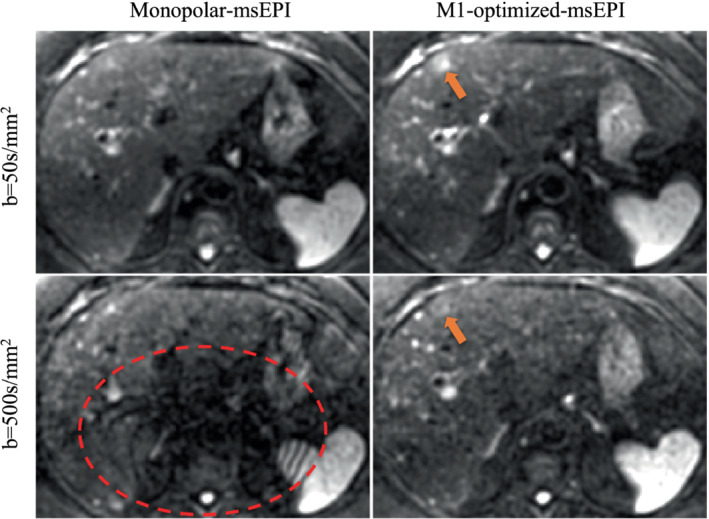
Results: In the motion phantom, ADC mean and SD in motion-affected volumes substantially increased with increasing motion for monopolar waveforms. ADC remained stable in the presence of increasing motion when using motion-robust waveforms. M1-optimized waveforms suppressed slow flow signal present with M1-nulled waveforms. In healthy volunteers, monopolar waveforms generated significantly different ADC measurements between left and right liver lobes ( p = 0 . 0078 $$ p=0.0078 $$ , reproducibility coefficients (RPC) = 470 × 1 0 - 6 $$ 470\times 1{0}^{-6} $$ mm 2 $$ {}^2 $$ /s for monopolar-msEPI), while M1-optimized waveforms showed more reproducible ADC values ( p = 0 . 29 $$ p=0.29 $$ , RPC = 220 × 1 0 - 6 $$ \mathrm{RPC}=220\times 1{0}^{-6} $$ mm 2 $$ {}^2 $$ /s for M1-optimized-msEPI). In phantom and healthy volunteer studies, motion-robust acquisitions with msEPI showed significantly reduced image distortion ( p < 0 . 001 $$ p<0.001 $$ ) compared to ssEPI. Patient scans showed reduction of wormhole artifacts when combining M1-optimized waveforms with msEPI.

Conclusion: Synergistic effects of combined M1-optimized diffusion waveforms and msEPI acquisitions enable reproducible liver DWI with motion robustness, blood signal suppression, and reduced distortion.

Keywords: diffusion; liver; motion-robust; multishot; phantom.


Conflict of interest statement

University of Wisconsin‐Madison receives departmental research support from GE Healthcare. Dr. Nataliya V. Uboha conducts consulting at QED, Taiho Inc., Incyte, AstraZeneca, Pfizer, Boston Gene, Helsinn, and Grail, obtains research funding from Taiho Inc, Ipsen, and EMD Serono, and has long position holdings at Natera and Exact Sciences. Dr. Ali Pirasteh provides consultancy at TheraCea, Sanofi Genzyme, and Otsuka. Dr. Arnaud Guidon is an employee of GE Healthcare. Dr. Diego Hernando is a Founder and part owner of Calimetrix, LLC.

Figures

FIGURE 1
FIGURE 1
Diffusion‐weighted images and apparent diffusion coefficient (ADC) maps in the quantitative motion phantom demonstrate robustness of optimized motion‐robust waveforms to compressive motion, suppression of perfusion (blood‐mimicking) signals by M1‐optimization, and synergy between M1‐optimized gradient waveform designs and multishot echo‐planar imaging (msEPI) with increasing degrees of compressive tissue motion. Severe motion‐induced signal dropouts (blue arrows) and ADC bias appear in monopolar images and ADC maps. Both M1‐nulled and M1‐optimized methods avoid the signal dropouts and produce consistent ADC measurements throughout the liver model. With slow flow motion (roughly mimicking perfusion), residual bright signal from moving fluid remains in low‐b‐value images acquired with M1‐nulled waveforms, resulting in biased ADC values in the tubing area (green circles). The perfusion signal is suppressed in low‐b‐value images acquired with M1‐optimized waveforms (green arrows). ssEPI images suffer from severe image distortions (yellow contours and yellow arrows). msEPI reduces this image distortion. However, msEPI without motion‐robust gradients shows wormhole artifacts in high‐b‐value images and biased ADC values (red arrows). M1‐optimized‐msEPI generates stable ADC measurements while maintaining low image distortion (red contours). “Slow motion” represents a flow rate of 0.15 L/min, or a flow velocity of 3.6 cm/s. “Motion +”: flow rate = 0.9 L/min, flow velocity = 21.6 cm/s. “Motion ++”: flow rate = 1.1 L/min, flow velocity = 26.4 cm/s
FIGURE 2
FIGURE 2
Example diffusion‐weighted (DW) images and apparent diffusion coefficient (ADC) maps from two healthy volunteers. The yellow curve in volunteer (A) depicts the contour of the liver from the T2w reference. The misalignment between the contour and the liver anatomy due to distortion in the DW images is indicated by yellow arrow. Images with multishot echo‐planar imaging (msEPI) acquisition have substantially reduced distortion artifacts. Blue arrows show the motion‐induced signal voids and ADC bias in the left liver lobe, which was reduced by M1‐optimized‐ssEPI/msEPI acquisitions. The worm‐hole artifacts indicated by red arrows in the msEPI reconstruction with monopolar acquisition were likely due to the presence of motion‐induced rapid spatial phase variations, which were mitigated when combining msEPI with M1‐optimized gradient waveforms. Note the bright signals encroaching the right border of the liver are from the gall bladder.
FIGURE 3
FIGURE 3
Phase and amplitude maps of individual shot images acquired with multishot echo‐planar imaging of the first volunteer as in Figure 2A. In an inferior slice where the right liver lobe was unaffected by cardiovascular pulsation (A), the phase maps were smooth across individual shots acquired with either monopolar or motion‐robust waveforms. In a superior slice where the heart periodically compresses the liver (B), the phase maps acquired with monopolar acquisitions showed rapid variation in the liver, resulting in wormhole artifacts in the multishot reconstructed image (red arrow). However, individual shots acquired with motion‐robust waveforms showed smooth phase even in the presence of compressive tissue motion, leading to artifact‐free multishot combination.
FIGURE 4
FIGURE 4
CCC comparison and Bland‐Altman plots of apparent diffusion coefficient (ADC) reproducibility in healthy volunteers. CCC comparison (A, B) and Bland–Altman plots of ADC reproducibility between the left and right liver lobes (C–F) in healthy volunteers illustrate the synergy between motion‐robust diffusions waveform and multishot echo‐planar imaging (msEPI) acquisition. (A) The difference between monopolar‐single‐shot echo‐planar imaging (ssEPI) and monopolar‐msEPI in CCC measurements was not significant (p = 0.26), even though the visually observed distortion artifact is largely reduced in monopolar‐msEPI. With M1‐optimized waveform (B), msEPI has significantly higher CCC measurements (p < 0.001), which indicates significantly reduced distortion compared to ssEPI. Substantial ADC bias of monopolar acquisitions are observed in the left lobe (C, D), whereas both M1‐optimized‐ssEPI/msEPI acquisitions have no significant bias (E, F). Multishot acquisitions also demonstrate lower ADC variation between both liver lobes than single‐shot EPI acquisitions (D, F). CCC, intensity‐based normalized cross‐correlation coefficient; LL, left lobe; RL: right lobe; RPC, reproducibility coefficient
FIGURE 5
FIGURE 5
A 66‐year‐old female patient with small bowel neuroendocrine tumor (NET) metastatic to the liver, BMI = 35.72 kg/m2. This example demonstrates the synergy between M1‐optimized motion‐robust waveforms and multishot echo‐planar imaging (msEPI). Worm‐hole artifacts appear in msEPI acquired with monopolar waveforms (red circle), while msEPI acquired with M1‐optimized waveforms remain free of such artifacts. Orange arrows point to a metastasis in the liver.

Similar articles

Cited by

References

    1. Chan JHM, Tsui EYK, Luk SH, et al. Diffusion‐weighted MR imaging of the liver: distinguishing hepatic abscess from cystic or necrotic tumor. Abdom Imag. 2001;26:161‐165. - PubMed
    1. Taouli B, Chouli M, Martin AJ, Qayyum A, Coakley FV, Vilgrain V. Chronic hepatitis: role of diffusion‐weighted imaging and diffusion tensor imaging for the diagnosis of liver fibrosis and inflammation. J Magnet Reson Imaging Offic J Int Soc Magn Reson Med. 2008;28:89‐95. - PubMed
    1. Taouli B, Koh DM. Diffusion‐weighted MR imaging of the liver. Radiology. 2010;254:47‐66. - PubMed
    1. Malayeri AA, El Khouli RH, Zaheer A, et al. Principles and applications of diffusion‐weighted imaging in cancer detection, staging, and treatment follow‐up. Radiographics. 2011;31:1773‐1791. - PMC - PubMed
    1. Koh DM, Collins DJ. Diffusion‐weighted MRI in the body: applications and challenges in oncology. Am J Roentgenol. 2007;188:1622‐1635. - PubMed

Publication types

MeSH terms