

Lung parenchyma transverse relaxation rates at 0.55 T
- PMID: 36404674
- PMCID: PMC10100111
- DOI: 10.1002/mrm.29541
Lung parenchyma transverse relaxation rates at 0.55 T
Abstract
Purpose: To determine R2 and transverse relaxation rates in healthy lung parenchyma at 0.55 T. This is important in that it informs the design and optimization of new imaging methods for 0.55T lung MRI.
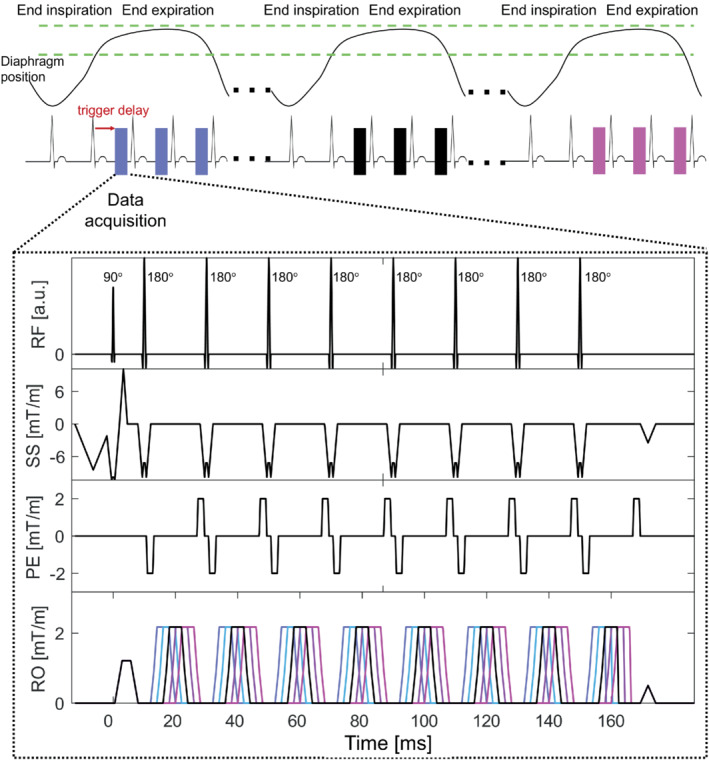
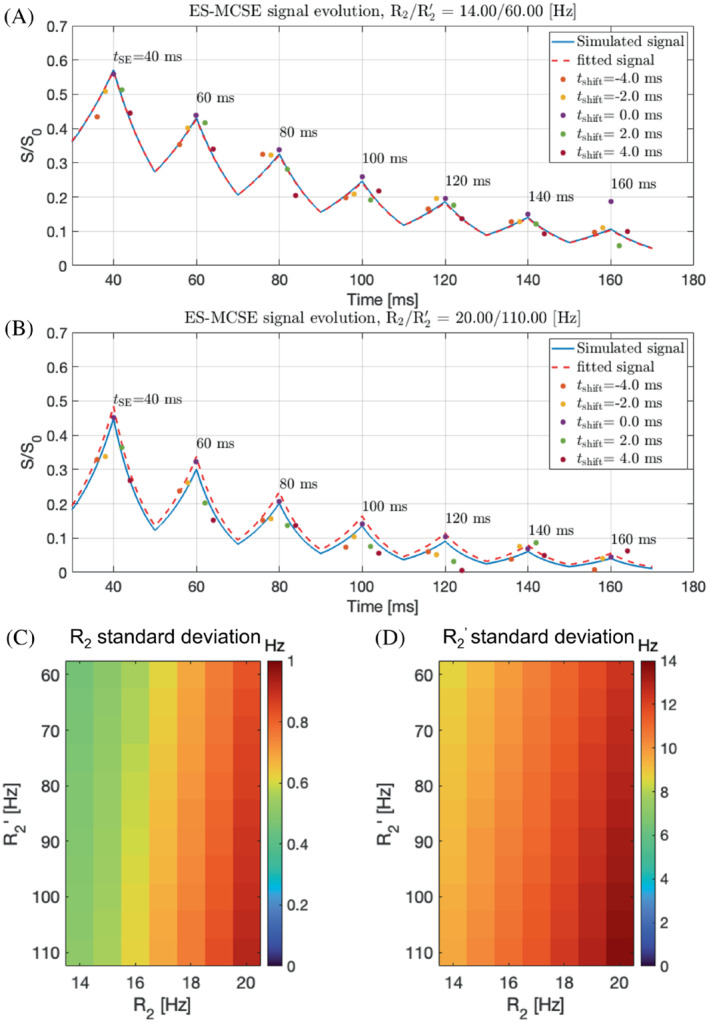
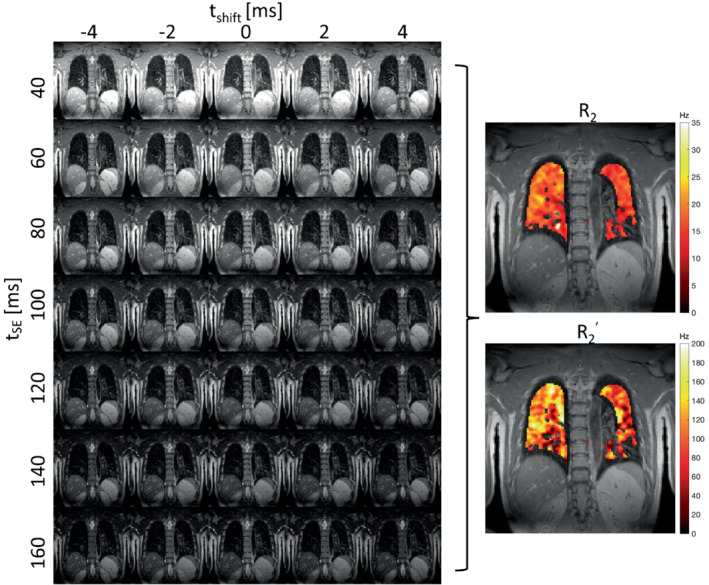
Methods: Experiments were performed in 3 healthy adult volunteers on a prototype whole-body 0.55T MRI, using a custom free-breathing electrocardiogram-triggered, single-slice echo-shifted multi-echo spin echo (ES-MCSE) pulse sequence with respiratory navigation. Transverse relaxation rates R2 and and off-resonance ∆f were jointly estimated using nonlinear least-squares estimation. These measurements were compared against R2 estimates from T2 -prepared balanced SSFP (T2 -Prep bSSFP) and estimates from multi-echo gradient echo, which are used widely but prone to error due to different subvoxel weighting.
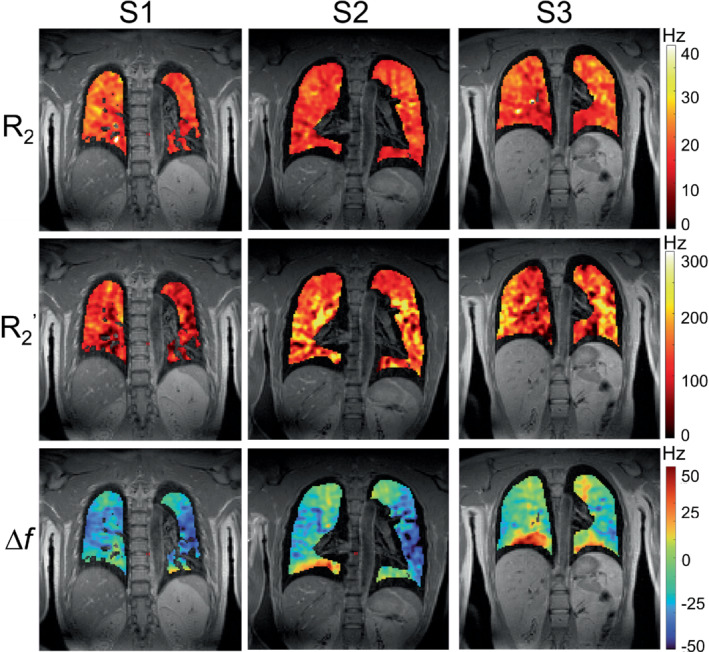
Results: The mean R2 and values of lung parenchyma obtained from ES-MCSE were 17.3 ± 0.7 Hz and 127.5 ± 16.4 Hz (T2 = 61.6 ± 1.7 ms; = 9.5 ms ± 1.6 ms), respectively. The off-resonance estimates ranged from -60 to 30 Hz. The R2 from T2 -Prep bSSFP was 15.7 ± 1.7 Hz (T2 = 68.6 ± 8.6 ms) and from multi-echo gradient echo was 131.2 ± 30.4 Hz ( = 8.0 ± 2.5 ms). Paired t-test indicated that there is a significant difference between the proposed and reference methods (p < 0.05). The mean R2 estimate from T2 -Prep bSSFP was slightly smaller than that from ES-MCSE, whereas the mean and estimates from ES-MCSE and multi-echo gradient echo were similar to each other across all subjects.
Conclusions: Joint estimation of transverse relaxation rates and off-resonance is feasible at 0.55 T with a free-breathing electrocardiogram-gated and navigator-gated ES-MCSE sequence. At 0.55 T, the mean R2 of 17.3 Hz is similar to the reported mean R2 of 16.7 Hz at 1.5 T, but the mean of 127.5 Hz is about 5-10 times smaller than that reported at 1.5 T.
Keywords: 0.55T MRI; R2 and R2′ mapping; echo-shifted multi-echo spin echo; low-field MRI; lung imaging; transverse relaxation rates.
© 2022 The Authors. Magnetic Resonance in Medicine published by Wiley Periodicals LLC on behalf of International Society for Magnetic Resonance in Medicine.
Conflict of interest statement
Sophia Cui is an employee of Siemens Healthineers.
Figures
Similar articles
-
Reversible, irreversible and effective transverse relaxation rates in normal aging brain at 3T.Neuroimage. 2014 Jan 1;84:1032-41. doi: 10.1016/j.neuroimage.2013.08.051. Epub 2013 Sep 1. Neuroimage. 2014. PMID: 24004692
-
Value of transverse relaxometry difference methods for iron in human brain.Magn Reson Imaging. 2016 Jan;34(1):51-9. doi: 10.1016/j.mri.2015.09.002. Epub 2015 Oct 3. Magn Reson Imaging. 2016. PMID: 26435459
-
Simultaneous pH-sensitive and oxygen-sensitive MRI of human gliomas at 3 T using multi-echo amine proton chemical exchange saturation transfer spin-and-gradient echo echo-planar imaging (CEST-SAGE-EPI).Magn Reson Med. 2018 Nov;80(5):1962-1978. doi: 10.1002/mrm.27204. Epub 2018 Apr 6. Magn Reson Med. 2018. PMID: 29626359 Free PMC article.
-
Identification of patients with hereditary haemochromatosis by magnetic resonance imaging and spectroscopic relaxation time measurements.Magn Reson Imaging. 1992;10(6):867-79. doi: 10.1016/0730-725x(92)90440-b. Magn Reson Imaging. 1992. PMID: 1461084 Review.
-
T2 Relaxation Times at Cardiac MRI in Healthy Adults: A Systematic Review and Meta-Analysis.Radiology. 2020 Nov;297(2):344-351. doi: 10.1148/radiol.2020200989. Epub 2020 Aug 25. Radiology. 2020. PMID: 32840469 Free PMC article.
Cited by
-
Single breath-hold volumetric lung imaging at 0.55T using stack-of-spiral (SoS) out-in balanced SSFP.Magn Reson Med. 2025 May;93(5):1999-2007. doi: 10.1002/mrm.30386. Epub 2024 Nov 28. Magn Reson Med. 2025. PMID: 39607896 Free PMC article.
-
T1 and T2 measurements across multiple 0.55T MRI systems using open-source vendor-neutral sequences.Magn Reson Med. 2025 Jan;93(1):289-300. doi: 10.1002/mrm.30281. Epub 2024 Sep 1. Magn Reson Med. 2025. PMID: 39219179
-
Pulmonary MRI in Newborns and Children.J Magn Reson Imaging. 2025 May;61(5):2094-2115. doi: 10.1002/jmri.29669. Epub 2024 Dec 6. J Magn Reson Imaging. 2025. PMID: 39639777 Free PMC article. Review.
-
Replication of the bSTAR sequence and open-source implementation.Magn Reson Med. 2024 Apr;91(4):1464-1477. doi: 10.1002/mrm.29947. Epub 2023 Dec 3. Magn Reson Med. 2024. PMID: 38044680 Free PMC article.
-
Assessment of the Diagnostic Efficacy of Low-Field Magnetic Resonance Imaging: A Systematic Review.Diagnostics (Basel). 2024 Jul 19;14(14):1564. doi: 10.3390/diagnostics14141564. Diagnostics (Basel). 2024. PMID: 39061702 Free PMC article. Review.
References
-
- Javed A, Ramasawmy R, Moss J, et al. Optimized 3D spiral ultra‐short echo time free‐breathing pulmonary imaging on a high‐performance low‐field 0.55T scanner. In: Proceedings of the 29th Annual Meeting of ISMRM [Virtual], 2021. Abstract #596.
-
- Ohno Y, Koyama H, Yoshikawa T, et al. T2* measurements of 3‐T MRI with ultrashort TEs: capabilities of pulmonary function assessment and clinical stage classification in smokers. Am J Roentgenol. 2011;197:279‐285. - PubMed
Publication types
MeSH terms
LinkOut - more resources
Full Text Sources
Medical
Miscellaneous
