

Joint spectral quantification of MR spectroscopic imaging using linear tangent space alignment-based manifold learning
- PMID: 36404676
- PMCID: PMC9892363
- DOI: 10.1002/mrm.29526
Joint spectral quantification of MR spectroscopic imaging using linear tangent space alignment-based manifold learning
Abstract
Purpose: To develop a manifold learning-based method that leverages the intrinsic low-dimensional structure of MR Spectroscopic Imaging (MRSI) signals for joint spectral quantification.
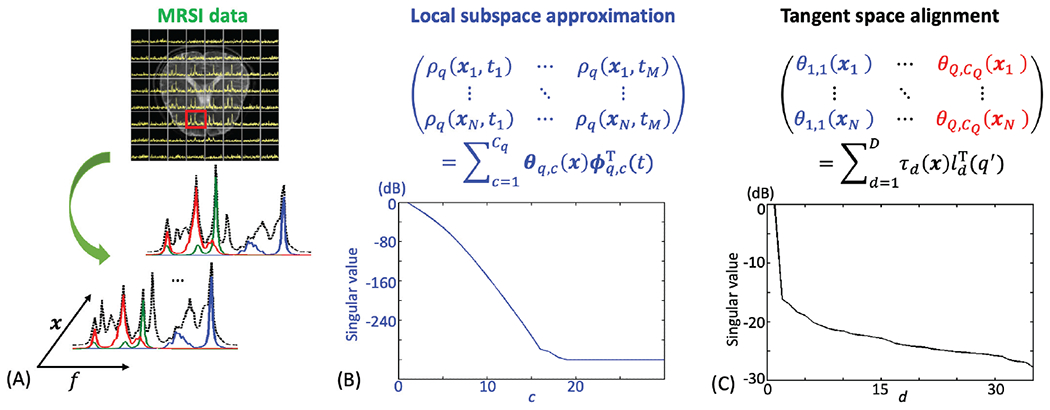
Methods: A linear tangent space alignment (LTSA) model was proposed to represent MRSI signals. In the proposed model, the signals of each metabolite were represented using a subspace model and the local coordinates of the subspaces were aligned to the global coordinates of the underlying low-dimensional manifold via linear transform. With the basis functions of the subspaces predetermined via quantum mechanics simulations, the global coordinates and the matrices for the local-to-global coordinate alignment were estimated by fitting the proposed LTSA model to noisy MRSI data with a spatial smoothness constraint on the global coordinates and a sparsity constraint on the matrices.
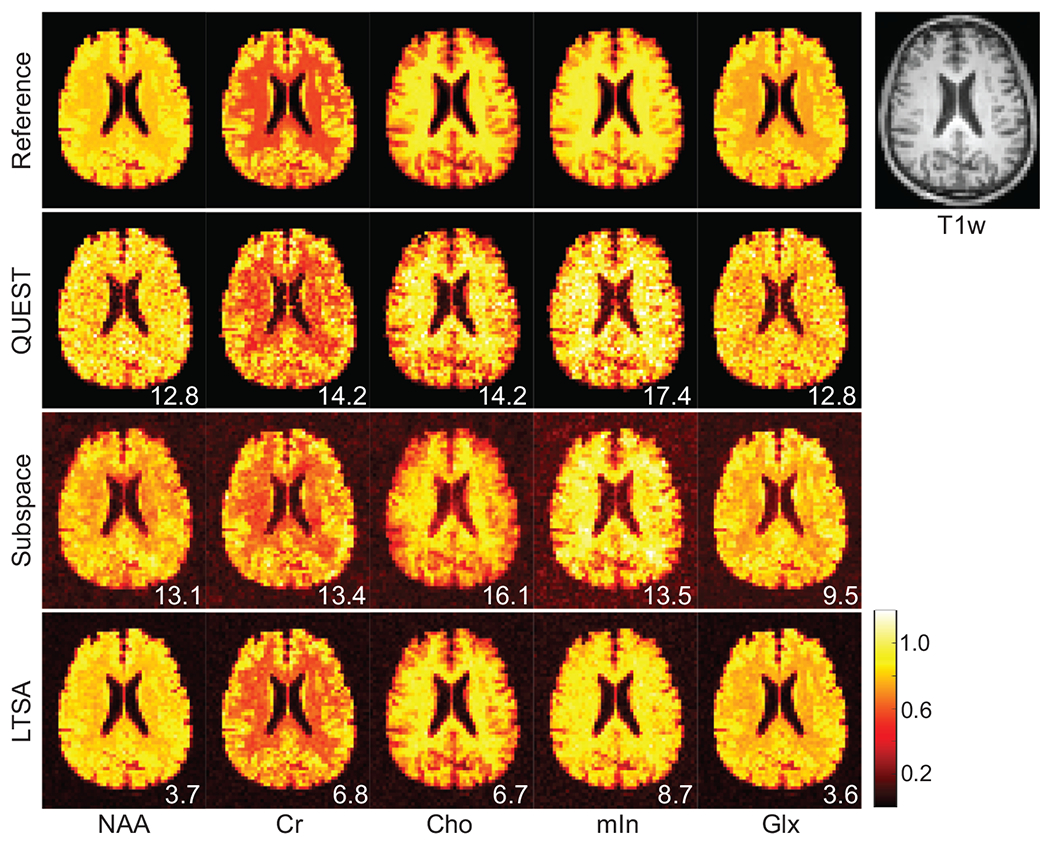
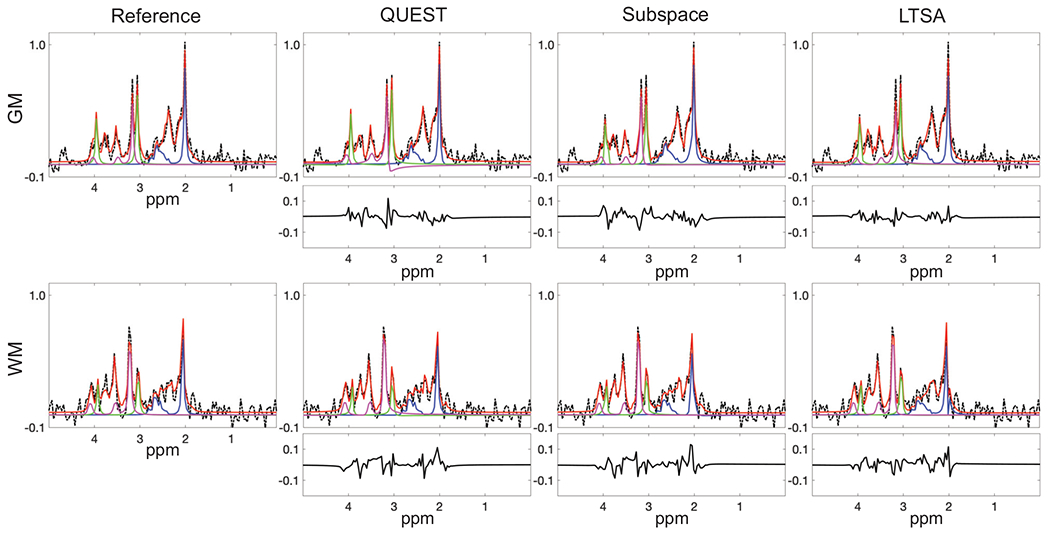
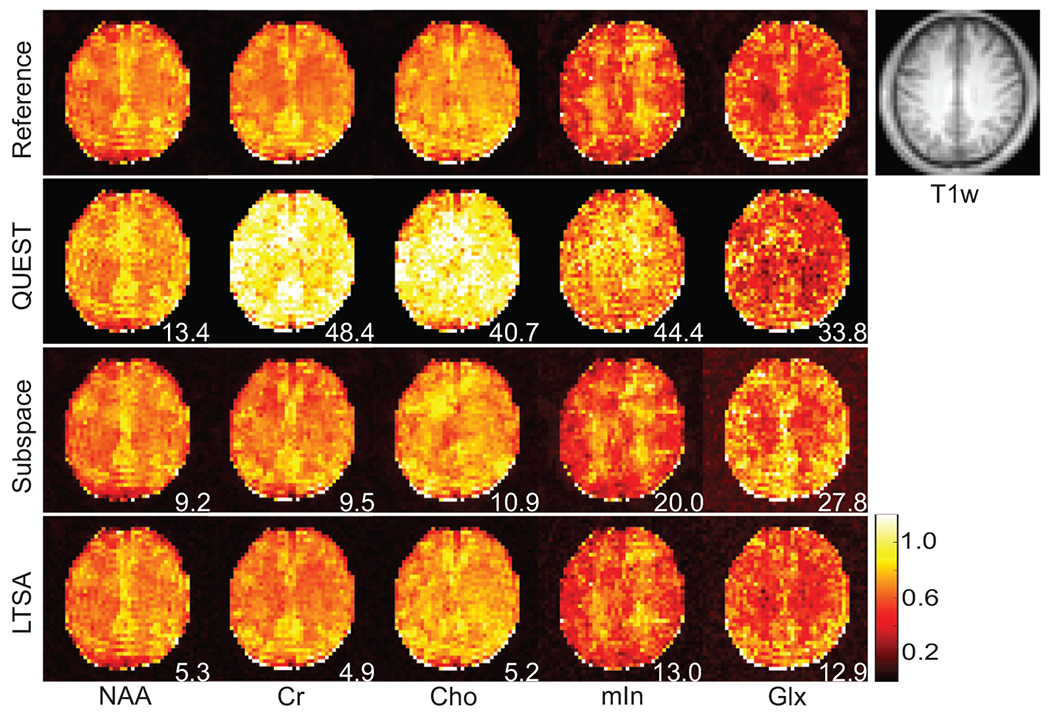
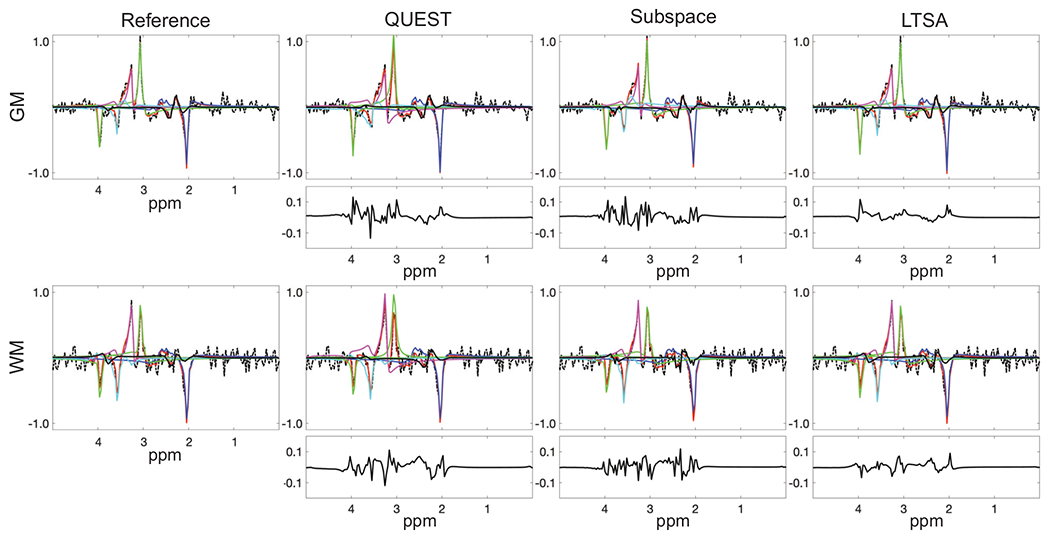
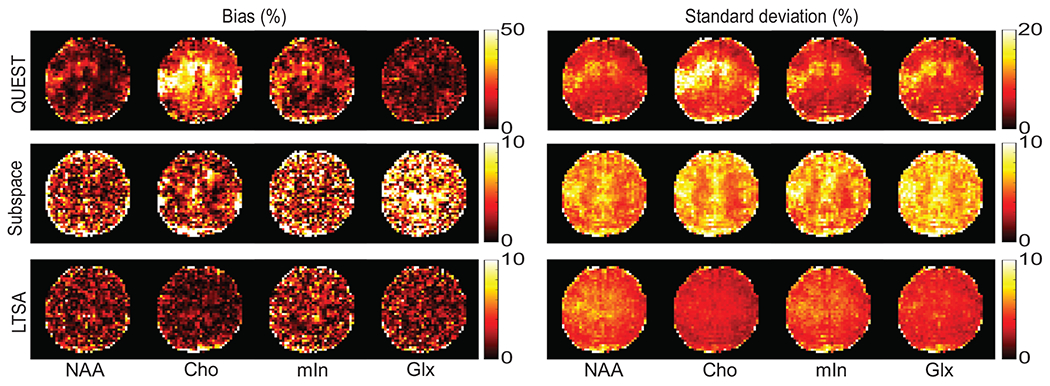
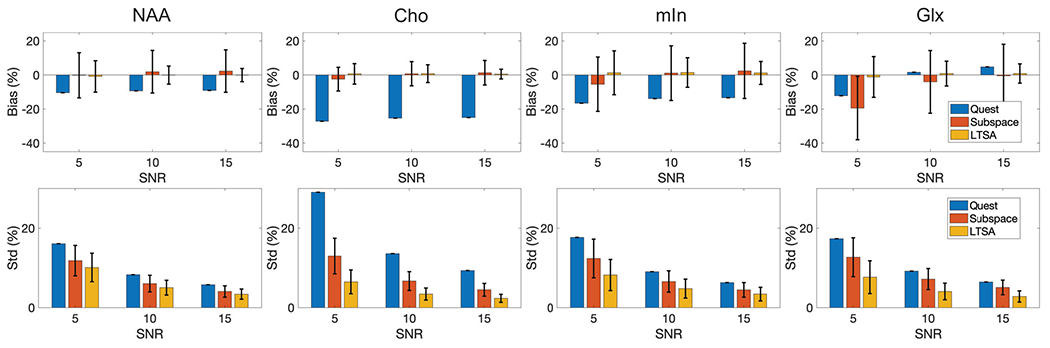
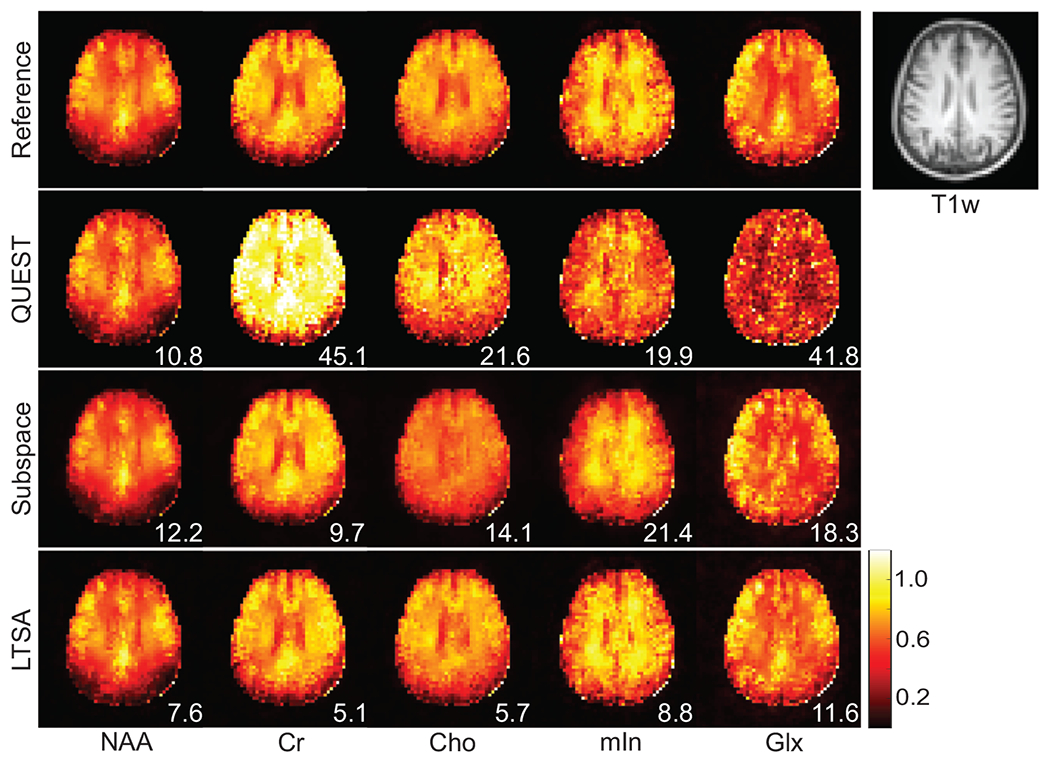
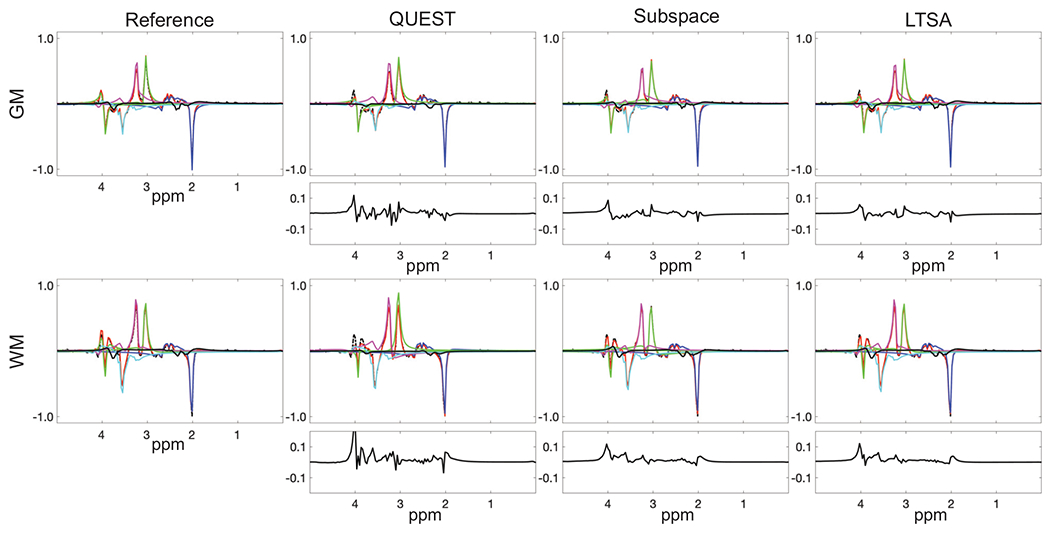
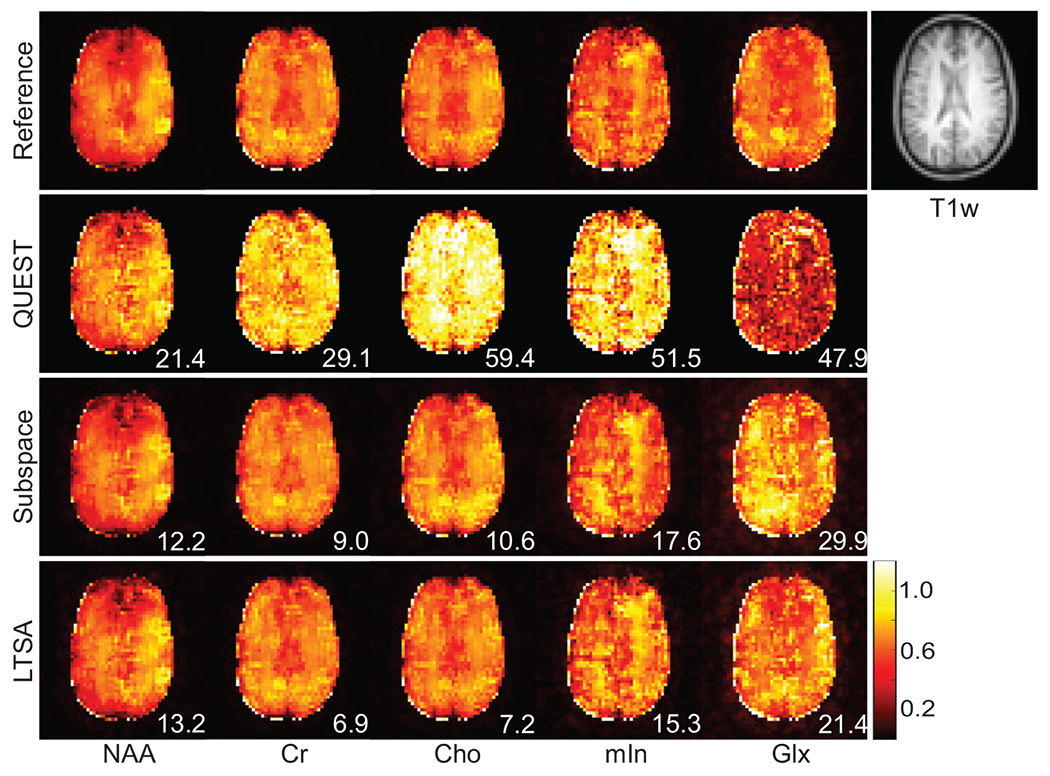
Results: The performance of the proposed method was validated using numerical simulation data and in vivo proton-MRSI experimental data acquired on healthy volunteers at 3T. The results of the proposed method were compared with the QUEST method and the subspace-based method. In all the compared cases, the proposed method achieved superior performance over the QUEST and the subspace-based methods both qualitatively in terms of noise and artifacts in the estimated metabolite concentration maps, and quantitatively in terms of spectral quantification accuracy measured by normalized root mean square errors.
Conclusion: Joint spectral quantification using linear tangent space alignment-based manifold learning improves the accuracy of MRSI spectral quantification.
Keywords: MRSI; linear tangent space alignment; manifold learning; spectral quantification.
© 2022 International Society for Magnetic Resonance in Medicine.
Figures
Similar articles
-
Manifold Learning via Linear Tangent Space Alignment (LTSA) for Accelerated Dynamic MRI With Sparse Sampling.IEEE Trans Med Imaging. 2023 Jan;42(1):158-169. doi: 10.1109/TMI.2022.3207774. Epub 2022 Dec 29. IEEE Trans Med Imaging. 2023. PMID: 36121938 Free PMC article.
-
Ultrafast magnetic resonance spectroscopic imaging using SPICE with learned subspaces.Magn Reson Med. 2020 Feb;83(2):377-390. doi: 10.1002/mrm.27980. Epub 2019 Sep 4. Magn Reson Med. 2020. PMID: 31483526 Free PMC article.
-
A Subspace Approach to Spectral Quantification for MR Spectroscopic Imaging.IEEE Trans Biomed Eng. 2017 Oct;64(10):2486-2489. doi: 10.1109/TBME.2017.2741922. Epub 2017 Aug 18. IEEE Trans Biomed Eng. 2017. PMID: 28829303 Free PMC article.
-
WALINET: A water and lipid identification convolutional neural network for nuisance signal removal in MR spectroscopic imaging.Magn Reson Med. 2025 Apr;93(4):1430-1442. doi: 10.1002/mrm.30402. Epub 2024 Dec 31. Magn Reson Med. 2025. PMID: 39737778 Free PMC article.
-
Developments in proton MR spectroscopic imaging of prostate cancer.MAGMA. 2022 Aug;35(4):645-665. doi: 10.1007/s10334-022-01011-9. Epub 2022 Apr 20. MAGMA. 2022. PMID: 35445307 Free PMC article. Review.
Cited by
-
Free-breathing 3D cardiac extracellular volume (ECV) mapping using a linear tangent space alignment (LTSA) model.Magn Reson Med. 2025 Feb;93(2):536-549. doi: 10.1002/mrm.30284. Epub 2024 Oct 14. Magn Reson Med. 2025. PMID: 39402014
-
Manifold Learning via Linear Tangent Space Alignment (LTSA) for Accelerated Dynamic MRI With Sparse Sampling.IEEE Trans Med Imaging. 2023 Jan;42(1):158-169. doi: 10.1109/TMI.2022.3207774. Epub 2022 Dec 29. IEEE Trans Med Imaging. 2023. PMID: 36121938 Free PMC article.
-
Multi-Parametric Molecular Imaging of the Brain Using Optimized Multi-TE Subspace MRSI.IEEE Trans Biomed Eng. 2024 Jun;71(6):1732-1744. doi: 10.1109/TBME.2023.3349375. Epub 2024 May 20. IEEE Trans Biomed Eng. 2024. PMID: 38170654 Free PMC article.
-
High-Dimensional MR Spatiospectral Imaging by Integrating Physics-Based Modeling and Data-Driven Machine Learning: Current progress and future directions.IEEE Signal Process Mag. 2023 Mar;40(2):101-115. doi: 10.1109/msp.2022.3203867. Epub 2023 Feb 27. IEEE Signal Process Mag. 2023. PMID: 37538148 Free PMC article.
References
-
- Barkhuijsen H, Beer R, Ormondt D. Improved algorithm for noniterative time-domain model fitting to exponentially damped magnetic resonance signals. J Magn Reson. 1987;73:553–557.
-
- Pijnappel WW, Boogaart A, Beer R, Ormondt D. SVD-based quantification of magnetic resonance signals. J Magn Reson. 1992;97:122–134.
-
- Barkhuijsen H, Beer R, Bovée WMM, Ormondt D. Retrieval of frequencies, amplitudes, damping factors, and phases from time-domain signals using a linear least-squares procedure. J Magn Reson. 1985;61:465–481.
Publication types
MeSH terms
Grants and funding
LinkOut - more resources
Full Text Sources
Medical
