. 2022 Nov 2;25(12):105481.
doi: 10.1016/j.isci.2022.105481. eCollection 2022 Dec 22.

GPI-anchored ligand-BioID2-tagging system identifies Galectin-1 mediating Zika virus entry

Affiliations

GPI-anchored ligand-BioID2-tagging system identifies Galectin-1 mediating Zika virus entry

Shan-Shan Gao et al. iScience. .

Abstract

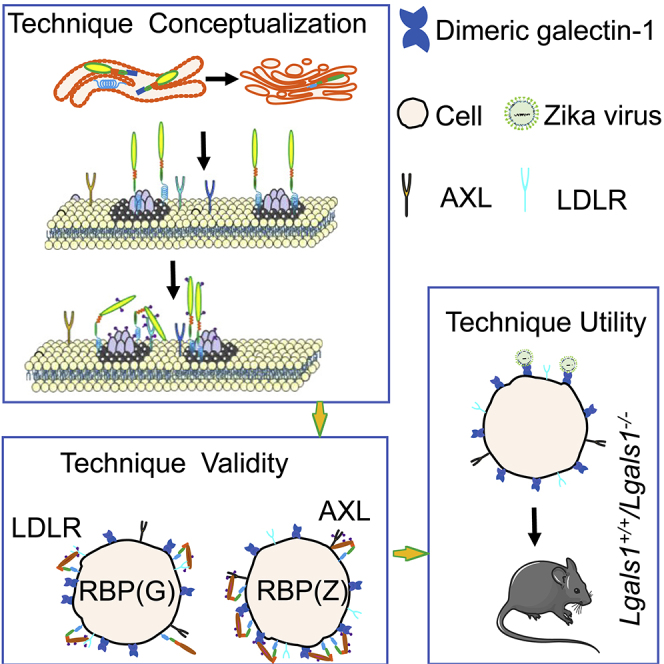
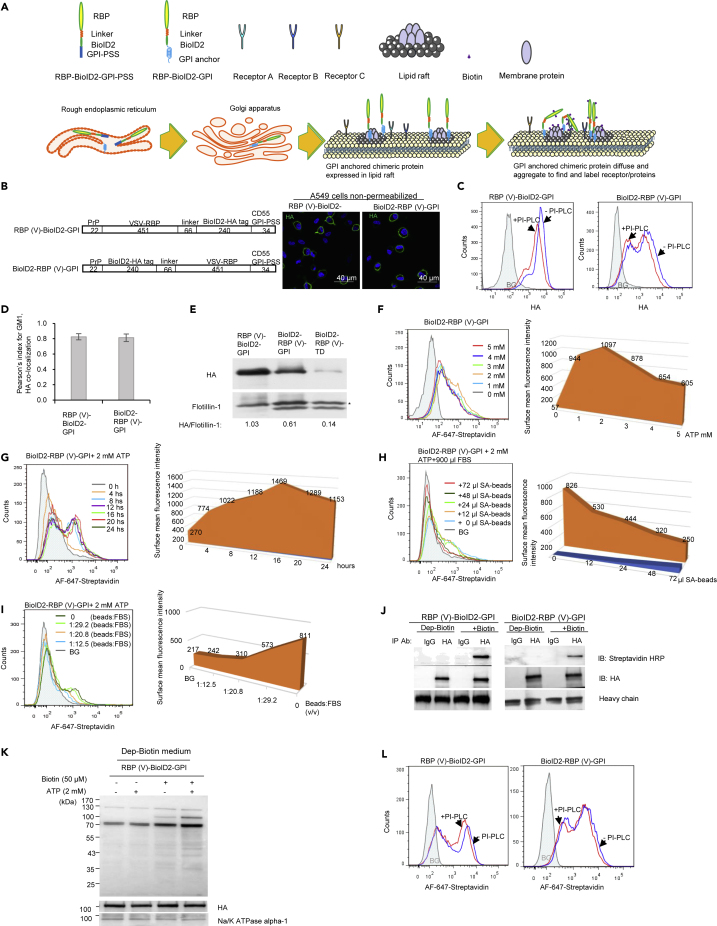
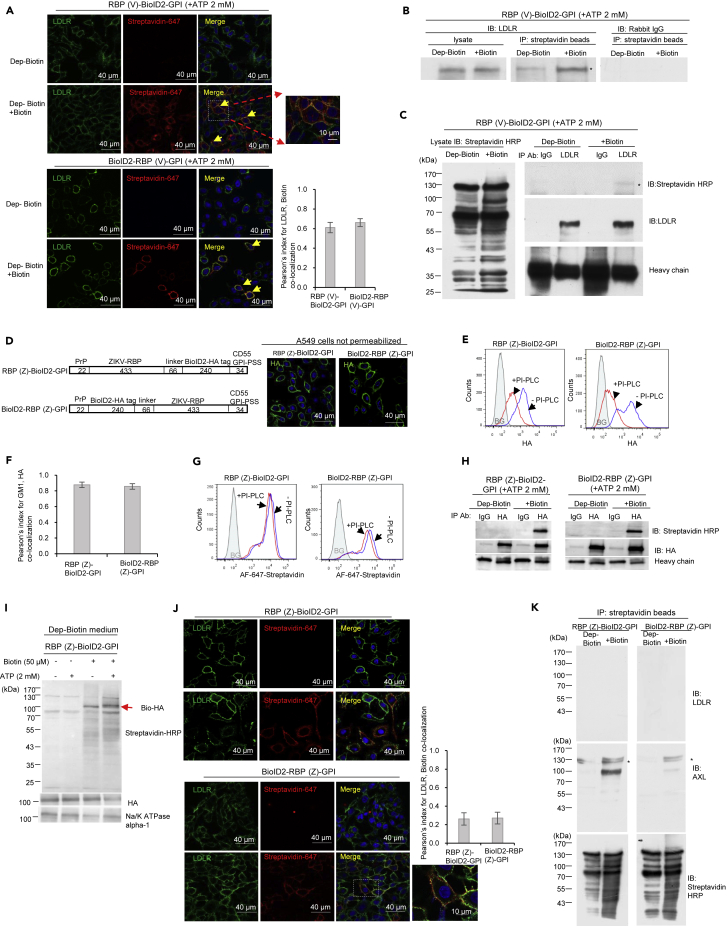
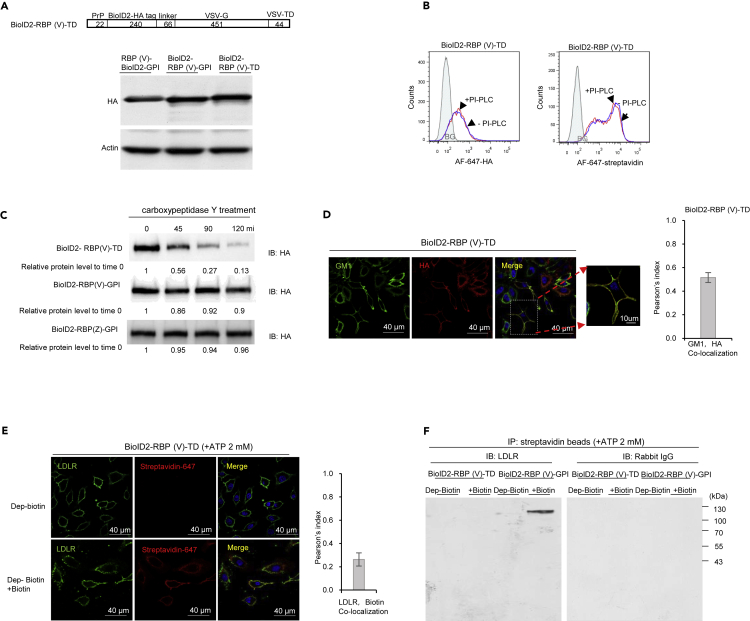
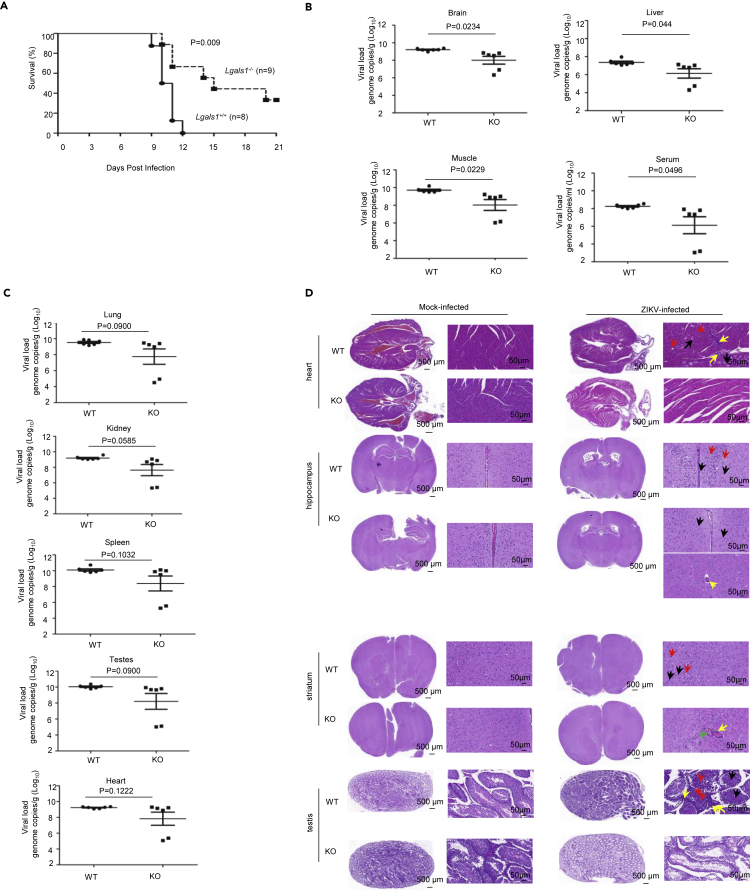
Identification of host factors facilitating pathogen entry is critical for preventing infectious diseases. Here, we report a tagging system consisting of a viral receptor-binding protein (RBP) linked to BioID2, which is expressed on the cell surface via a GPI anchor. Using VSV or Zika virus (ZIKV) RBP, the system (BioID2- RBP(V)-GPI; BioID2-RBP(Z)-GPI) faithfully identifies LDLR and AXL, the receptors of VSV and ZIKV, respectively. Being GPI-anchored is essential for the probe to function properly. Furthermore, BioID2-RBP(Z)-GPI expressed in human neuronal progenitor cells identifies galectin-1 on cell surface pivotal for ZIKV entry. This conclusion is further supported by antibody blocking and galectin-1 silencing in A549 and mouse neural cells. Importantly, Lgals1 -/- mice are significantly more resistant to ZIKV infection than Lgals1 +/+ littermates are, having significantly lower virus titers and fewer pathologies in various organs. This tagging system may have broad applications for identifying protein-protein interactions on the cell surface.

Keywords: Biological sciences; Microbiology; Molecular biology; Virology.


Conflict of interest statement

The authors declare no competing interests.

Figures

None
Graphical abstract
Figure 1
Figure 1
Establishing the experimental conditions that enable RBP-BioID2-GPI and BioID2-RBP-GPI to carry out biotinylation on the cell surface proteins (A) A diagram of the design of the RBP-BioID2-GPI and BioID2-RBP-GPI chimeric probes. Receptor binding protein (RBP) can be a ligand or a virus envelope protein or glycoprotein without a transmembrane domain (TD). The RBP was linked to the BioID2 via a linker. To generate the GPI anchored RBP-BioID2-GPI and BioID2-RBP-GPI probe, the leader peptide was placed at the N-terminus of the probe whereas the GPI-PSS was placed at the C-terminus of the probe. This GPI-anchored BioID2 probe was expressed in host cells. The probe can diffuse and aggregate on the cell surface to bind and biotinylate the receptor based on proximity labeling. For simplicity, only the synthesis of RBP-BioID2-GPI chimeric protein was shown. (B) Schematic diagrams of RBP(V)-BioID2-GPI and BioID2-RBP(V)-GPI chimeric proteins expressed on the surface of A549 cells were drawn. The construct was composed of RBP(V) from the VSV glycoprotein, the leader peptide of PrP (amino acids 1–22 from human PrP), HA-tagged BioID2 (BioID2-HA tag), a linker of 66 amino acids, and the GPI-PSS of CD55. Numbers represent the number of amino acids of each component and the drawing is not in scale. The chimeric proteins were expressed in A549 cells and immunofluorescence staining of HA was performed with an antibody specific to the HA tag. Nuclei were counterstained with DAPI. Scale bar: 40 μm. (C) RBP(V)-BioID2-GPI and BioID2-RBP(V)-GPI chimeric proteins were sensitive to PI-PLC treatment. A549 cells expressing the chimeric proteins were stained for cell surface HA signals with or without PI-PLC treatment. An obvious shift of cell surface HA signals was detected after PI-PLC treatment based on flow cytometry analysis. BG: background (in shadow), the same cells stained with control antibody at the same concentration. (D) RBP(V)-BioID2-GPI and BioID2-RBP(V)-GPI chimeric proteins were co-localized with GM1 in A549 cells. Pearson’s index for GM1 and HA showed the co-localization of GM1 and HA signals based on confocal immunofluorescence staining (N = 22). Data are represented as mean +/- SEM. (E) RBP(V)-BioID2-GPI and BioID2-RBP(V)-GPI chimeric proteins were localized in lipid rafts in A549 cells. Membrane fractionation of the chimeric proteins showed that GPI anchored proteins were in the lipid raft. A TD-tagged chimeric protein (BioID2-RBP(V)-TD), in which the GPI-PSS was replaced with the TD of VSV glycoprotein, was used as a negative control and was barely detectable in the lipid raft. Flotillin-1 from the fractionations was detected as a positive control for lipid raft fraction. ∗ indicates the position of flotillin-1. The protein band was identified by the anti-flotillin-1 antibody, beneath the flotillin-1 band was because of a non-specific reaction. (F) 2 mM of exogenously added ATP was the optimum concentration for BioID2-RBP(V)-GPI catalytic activity. Effects of different concentrations of exogenously added ATP on biotin ligase activity were assayed by flow cytometry. Cell surface biotin was detected with AF-647-streptavidin 18 h after ATP addition. Geometry means of surface fluorescence intensity were depicted (Y-axis) against the concentration of exogenously added ATP added (X-axis). (G) 16 h after 2 mM of exogenously added ATP in the culture medium of A549 cells expressing BioID2-RBP(V)-GPI produced the optimum biotin signals on the cell surface. Cell surface biotin was detected with AF-647-streptavidin at different time points post ATP addition. Geometry means of surface fluorescence intensity were depicted (Y-axis) against the timepoint of exogenously added ATP (X-axis). (H) 72 μL of SA-beads were required to deplete biotin in 900 μL of FBS. Cell surface biotin signals were detected with AF-647-streptavidin for cells cultured with different volumes of SA-beads treated medium. Geometry means of surface fluorescence intensity were depicted (Y-axis) against the volume of SA-beads used to deplete biotin in FBS (X-axis). (I) In the presence of 72 μL of SA-beads, biotin in 900 μL of FBS, but not biotin in 1.5 mL, 2.1 mL, or above the volume of FBS could be depleted. Cell surface biotin signals were detected with AF-647-streptavidin for cells cultured with different volumes of medium containing FBS treated by 72 μL of SA-beads. Geometry means of surface fluorescence intensity were depicted (Y-axis) against the ratio of beads volume to FBS volume treated with 72 μL of SA-beads (X-axis). (J) RBP(V)-BioID2-GPI and BioID2-RBP(V)-GPI chimeric proteins expressed in A549 cells were biotinylated in the presence of exogenously added biotin. Chimeric proteins in the presence or absence of biotin were purified and blotted with an antibody specific against the HA tag or with streptavidin-HRP. The heavy chains of antibody used for immune purification were indicated. (K) Exogenously added ATP and biotin were required for biotin ligase in RBP(V)-BioID2-GPI chimeric protein to function. Immunoblotting with streptavidin-HRP was performed for cell membrane fraction of A549 cells expressing RBP(V)-BioID2-GPI chimeric protein in the presence or absence of ATP or/and biotin. Without the addition of biotin, the chimeric proteins themselves were not biotinylated. More biotin signals were detected for membrane proteins extracted from cells treated with both exogenously added biotin and ATP compared to cells treated with only biotin addition. Na/K ATPase α1 was blotted to show equal membrane loading. (L) Biotinylated proteins on the cell surface of A549 cells expressing BioID2-RBP(V)-GPI and RBP(V)-BioID2-GPI chimeric proteins were relatively resistant to PI-PLC treatment compared to the chimeric proteins themselves. Flow cytometry was performed to stain cell surface biotin with AF-647-streptavidin before and after PI-PLC treatment. BG: background (in shadow), A549 cells transfected with empty vector and stained with AF-647-streptavidin. See also Figure S1.
Figure 2
Figure 2
The RBP in the GPI anchored chimeric proteins determines receptor binding specificity (A) Colocalization of LDL receptor (LDLR) and biotin signals on the cell surface of A549 cells expressing RBP(V)-BioID2-GPI and BioID2-RBP(V)-GPI chimeric proteins. Confocal immunofluorescence staining of LDLR (green) and biotin (red) was performed with an antibody specific for LDLR and AF-647-streptavidin (pseudo-colored in red to show the staining). Some cells were zoomed in to show details of co-localization. Pearson’s index for LDLR and biotin signals confirmed the co-localization of these signals (N = 22). Data are represented as mean +/- SEM. Scale bar: 40 μm or 10 μm as indicated. (B) LDLR was purified by SA-beads from cell lysate of A549 cells expressing RBP(V)-BioID2-GPI chimeric protein. Biotinylated proteins were purified with SA-beads and immunoblotted with an antibody specific for LDLR or a control antibody used at the same concentration. Significantly more LDLR signals were detected only when A549 cells expressing the chimeric protein were treated with exogenously added biotin. ∗ indicates the position of LDLR. (C) Purified LDLR reacted with streptavidin-HRP. LDLR in A549 cells expressing RBP(V)-BioID2-GPI chimeric protein was purified with an antibody specific for LDLR in the presence or absence of exogenously added biotin. Biotin signals from purified LDLR were detected only when the cells were treated with biotin (Comparing the lane 2 to the lane 4 of top right panel). In the absence of exogenously added biotin, LDLR was purified by the specific antibody but did not show a reaction to streptavidin-HRP (lane 2 of top right panel). The same cell lysate purified with a control antibody in the presence of exogenously added biotin did not show a reaction to streptavidin-HRP (lane 3 of top right panel). IgG heavy chain was shown to indicate the amount of antibody used for immunoprecipitation. ∗ indicates the position of LDLR. (D) The RBP(Z)-BioID2-GPI and BioID2-RBP(Z)-GPI chimeric proteins are expressed on the surface of A549 cells. Schematic diagrams of the RBP(Z)-BioID2-GPI and BioID2-RBP(Z)-GPI were drawn (top panel). The RBP(V) was replaced with the ZIKV envelope protein (RBP(Z)). All the other components were the same as those for the RBP(V)-BioID2-GPI and BioID2-RBP(V)-GPI. Numbers represent the number of amino acids of each component and the drawing is not in scale. The chimeric proteins were expressed in A549 cells and immunofluorescence staining of HA was performed with an antibody specific to the HA tag (bottom panel). Nuclei were counterstained with DAPI. Scale bar: 40 μm. (E) The RBP(Z)-BioID2-GPI and BioID2-RBP(Z)-GPI chimeric proteins were sensitive to PI-PLC treatment. A549 cells expressing the chimeric proteins were stained for cell surface HA with or without PI-PLC treatment. An obvious shift of cell surface HA signals was detected after PI-PLC treatment based on flow cytometry analysis. BG: background (in shadow), the same cells stained with a control antibody at the same concentration as an anti-HA antibody. (F) The RBP(Z)-BioID2-GPI and BioID2-RBP(Z)-GPI chimeric proteins expressed on the surface of A549 cells were localized in the lipid raft. Co-localization with GM1 was confirmed by Pearson’s index of GM1 and HA (N = 22). Data are represented as mean +/- SEM. (G) Biotinylated proteins on the cell surface of A549 cells expressing RBP(Z)-BioID2-GPI and BioID2-RBP(Z)-GPI chimeric proteins were relatively resistant to PI-PLC treatment compared to the chimeric proteins themselves. Flow cytometry was performed to stain cell surface biotin with AF-647-streptavidin with or without PI-PLC treatment. BG: background (in shadow), A549 cells transfected with empty vector and stained with AF-647-streptavidin. (H) RBP(Z)-BioID2-GPI and BioID2-RBP(Z)-GPI chimeric proteins expressed in A549 cells were biotinylated in the presence of exogenously added biotin. Chimeric proteins in the presence or absence of biotin were purified and blotted with an antibody specific against the HA tag or with streptavidin-HRP. The heavy chain of antibodies used for immune purification was indicated. (I) Exogenously added ATP and biotin were required for biotin ligase in RBP(Z)-BioID2-GPI chimeric protein to function. Immunoblotting with streptavidin-HRP was performed for cell membrane fraction of A549 cells expressing RBP(Z)-BioID2-GPI chimeric protein in the presence or absence of ATP or/and biotin. Without the addition of biotin, the chimeric proteins themselves were not biotinylated. More biotin signals were detected for membrane proteins extracted from cells treated with both exogenously added biotin and ATP compared to cells treated only with biotin addition. Na/K ATPase α1 was blotted to show equal amount of membrane loading. (J) No co-localization of LDLR and biotin signals on the cell surface of A549 cells expressing RBP(Z)-BioID2-GPI and BioID2-RBP(Z)-GPI chimeric proteins. Confocal immunofluorescence staining of LDLR (green) and biotin (red) was performed with an antibody specific for LDLR and AF-647 nm streptavidin (pseudo-colored in red to show the staining). Some cells were zoomed in to show details of co-localization. Pearson’s index for LDLR and biotin signals confirmed no co-localization of these signals (N = 22). Data are represented as mean +/- SEM. Scale bar: 40 μm or 10 μm as indicated. (K) The RBP from ZIKV could co-purify AXL but not LDLR. A549 cells expressing RBP(Z)-BioID2-GPI and BioID2-RBP(Z)-GPI chimeric proteins were treated in the presence or absence of biotin and purified with SA-beads then detected with antibodies specific for LDLR (upper panels) or AXL (middle panels), respectively. The immunoprecipitated products were also detected with streptavidin-HRP (bottom panels). ∗ indicates the position of AXL. See also Figure S2.
Figure 3
Figure 3
GPI anchor is critical for RBP-BioID2/ BioID2-RBP chimeric protein to bind the receptor specifically (A) Levels of RBP(V)-BioID2-GPI and BioID2-RBP(V)-GPI or BioID2-RBP(V)-TD chimeric proteins were similar. The schematic diagram of BioID2-RBP(V)-TD chimeric protein. This chimeric protein differed from BioID2-RBP(V)-GPI only in that the GPI-PSS was replaced with the TD of VSV-G. Numbers represent the number of amino acids of each component. Cell lysates from A549 cells expressing RBP(V)-BioID2-GPI, BioID2-RBP(V)-GPI and BioID2-RBP(V)-TD chimeric proteins were immunoblotted with an anti-HA antibody. Actin was blotted as a loading control. (B) BioID2-RBP(V)-TD chimeric protein expressed in A549 cells was resistant to PI-PLC treatment, suggesting most biotinylated proteins were not GPI-anchored. Flow cytometry was performed for A549 cells expressing BioID2-RBP(V)-TD chimeric protein in the presence or absence of PI-PLC treatment and detected with an antibody specific for HA or AF-647-streptavidin. BG: background (in shadow), A549 cells transfected with the empty vector and detected with an antibody specific for HA or AF-647-streptavidin. (C) BioID2-RBP(V)-TD chimeric protein expressed in A549 cells was sensitive to carboxypeptidase Y treatment. In contrast, BioID2-RBP(V)-GPI and BioID2-RBP(Z)-GPI chimeric proteins were resistant to carboxypeptidase Y treatment due to the presence of the GPI anchor at the C-terminus. Chimeric proteins were purified with an antibody specific to HA and treated with carboxypeptidase Y for different periods as indicated and then immunoblotted with an antibody specific to HA. Relative protein levels were quantified by IMAGE J. (D) BioID2-RBP(V)-TD was not in the lipid raft. Confocal immunofluorescence staining of GM1 (green) and HA (red) showed no co-localization between GM1 and the chimeric protein. Pearson’s index for GM1 and HA signals confirmed the limited co-localization of these signals (N = 22). Data are represented as mean +/- SEM. Scale bar: 40 μm or 10 μm as indicated. (E) No co-localization of LDLR and biotin signals on the cell surface of A549 cells expressing BioID2-RBP(V)-TD chimeric proteins. Confocal immunofluorescence staining of LDLR (green) and biotin (red) was performed with an antibody specific for LDLR and AF-647-streptavidin (pseudo-colored in red to show the staining). Pearson’s index for LDLR and biotin signals confirmed no co-localization of these signals (N = 22). Data are represented as mean +/- SEM. Scale bar: 40 μm. (F) LDLR from A549 cells expressing BioID2-RBP(V)-TD chimeric protein was not biotinylated. A549 cells expressing BioID2-RBP(V)-TD or BioID2-RBP(V)-GPI were cultured in the presence or absence of exogenously added biotin and purified with SA-beads. The precipitated products were then detected with an antibody specific against LDLR or the control rabbit IgG used at the same concentration. LDLR was only purified by SA-beads from A549 cells expressing BioID2-RBP(V)-GPI but not from A549 cells expressing BioID2-RBP(V)-TD when exogenous biotin was added. See also Figure S3.
Figure 4
Figure 4
Galectin-1 on the cell surface mediates ZIKV attachment and infection of host cells (A) Cell surface expressed BioID2-RBP(Z)-GPI chimeric protein in human neural progenitor cells (HNPCs) was PI-PLC sensitive. HNPCs transfected with BioID2-RBP(Z)-GPI was stained with an antibody specific for HA or control IgG at the same concentration showing that the chimeric protein was localized on the cell surface. Nuclei were counterstained with DAPI. Flow cytometry analysis was performed for cells treated with or without PI-PLC and stained with an antibody specific for HA. BG: background (in shadow), HNPCs transfected with the empty vector. Scale bar: 40 μm. (B) Cell surface expressed BioID2-RBP(Z)-GPI chimeric protein in HNPCs was able to biotinylate proteins in the presence of exogenously added biotin. Immunoblotting with streptavidin-HRP showed that in the presence of exogenously added biotin, many more proteins were labeled in HNPCs expressing BioID2-RBP(Z)-GPI chimeric protein than in HNPCs transfected with the empty vector. Silver staining of the SA-beads purified proteins in the presence or absence of biotin showed that the differences were consistent. Some of the differentiated purified protein bands (indicated by the red arrow) were excised and subjected to mass spectrometry analysis. (C) Galectin-1 could be detected on the cell surface of A549 and MNCs. Immunofluorescence staining with an antibody specific for galectin-1 (red) showed that galectin-1 could be detected on the cell surface although a significant amount of galectin-1 could also be detected in the cytosol of A549 cells. Scale bar: 40 μm. (D) The binding between galectin-1 and E protein (envelop protein of ZIKV) is carbohydrate-dependent. Schematic diagrams of FLAG-tagged ZIKV E protein (ZIKV-E-FLAG), HA-tagged ZIKV E protein (ZIKV-E-HA), HA-tagged N154Q ZIKV E protein (ZIKV-E(N154Q)-HA), FLAG-tagged human galectin-1, and HA tagged mouse galectin-1. Numbers represent the number of amino acids of each component. These chimeric proteins were expressed in HEK293 T cells as indicated. Co-immunoprecipitation was performed and interactions between galectin-1 and E protein were detected with an antibody specific against HA or FLAG. The light chain of the antibody used for co-immunoprecipitation was indicated. (E) Attachment assay for ZIKV on A549 cells showed that Zika virions were encapsulated by galectin-1 on the cell surface (indicated by the arrow). ZIKV used at 100 MOI was incubated with A549 cells at 4°C for 5 min. Confocal immunofluorescence staining of ZIKV E protein (green) or galectin-1 (red) was performed using antibodies specific for ZIKV E protein or galectin-1, respectively. Phase contrast image was also taken at the same time to show the edge of cells. Scale bar: 40 μm or 10 μm as indicated. (F) Silencing galectin-1 reduces ZIKV attachment to A549 cells. mRNA for ZIKV was extracted from A549 cell expressing galectin-1 or not expressing galectin-1 and RT-qPCR was performed to quantify the mRNA level of ZIKV E protein. Virions were incubated with the A549 cells at 4°C for 1 h. NC: knockout control; 2#&3# were two different targets for the human galectin-1 knockout. Data are represented as mean +/- SEM. (G) Down-regulation of galectin-1 in MNCs significantly decreased ZIKV attachment to MNCs. ZIKV was used at MOI = 100 and incubated with MNCs at 4°C for 1 h. Total mRNA was extracted and ZIKV E protein mRNA was quantified by RT-qPCR. NC: empty vector shRNAi. 1#, 2#, and 3# were different target sites for mouse Lgals1. Data are represented as mean +/- SEM. (H) Downregulation of galectin-1 in MNCs significantly decreased ZIKV E protein levels. Galectin-1 expressing and not expressing MNCs were incubated with ZIKV at MOI = 0.01 and cultured for 72 h. Galectin-1 and ZIKV E protein levels were detected by specific antibodies. Actin was blotted as a loading control. IMAGE J was used to quantify relatively ZIKV E protein to actin. NC, 1#, 2#, and 3# were described as in Figure 4G. Data are represented as mean +/- SEM. (I) Antibodies specifically against galectin-1 blocked ZIKV infection of A549 cells. cells were pretreated for 30 min with mouse monoclonal antibodies (Orb627212 and MBS769547) against galectin-1 or isotype control IgG1 used at the same concentration. The cells were then challenged with ZIKV. Blocking efficacy was calculated as follows: (mean pixel from control antibody treated cells minus mean pixel galectin-1 antibody treated cells)/mean pixel from control antibody-treated cells x 100%. Pixel was determined using IMAGE J. Data are represented as mean +/- SEM. (J) Down-regulation of galectin-1 in MNCs significantly decreased ZIKV infection of MNCs but did not impact virus releasing from host cells. Relative extracellular virus titer and intracellular virus titers were quantified by RT-qPCR based upon ZIKV E protein mRNA (ZIKV E protein mRNA at 5 × 103 copy was arbitrarily defined as 1). Infection of galectin-1 expressing and not expressing cells was performed at MOI = 0.01 for 72 h. Generation of NC, 1#, 2#, and 3# were described as in 4G. Data are represented as mean +/- SEM. (K) Down-regulation of galectin-1 in MNCs significantly mitigated mature Zika virion formation based on plaques assays. Zika virions collected from the culture medium of MNCs expressing or not expressing galectin-1 were serially diluted for plaque assay. 1 × 104 virion/mL was defined as 1 PFU. The bar graph showed the number of plaques formed. p-value and number of independent experiments were indicated. NC, 1#, and 3# were described as in Figure 4G. Data are represented as mean +/- SEM. See also Figure S4.
Figure 5
Figure 5
Lgals1−/− mice are more resistant to ZIKV infection (A) Kaplan-Meier survival curve of Lgals1−/−and Lgals1+/+ littermates. Lgals1−/−and Lgals1+/+ littermates were infected with ZIKV (PFU = 1 × 105) and the number of live mice was recorded every day till 21 days post-infection. p-value was indicated. (B) ZIKV titers in the Brain, liver, muscle, and serum were quantified. Lgals1−/− mice had a much lower level of virus titer in those organs than the WT littermates (N = 6). Data are represented as mean +/- SEM. The differences were statistically significant. p values were indicated. (C) ZIKV titers in the lung, kidney, spleen, testes, and heart were quantified. Lgals1−/− mice had a much lower level of virus titer in those organs than the WT littermates (N = 6). Data are represented as mean +/- SEM. However, the differences were not statistically significant. p values were indicated. (D) Lgals1+/+ (WT) mice showed more pathology than Lgals1−/− (KO) littermates after the ZIKV challenge. H&E staining of organs from mock-infected (Mock) and ZIKV-infected mice was shown. No obvious pathology could be detected in organs from both WT and KO mice when the mice were mock-infected (Left panel). In the heart, cardiomyocytes swelling (black arrow), vacuolar degeneration of cardiomyocytes (red arrow), and inflammatory cell infiltration (yellow arrow) were detected from WT but not from KO mice when the mice were challenged by ZIKV. In the hippocampus, neuron contractions were observed in both WT and KO mice (black arrow). Neuron swelling and vacuolation were detected in the cortex and thalamus of WT mice (red arrow) whereas leucocyte effusions were detected in the thalamus of KO mice (yellow arrow). In striatum, neuron contractions were observed in both WT and KO mice (black arrow). Neuron swelling and vacuolation could be detected in striatum of WT mice (red arrow) whereas leucocyte effusion (yellow arrow) accompanied by bleeding (green arrow) were detected in striatum of KO mice. In testes, sperm deposition in seminiferous tubules (black arrow), necrosis of epithelial cells in seminiferous tubules (red arrow), mild proliferation of stromal cells (yellow arrow) was detected in WT mice but not in KO mice. Scale bar: 500 μm or 50 μm as indicated. See also Figure S4.

Similar articles

References

    1. Rao V.S., Srinivas K., Sujini G.N., Kumar G.N.S. Protein-protein interaction detection: methods and analysis. Int. J. Proteomics. 2014;2014:147648. doi: 10.1155/2014/147648. - DOI - PMC - PubMed
    1. Qin W., Cho K.F., Cavanagh P.E., Ting A.Y. Deciphering molecular interactions by proximity labeling. Nat. Methods. 2021;18:133–143. doi: 10.1038/s41592-020-01010-5. - DOI - PMC - PubMed
    1. Wang S., Wu R., Lu J., Jiang Y., Huang T., Cai Y.D. Protein-protein interaction networks as miners of biological discovery. Proteomics. 2022;22:e2100190. doi: 10.1002/pmic.202100190. - DOI - PubMed
    1. Pillay S., Carette J.E. Hunting viral receptors using haploid cells. Annu. Rev. Virol. 2015;2:219–239. doi: 10.1146/annurev-virology-100114-055119. - DOI - PMC - PubMed
    1. Maginnis M.S. Virus-receptor interactions: the key to cellular invasion. J. Mol. Biol. 2018;430:2590–2611. doi: 10.1016/j.jmb.2018.06.024. - DOI - PMC - PubMed