

Aza-BODIPY based carbonic anhydrase IX: Strategy to overcome hypoxia limitation in photodynamic therapy
- PMID: 36405312
- PMCID: PMC9666899
- DOI: 10.3389/fchem.2022.1015883
Aza-BODIPY based carbonic anhydrase IX: Strategy to overcome hypoxia limitation in photodynamic therapy
Abstract
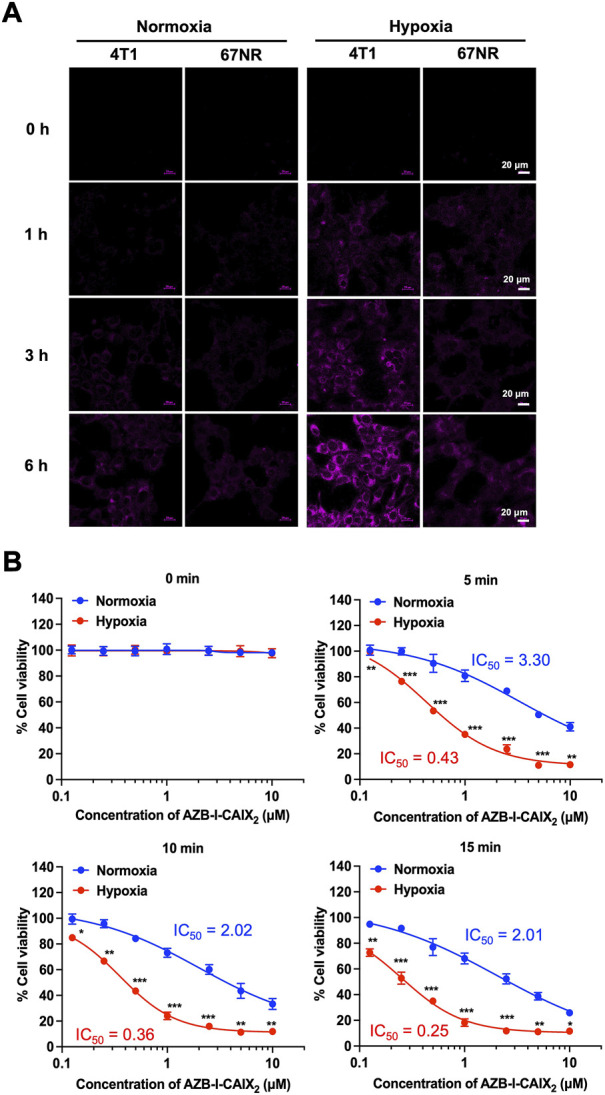
Hypoxia caused by photodynamic therapy (PDT) is a major hurdle to cancer treatment since it can promote recurrence and progression by activating angiogenic factors, lowering therapeutic efficacy dramatically. In this work, AZB-I-CAIX2 was developed as a carbonic anhydrase IX (CAIX)-targeting NIR photosensitizer that can overcome the challenge by utilizing a combination of CAIX knockdown and PDT. AZB-I-CAIX2 showed a specific affinity to CAIX-expressed cancer cells and enhanced photocytotoxicity compared to AZB-I-control (the molecule without acetazolamide). Moreover, selective detection and effective cell cytotoxicity of AZB-I-CAIX2 by PDT in hypoxic CAIX-expressed murine cancer cells were achieved. Essentially, AZB-I-CAIX2 could minimize tumor size in the tumor-bearing mice compared to that in the control groups. The results suggested that AZB-I-CAIX2 can improve therapeutic efficiency by preventing PDT-induced hypoxia through CAIX inhibition.
Keywords: PDT; acetazolamide; aza-BODIPY; carbonic anhydrase IX (CA9); hypoxia.
Copyright © 2022 Pewklang, Chansaenpak, Bakar, Lai, Kue and Kamkaew.
Conflict of interest statement
The authors declare that the research was conducted in the absence of any commercial or financial relationships that could be construed as a potential conflict of interest.
Figures


Similar articles
-
Overcoming the Limits of Hypoxia in Photodynamic Therapy: A Carbonic Anhydrase IX-Targeted Approach.J Am Chem Soc. 2017 Jun 7;139(22):7595-7602. doi: 10.1021/jacs.7b02396. Epub 2017 May 10. J Am Chem Soc. 2017. PMID: 28459562 Free PMC article.
-
Novel Near Infrared Dyes Targeting Carbonic Anhydrase IX for Fluorescence Imaging Applications.Invest Radiol. 2025 May 8. doi: 10.1097/RLI.0000000000001204. Online ahead of print. Invest Radiol. 2025. PMID: 40334098
-
Specific inhibition of carbonic anhydrase IX activity enhances the in vivo therapeutic effect of tumor irradiation.Radiother Oncol. 2011 Jun;99(3):424-31. doi: 10.1016/j.radonc.2011.05.045. Epub 2011 Jun 14. Radiother Oncol. 2011. PMID: 21676479
-
Targeting carbonic anhydrase IX with small organic ligands.Curr Opin Chem Biol. 2015 Jun;26:48-54. doi: 10.1016/j.cbpa.2015.02.005. Epub 2015 Feb 24. Curr Opin Chem Biol. 2015. PMID: 25721398 Review.
-
Co-vulnerabilities of inhibiting carbonic anhydrase IX in ferroptosis-mediated tumor cell death.Front Mol Biosci. 2023 Nov 30;10:1327310. doi: 10.3389/fmolb.2023.1327310. eCollection 2023. Front Mol Biosci. 2023. PMID: 38099193 Free PMC article. Review.
References
-
- Chafe S. C., Lou Y., Sceneay J., Vallejo M., Hamilton M. J., McDonald P. C., et al. (2015). Carbonic anhydrase IX promotes myeloid-derived suppressor cell mobilization and establishment of a metastatic niche by stimulating G-CSF production. Cancer Res. 75 (6), 996–1008. 10.1158/0008-5472.can-14-3000 - DOI - PubMed
-
- Cianchi F., Vinci M. C., Supuran C. T., Peruzzi B., De Giuli P., Fasolis G., et al. (2010). Selective inhibition of carbonic anhydrase IX decreases cell proliferation and induces ceramide-mediated apoptosis in human cancer cells. J. Pharmacol. Exp. Ther. 334 (3), 710–719. 10.1124/jpet.110.167270 - DOI - PubMed
LinkOut - more resources
Full Text Sources
Miscellaneous