

Exercise facilitates regeneration after severe nerve transection and further modulates neural plasticity
- PMID: 36405423
- PMCID: PMC9673108
- DOI: 10.1016/j.bbih.2022.100556
Exercise facilitates regeneration after severe nerve transection and further modulates neural plasticity
Abstract
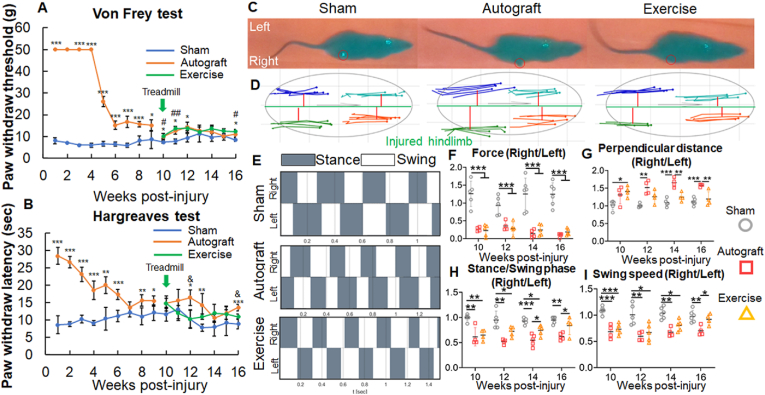
Patients with severe traumatic peripheral nerve injury (PNI) always suffer from incomplete recovery and poor functional outcome. Physical exercise-based rehabilitation, as a non-invasive interventional strategy, has been widely acknowledged to improve PNI recovery by promoting nerve regeneration and relieving pain. However, effects of exercise on chronic plastic changes following severe traumatic PNIs have been limitedly discussed. In this study, we created a long-gap sciatic nerve transection followed by autograft bridging in rats and tested the therapeutic functions of treadmill running with low intensity and late initiation. We demonstrated that treadmill running effectively facilitated nerve regeneration and prevented muscle atrophy and thus improved sensorimotor functions and walking performance. Furthermore, exercise could reduce inflammation at the injured nerve as well as prevent the overexpression of TRPV1, a pain sensor, in primary afferent sensory neurons. In the central nervous system, we found that PNI induced transcriptive changes at the ipsilateral lumber spinal dorsal horn, and exercise could reverse the differential expression for genes involved in the Notch signaling pathway. In addition, through neural imaging techniques, we found volumetric, microstructural, metabolite, and neuronal activity changes in supraspinal regions of interest (i.e., somatosensory cortex, motor cortex, hippocampus, etc.) after the PNI, some of which could be reversed through treadmill running. In summary, treadmill running with late initiation could promote recovery from long-gap nerve transection, and while it could reverse maladaptive plasticity after the PNI, exercise may also ameliorate comorbidities, such as chronic pain, mental depression, and anxiety in the long term.
Keywords: Long-gap nerve transection; MEMRI; Nerve regeneration; Neuroplasticity; Rehabilitation; Treadmill exercise.
© 2022 The Authors.
Conflict of interest statement
The authors declare that there are no competing interests.
Figures


Similar articles
-
Basic mechanisms of peripheral nerve injury and treatment via electrical stimulation.Neural Regen Res. 2022 Oct;17(10):2185-2193. doi: 10.4103/1673-5374.335823. Neural Regen Res. 2022. PMID: 35259827 Free PMC article. Review.
-
Maresin 1 promotes nerve regeneration and alleviates neuropathic pain after nerve injury.J Neuroinflammation. 2022 Feb 2;19(1):32. doi: 10.1186/s12974-022-02405-1. J Neuroinflammation. 2022. PMID: 35109876 Free PMC article.
-
Electrical stimulation combined with exercise increase axonal regeneration after peripheral nerve injury.Exp Neurol. 2009 Sep;219(1):258-65. doi: 10.1016/j.expneurol.2009.05.034. Epub 2009 Jun 3. Exp Neurol. 2009. PMID: 19500575
-
Role of physical exercise for improving posttraumatic nerve regeneration.Int Rev Neurobiol. 2013;109:125-49. doi: 10.1016/B978-0-12-420045-6.00006-7. Int Rev Neurobiol. 2013. PMID: 24093610 Review.
-
Peripheral nerve injuries, pain, and neuroplasticity.J Hand Ther. 2018 Apr-Jun;31(2):184-194. doi: 10.1016/j.jht.2018.01.011. J Hand Ther. 2018. PMID: 29706196 Review.
Cited by
-
Differentiating Lumbar Spinal Etiology from Peripheral Plexopathies.Biomedicines. 2023 Mar 2;11(3):756. doi: 10.3390/biomedicines11030756. Biomedicines. 2023. PMID: 36979737 Free PMC article. Review.
-
Exercise as a promising alternative for sciatic nerve injury pain relief: a meta-analysis.Front Neurol. 2024 Jul 31;15:1424050. doi: 10.3389/fneur.2024.1424050. eCollection 2024. Front Neurol. 2024. PMID: 39144705 Free PMC article.
-
Adenosine A2A receptor activation is necessary to gate the TrkB-dependent intramuscular nerve sprouting during muscle reinnervation after a nerve crush.Heliyon. 2024 Dec 24;11(1):e41441. doi: 10.1016/j.heliyon.2024.e41441. eCollection 2025 Jan 15. Heliyon. 2024. PMID: 39839513 Free PMC article.
-
Role of Exercise on Neuropathic Pain in Preclinical Models: Perspectives for Neuroglia.Mol Neurobiol. 2025 Mar;62(3):3684-3696. doi: 10.1007/s12035-024-04511-y. Epub 2024 Sep 24. Mol Neurobiol. 2025. PMID: 39316356 Review.
-
Research progress in different physical therapies for treating peripheral nerve injuries.Front Neurol. 2025 Apr 7;16:1508604. doi: 10.3389/fneur.2025.1508604. eCollection 2025. Front Neurol. 2025. PMID: 40260135 Free PMC article. Review.
References
-
- Almeida C., DeMaman A., Kusuda R., et al. Exercise therapy normalizes BDNF upregulation and glial hyperactivity in a mouse model of neuropathic pain. Pain. 2015;156(3):504–513. - PubMed
-
- Asensio-Pinilla E., Udina E., Jaramillo J., et al. Electrical stimulation combined with exercise increase axonal regeneration after peripheral nerve injury. Exp. Neurol. 2009;219(1):258–265. - PubMed
Grants and funding
LinkOut - more resources
Full Text Sources
Miscellaneous
