

Electrophysiological differences and similarities in audiovisual speech processing in CI users with unilateral and bilateral hearing loss
- PMID: 36405629
- PMCID: PMC9672392
- DOI: 10.1016/j.crneur.2022.100059
Electrophysiological differences and similarities in audiovisual speech processing in CI users with unilateral and bilateral hearing loss
Abstract
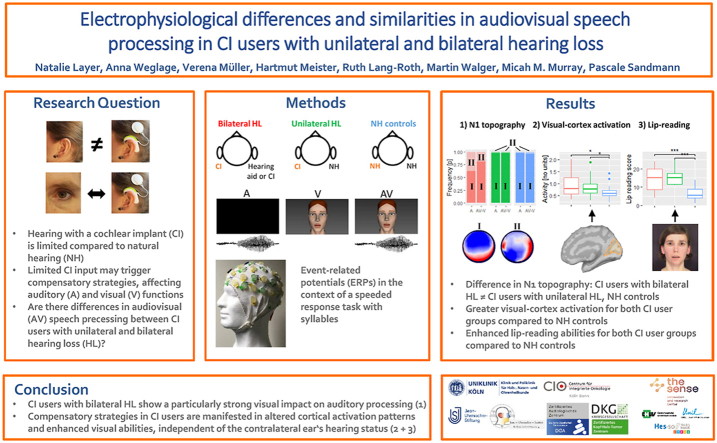
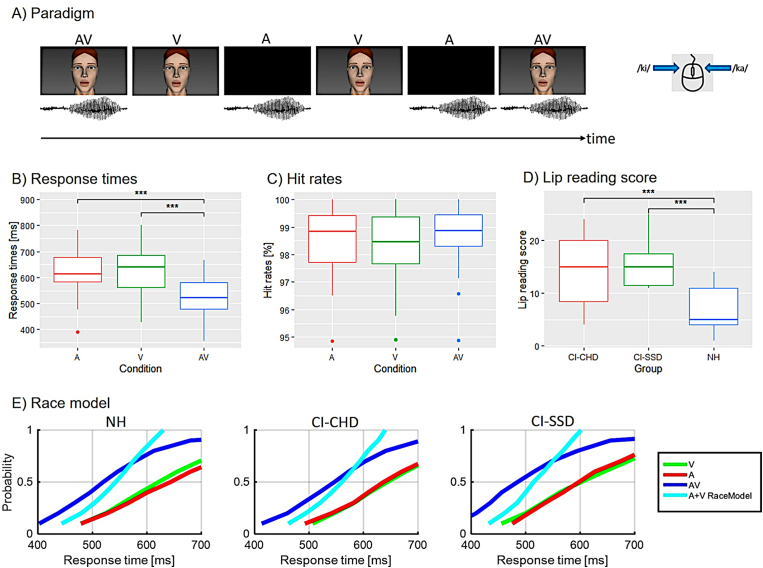
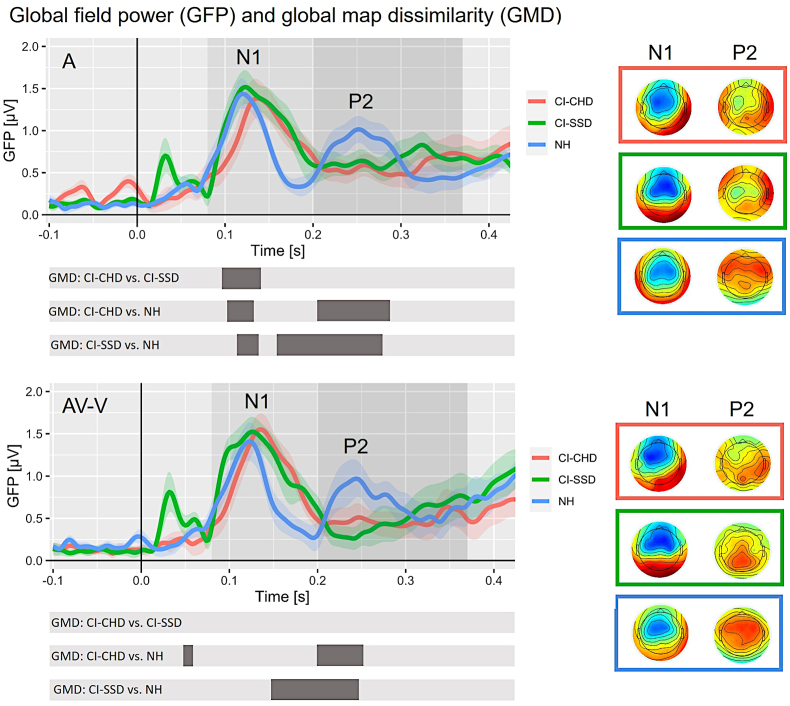
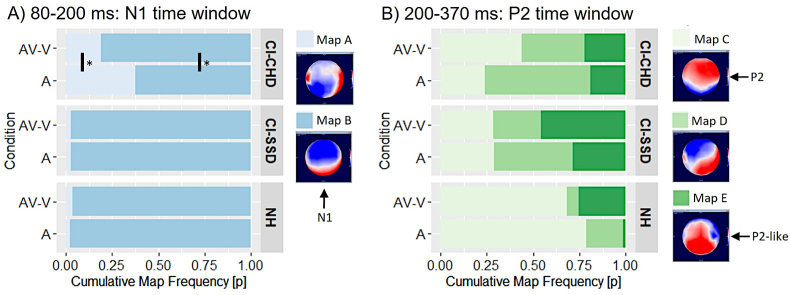
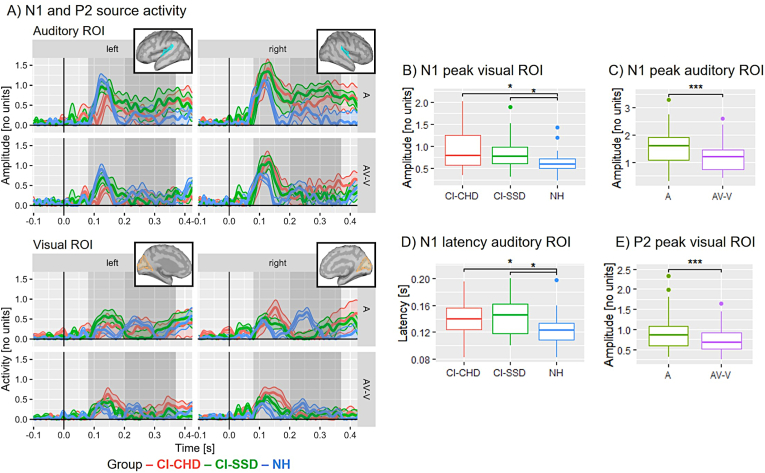
Hearing with a cochlear implant (CI) is limited compared to natural hearing. Although CI users may develop compensatory strategies, it is currently unknown whether these extend from auditory to visual functions, and whether compensatory strategies vary between different CI user groups. To better understand the experience-dependent contributions to multisensory plasticity in audiovisual speech perception, the current event-related potential (ERP) study presented syllables in auditory, visual, and audiovisual conditions to CI users with unilateral or bilateral hearing loss, as well as to normal-hearing (NH) controls. Behavioural results revealed shorter audiovisual response times compared to unisensory conditions for all groups. Multisensory integration was confirmed by electrical neuroimaging, including topographic and ERP source analysis, showing a visual modulation of the auditory-cortex response at N1 and P2 latency. However, CI users with bilateral hearing loss showed a distinct pattern of N1 topography, indicating a stronger visual impact on auditory speech processing compared to CI users with unilateral hearing loss and NH listeners. Furthermore, both CI user groups showed a delayed auditory-cortex activation and an additional recruitment of the visual cortex, and a better lip-reading ability compared to NH listeners. In sum, these results extend previous findings by showing distinct multisensory processes not only between NH listeners and CI users in general, but even between CI users with unilateral and bilateral hearing loss. However, the comparably enhanced lip-reading ability and visual-cortex activation in both CI user groups suggest that these visual improvements are evident regardless of the hearing status of the contralateral ear.
Keywords: Audiovisual speech perception; Bilateral hearing loss; Cochlear implant; Cortical plasticity; Event-related potential; Multisensory integration; Single-sided-deafness.
© 2022 The Authors.
Conflict of interest statement
The authors declare that they have no known competing financial interests or personal relationships that could have appeared to influence the work reported in this paper.
Figures
Similar articles
-
The timecourse of multisensory speech processing in unilaterally stimulated cochlear implant users revealed by ERPs.Neuroimage Clin. 2022;34:102982. doi: 10.1016/j.nicl.2022.102982. Epub 2022 Mar 4. Neuroimage Clin. 2022. PMID: 35303598 Free PMC article.
-
Changes in visually and auditory attended audiovisual speech processing in cochlear implant users: A longitudinal ERP study.Hear Res. 2024 Jun;447:109023. doi: 10.1016/j.heares.2024.109023. Epub 2024 Apr 27. Hear Res. 2024. PMID: 38733710
-
Age effects on cognitive functions and speech-in-noise processing: An event-related potential study with cochlear-implant users and normal-hearing listeners.Front Neurosci. 2022 Dec 22;16:1005859. doi: 10.3389/fnins.2022.1005859. eCollection 2022. Front Neurosci. 2022. PMID: 36620447 Free PMC article.
-
Multisensory Integration in Cochlear Implant Recipients.Ear Hear. 2017 Sep/Oct;38(5):521-538. doi: 10.1097/AUD.0000000000000435. Ear Hear. 2017. PMID: 28399064 Free PMC article. Review.
-
Cortical reorganization in postlingually deaf cochlear implant users: Intra-modal and cross-modal considerations.Hear Res. 2017 Jan;343:128-137. doi: 10.1016/j.heares.2016.07.005. Epub 2016 Jul 26. Hear Res. 2017. PMID: 27473503 Review.
Cited by
-
Cross-Modal Plasticity in Postlingual Hearing Loss Predicts Speech Perception Outcomes After Cochlear Implantation.J Clin Med. 2024 Nov 21;13(23):7016. doi: 10.3390/jcm13237016. J Clin Med. 2024. PMID: 39685477 Free PMC article.
References
-
- Allen J.B., Hall J., Jeng P. Loudness growth in 1/2-octave bands (LGOB)—a procedure for the assessment of loudness. J. Acoust. Soc. Am. 1990;88(2):745–753. - PubMed
-
- Arndt S., Aschendorff A., Laszig R., Beck R., Schild C., Kroeger S., Ihorst G., Wesarg T. Comparison of pseudobinaural hearing to real binaural hearing rehabilitation after cochlear implantation in patients with unilateral deafness and tinnitus. Otol. Neurotol. 2011;32(1):39–47. - PubMed
-
- Arndt S., Laszig R., Aschendorff A., Hassepass F., Beck R., Wesarg T. Cochleaimplantatversorgung bei einseitiger Taubheit oder asymmetrischem Hörverlust. HNO. 2017;65(7):586–598. - PubMed
-
- Barth D.S., Goldberg N., Brett B., Di S. The spatiotemporal organization of auditory, visual, and auditory-visual evoked potentials in rat cortex. Brain Res. 1995;678(1–2):177–190. - PubMed
LinkOut - more resources
Full Text Sources
