. 2022 Nov 2:13:1037318.
doi: 10.3389/fimmu.2022.1037318. eCollection 2022.

Identification of diagnostic genes for both Alzheimer's disease and Metabolic syndrome by the machine learning algorithm

Affiliations

Identification of diagnostic genes for both Alzheimer's disease and Metabolic syndrome by the machine learning algorithm

Jinwei Li et al. Front Immunol. .

Abstract

Background: Alzheimer's disease is the most common neurodegenerative disease worldwide. Metabolic syndrome is the most common metabolic and endocrine disease in the elderly. Some studies have suggested a possible association between MetS and AD, but few studied genes that have a co-diagnostic role in both diseases.

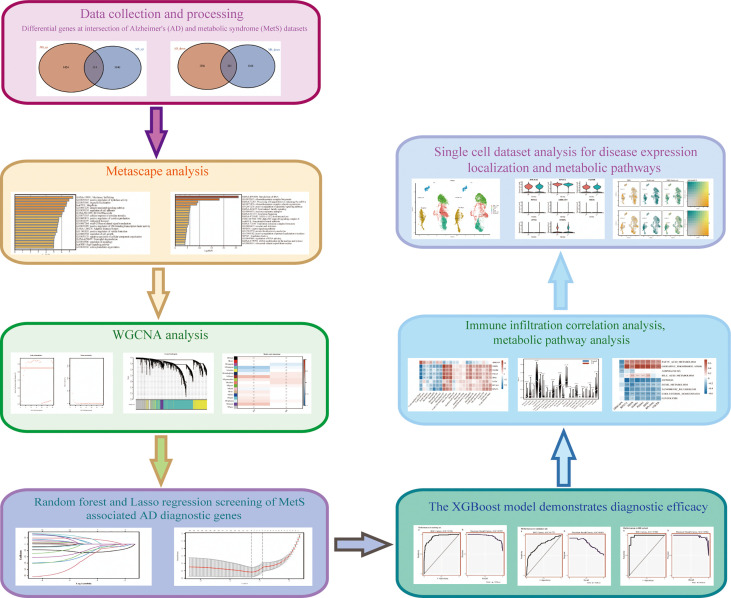
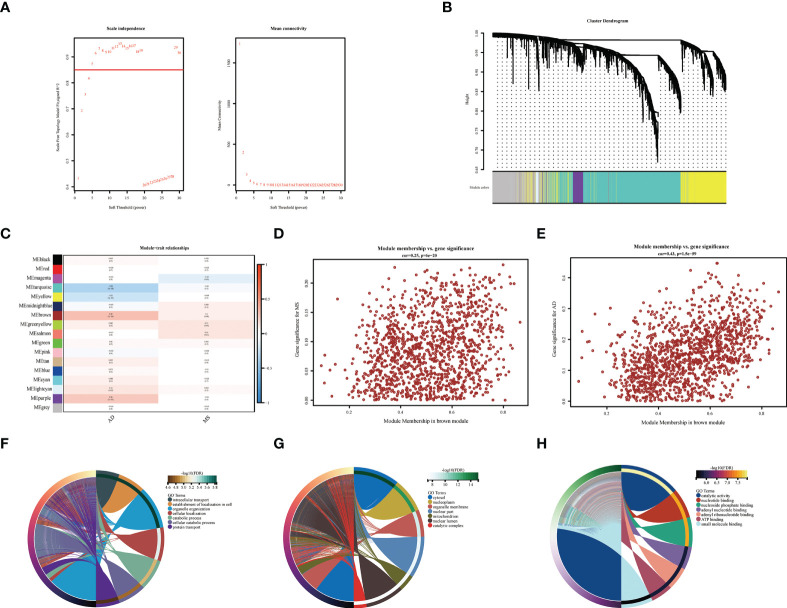
Methods: The microarray data of AD (GSE63060 and GSE63061 were merged after the batch effect was removed) and MetS (GSE98895) in the GEO database were downloaded. The WGCNA was used to identify the co-expression modules related to AD and MetS. RF and LASSO were used to identify the candidate genes. Machine learning XGBoost improves the diagnostic effect of hub gene in AD and MetS. The CIBERSORT algorithm was performed to assess immune cell infiltration MetS and AD samples and to investigate the relationship between biomarkers and infiltrating immune cells. The peripheral blood mononuclear cells (PBMCs) single-cell RNA (scRNA) sequencing data from patients with AD and normal individuals were visualized with the Seurat standard flow dimension reduction clustering the metabolic pathway activity changes each cell with ssGSEA.

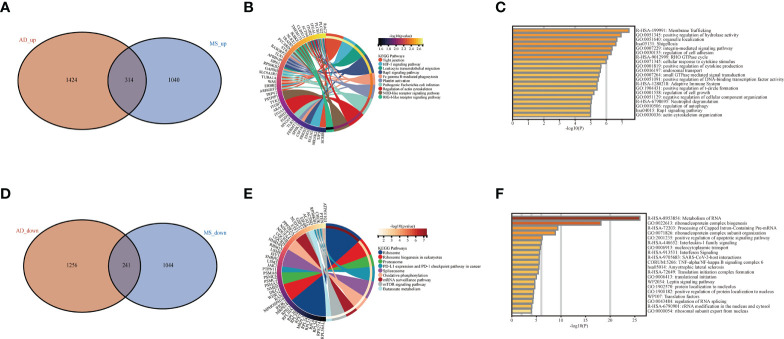
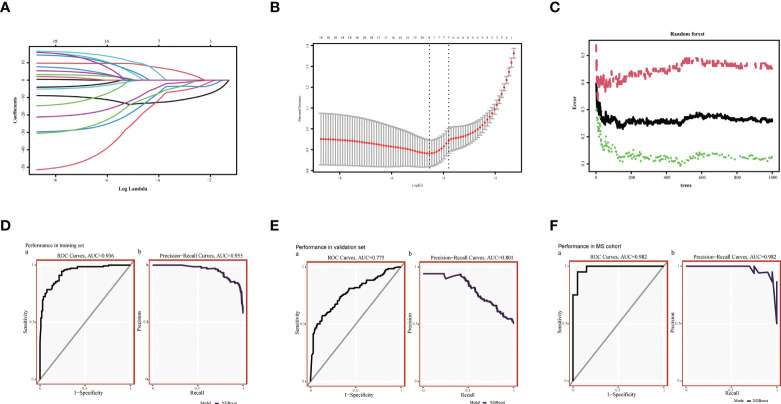
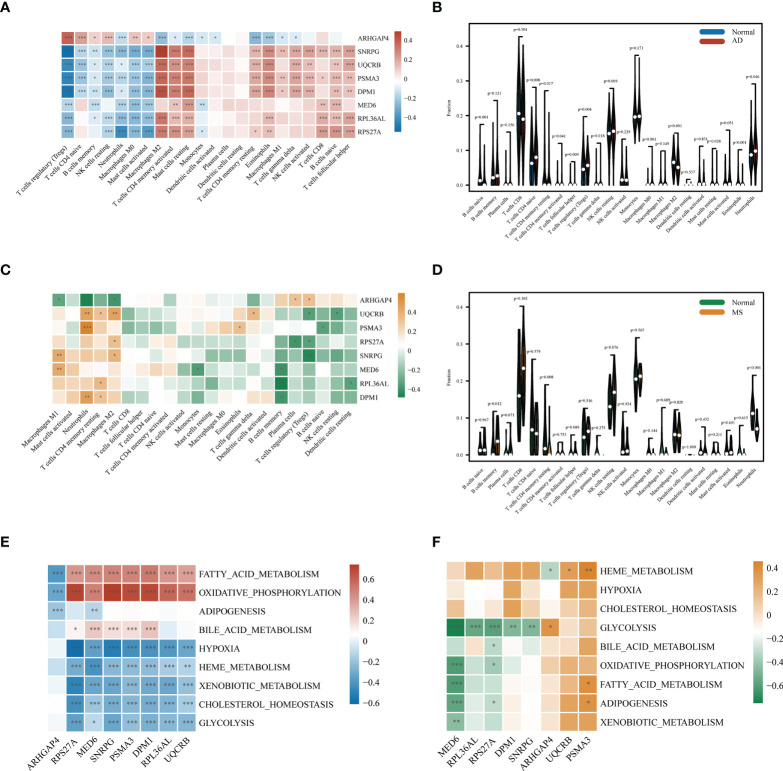
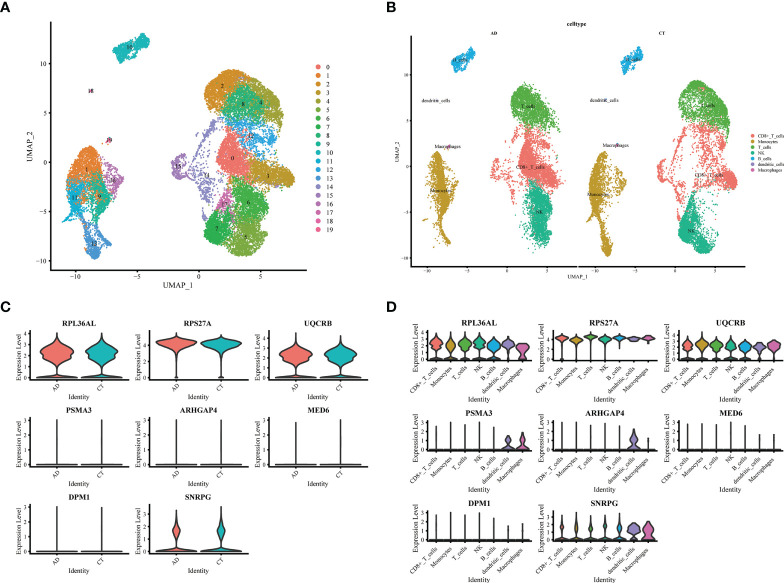
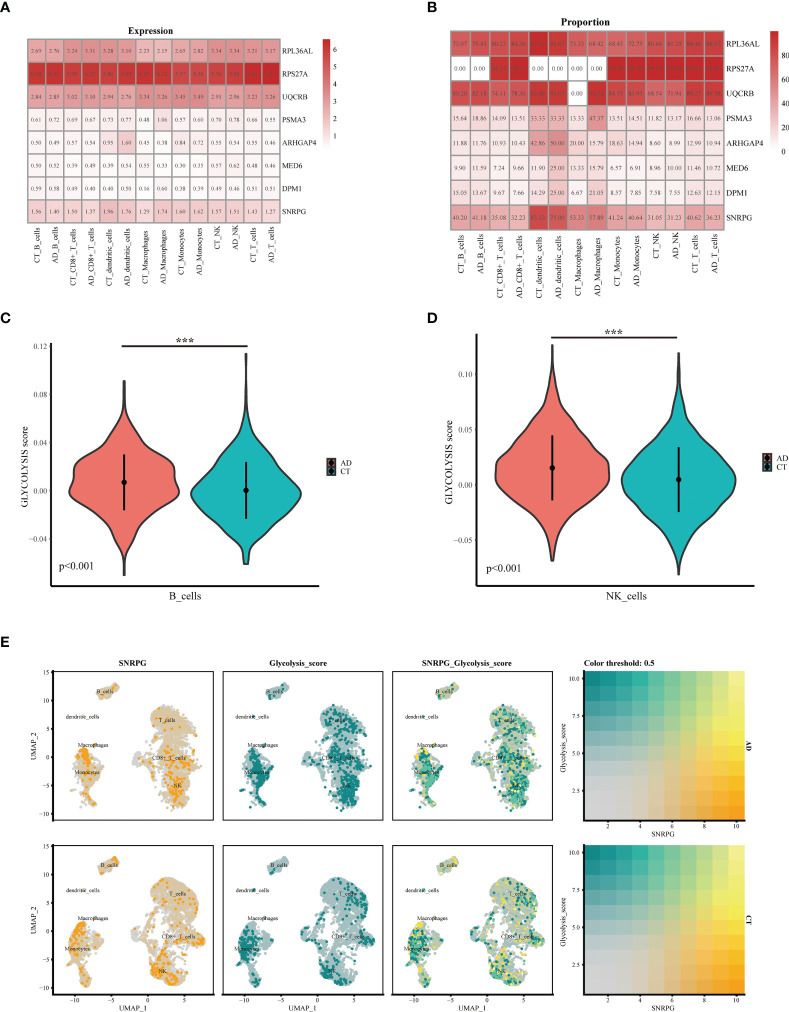
Results: The brown module was identified as the significant module with AD and MetS. GO analysis of shared genes showed that intracellular transport and establishment of localization in cell and organelle organization were enriched in the pathophysiology of AD and MetS. By using RF and Lasso learning methods, we finally obtained eight diagnostic genes, namely ARHGAP4, SNRPG, UQCRB, PSMA3, DPM1, MED6, RPL36AL and RPS27A. Their AUC were all greater than 0.7. Higher immune cell infiltrations expressions were found in the two diseases and were positively linked to the characteristic genes. The scRNA-seq datasets finally obtained seven cell clusters. Seven major cell types including CD8 T cell, monocytes, T cells, NK cell, B cells, dendritic cells and macrophages were clustered according to immune cell markers. The ssGSEA revealed that immune-related gene (SNRPG) was significantly regulated in the glycolysis-metabolic pathway.

Conclusion: We identified genes with common diagnostic effects on both MetS and AD, and found genes involved in multiple metabolic pathways associated with various immune cells.

Keywords: Alzheimer’s disease; XGBost; immune infiltration; machine learning algorithm; metabolic syndrome; single cell sequencing.


Conflict of interest statement

The authors declare that the research was conducted in the absence of any commercial or financial relationships that could be construed as a potential conflict of interest.

Figures

Figure 1
Figure 1
Research technology flow chart.
Figure 2
Figure 2
Difference and enrichment analysis of AD and MS patients. (A) The intersection of AD up-regulated DEGs and MetS up-regulated DEGs. (B) KEGG analysis of up-regulated intersection genes. (C) GO analysis of up-regulated intersection genes. (D) The intersection of AD down-regulated DEGs and MetS down-regulated DEGs. (E) KEGG analysis of down-regulated intersection genes. (F) GO analysis of down-regulated intersection genes.
Figure 3
Figure 3
WGCNA co-expression and enrichment analysis in AD and MS patients. (A) Analysis of network topology for various soft-thresholding powers. (B) The cluster dendrogram of co-expression genes in AD and MetS. (C) Module–trait relationships in AD and MetS. Each cell contains the corresponding correlation and p-value. (D) The correlation between genes and AD in the brown module. (E) The correlation between genes and MetS in the brown module. (F) The BP in GO analysis of co-expression genes in AD and MetS. (G) The CC in GO analysis of co-expression genes in AD and MetS. (H) The MF in GO analysis of co-expression genes in AD and MetS.
Figure 4
Figure 4
Machine Learning Screening Genes and Modeling. (A) LASSO coefficient profiles of candidate genes. (B) Cross-validation to select the optimal tuning parameter log (Lambda) in LASSO regression analysis. (C) RF coefficient profiles of candidate genes. (D) XGBost modeling in AD training set. (E) Validate through the AD validation set. (F) Validate with MetS dataset.
Figure 5
Figure 5
Correlation of AD and MS patients with immune cells and metabolic signaling pathways. (A) Immune infiltration analysis of eight candidate genes in AD. (B) Comparison of immune cell infiltration between AD and CT samples. (C) Immune infiltration analysis of eight candidate genes in MetS. (D) Comparison of immune cell infiltration between MetS and CT samples. (E) Metabolic pathway analysis of eight candidate genes in AD. (F) Metabolic pathway analysis of eight candidate genes in MetS. *P < 0.05, **P < 0.01, ***P <0.001.
Figure 6
Figure 6
Expression of 8 model genes in immune subsets of AD and normal patients. (A) UMAP display of single cell grouping in patients with AD. (B) AD and normal patients are divided into 7 immune cell subsets. (C) Violin pictures show the expression of model genes in normal and AD patients. (D) The violin picture shows the expression of model genes in immune cells.
Figure 7
Figure 7
Expression and co-localization of key genes in immune cells of AD patients. (A, B) Expression of different genes in immune cells of AD and normal patients. (C) The violin shows the difference in the fraction of glucose metabolism in B cells between normal patients and AD patients. (D) The violin shows the difference in the fraction of glucose metabolism in NK cells between normal patients and AD patients. (E) Colocalization of glucose metabolism and SNRPG in AD patients and normal patients, respectively. ***p<0.001.

Similar articles

Cited by

References

    1. Aisen P, Jimenez-Maggiora G, Rafii M, Walter S, Raman R. Early-stage Alzheimer disease: getting trial-ready. Nat Rev Neurol (2022) 18:389–99. doi: 10.1038/s41582-022-00645-6 - DOI - PMC - PubMed
    1. Pugazhenthi S. Metabolic syndrome and the cellular phase of alzheimer’s disease. Prog Mol Biol Trans Sci (2017) 146:243–58. doi: 10.1016/bs.pmbts.2016.12.016 - DOI - PubMed
    1. Aguilar M, Bhuket T, Torres S, Liu B, Wong R. Prevalence of the metabolic syndrome in the united states, 2003-2012. JAMA (2015) 313:1973–4. doi: 10.1001/jama.2015.4260 - DOI - PubMed
    1. Nelson L, Gard P, Tabet N. Hypertension and inflammation in alzheimer’s disease: close partners in disease development and progression! J Alzheimer’s Dis: JAD (2014) 41:331–43. doi: 10.3233/JAD-140024 - DOI - PubMed
    1. Solomon A, Kivipelto M, Wolozin B, Zhou J, Whitmer R. Midlife serum cholesterol and increased risk of alzheimer’s and vascular dementia three decades later. Dementia Geriatric Cogn Disord (2009) 28:75–80. doi: 10.1159/000231980 - DOI - PMC - PubMed

Publication types