. 2022 Nov 3:13:993614.
doi: 10.3389/fimmu.2022.993614. eCollection 2022.

Single cell analysis of docosahexaenoic acid suppression of sequential LPS-induced proinflammatory and interferon-regulated gene expression in the macrophage

Affiliations

Single cell analysis of docosahexaenoic acid suppression of sequential LPS-induced proinflammatory and interferon-regulated gene expression in the macrophage

Kathryn A Wierenga et al. Front Immunol. .

Abstract

Preclinical and clinical studies suggest that consumption of long chain omega-3 polyunsaturated fatty acids (PUFAs) reduces severity of chronic inflammatory and autoimmune diseases. While these ameliorative effects are conventionally associated with downregulated expression of proinflammatory cytokine and chemokine genes, our laboratory has recently identified Type 1 interferon (IFN1)-regulated gene expression to be another key target of omega-3 PUFAs. Here we used single cell RNA sequencing (scRNAseq) to gain new mechanistic perspectives on how the omega-3 PUFA docosahexaenoic acid (DHA) influences TLR4-driven proinflammatory and IFN1-regulated gene expression in a novel self-renewing murine fetal liver-derived macrophage (FLM) model. FLMs were cultured with 25 µM DHA or vehicle for 24 h, treated with modest concentration of LPS (20 ng/ml) for 1 and 4 h, and then subjected to scRNAseq using the 10X Chromium System. At 0 h (i.e., in the absence of LPS), DHA increased expression of genes associated with the NRF2 antioxidant response (e.g. Sqstm1, Hmox1, Chchd10) and metal homeostasis (e.g.Mt1, Mt2, Ftl1, Fth1), both of which are consistent with DHA-induced polarization of FLMs to a more anti-inflammatory phenotype. At 1 h post-LPS treatment, DHA inhibited LPS-induced cholesterol synthesis genes (e.g. Scd1, Scd2, Pmvk, Cyp51, Hmgcs1, and Fdps) which potentially could contribute to interference with TLR4-mediated inflammatory signaling. At 4 h post-LPS treatment, LPS-treated FLMs reflected a more robust inflammatory response including upregulation of proinflammatory cytokine (e.g. Il1a, Il1b, Tnf) and chemokine (e.g.Ccl2, Ccl3, Ccl4, Ccl7) genes as well as IFN1-regulated genes (e.g. Irf7, Mx1, Oasl1, Ifit1), many of which were suppressed by DHA. Using single-cell regulatory network inference and clustering (SCENIC) to identify gene expression networks, we found DHA modestly downregulated LPS-induced expression of NF-κB-target genes. Importantly, LPS induced a subset of FLMs simultaneously expressing NF-κB- and IRF7/STAT1/STAT2-target genes that were conspicuously absent in DHA-pretreated FLMs. Thus, DHA potently targeted both the NF-κB and the IFN1 responses. Altogether, scRNAseq generated a valuable dataset that provides new insights into multiple overlapping mechanisms by which DHA may transcriptionally or post-transcriptionally regulate LPS-induced proinflammatory and IFN1-driven responses in macrophages.

Keywords: IFN signaling; NF-κB; TLR4 signaling; cholesterol metabolism; inflammatory gene expression; macrophage; omega-3 polyunsaturated fatty acids; scRNAseq.


Conflict of interest statement

The authors declare that the research was conducted in the absence of any commercial or financial relationships that could be construed as a potential conflict of interest.

Figures
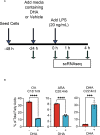
Figure 1
Figure 1
Experimental design for scRNAseq and DHA incorporation into FLMs. (A) FLMs were seeded in 6 well plates at -48 h in mRPMI medium containing 10% FBS. At -24h, medium was replaced with mRPMI containing 0.25% FBS with either DHA or Veh. At time 0 h (24h after DHA supplementation), cells were treated with 20 ng/mL LPS. Sample start times were staggered to allow collection of all samples simultaneously, after the indicated treatment times. (B) DHA supplementation results in increased DHA levels in the phospholipid membrane at the expense of oleic acid and arachidonic acid. Cells treated with DHA or Veh for 24 h were collected in methanol and analyzed by GC-FID at OmegaQuant LLC. Fatty acid levels expressed as a percent of all fatty acids measured. Asterisks indicate significant differences (****p<0.0001, ***p<0.001) between Veh (-) and DHA (+) treatment groups, as assessed by Student’s t-tests.
Figure 2
Figure 2
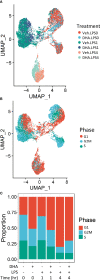
Cells cluster according to the presence and duration of LPS treatment. (A) Uniform manifold approximation and projection (UMAP) clustering revealed 3 distinct clusters of cells representing cells that received no LPS treatment cells treated for 1 h, and cells treated for 4h. (B) Distinct subclusters are present for cells in the G1, S and G2 phases of the cell cycle, as identified by Seurat CellCycleScoring function. (C) Treatment with DHA and with LPS influence the proportion of cells in each phase of the cell cycle.
Figure 3
Figure 3
Self-renewing FLMs consistently express macrophage-specific genes across all times and treatments. Normalized expression values of individual macrophage-specific genes are overlayed on all cells are plotted using the Seurat FeaturePlot function. Macrophage-identifying genes are present in most cells in all time and treatment clusters indicating robustness of the self-renewing FLM model. Gray-scale image on right derived from ( Figure 2A ) indicates timepoints represented in clusters.
Figure 4
Figure 4
DHA influences expression of genes in FLMs involved in lipid uptake/metabolism (Cd36, Plin2, Lipa), antioxidant response (Sqstm1, Hmox1, Chchd10), metal homeostasis (Mt1, Mt2, Ftl1, Fth1) and immune regulation (Ifi202b, Cd300a, Anxa4) at 0h. (A) Differentially expressed genes were identified using the Seurat FindMarkers function, with thresholds set to select genes with >1.5-fold change (Adjusted p-value < 0.001) in gene expression and genes expressed in at least half in the Veh.LPS.0 or DHA.LPS.0 groups. (B) Expression of Hmox1 and Sqstm1, two genes induced by DHA treatment, was confirmed using bulk qPCR of samples treated in parallel with treatments for single cell isolation. Asterisks indicated significant differences *p<0.05) between Veh (-) and DHA (+) groups, as assessed by Student’s t-tests.
Figure 5
Figure 5
Gene expression changes induced by LPS in FLMs at 1 and 4h. (A) Differentially expressed genes (DEGs) were identified using the Seurat FindMarkers function, with thresholds set to select genes with >2-fold change in gene expression and genes expressed in at least half of either group being compared. Venn diagrams of DEGs at 1h only (left circle), 4h only (right circle), and at both timepoints (intersection) were generated to visualize the quantity of DEGs in each group. (B) The Enrichr database was used to identify GO Biological Process terms for the indicated groups of genes. Shown are the five most enriched pathways upregulated by LPS after 1 and 4 h or downregulated by LPS after 4 h, as determined by the size of the adjusted p-value.
Figure 6
Figure 6
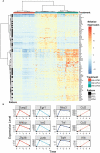
LPS robustly upregulates gene expression in FLMs after 1 and 4h. (A) 500 cells were randomly selected from the Veh.0, Veh.LPS.1, and Veh.LPS.4 groups and genes upregulated >6-fold were used to generate a heatmap using pheatmap with the “ward.d” clustering method. The normalized SCT values were plotted without scaling the heatmap. Cells were annotated according to their treatment group. (B) Plots showing the expression of individual LPS-induced genes at the 0, 1, and 4 h timepoint.
Figure 7
Figure 7
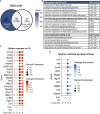
DHA suppresses expression of genes associated with cholesterol metabolism and inflammatory signaling pathways at 1 h post-LPS treatment. (A) Differentially expressed genes (DEGs) were identified by using the Seurat FindMarkers function, with thresholds set to select genes with >1.5-fold change in gene expression and genes expressed in at least 25% of groups being compared. DEGs in the “Down with DHA” circle of the Venn diagram are downregulated in DHA.LPS.1 relative to Veh.LPS.1 and DEGs in the “Up with LPS” circle of the Venn diagram are upregulated in Veh.LPS.1 relative to Veh. The intersection represents LPS-induced genes suppressed by DHA at 1h. (B) 7 of the 11 LPS-induced genes suppressed by DHA involve the cholesterol synthesis pathway. (C) Other LPS-induced genes suppressed by DHA at 1 h are also suppressed by DHA at 4 h.
Figure 8
Figure 8
DHA inhibits inflammatory signaling pathways at 4 h post-LPS treatment. (A) Differentially expressed genes (DEGs) were identified by using the Seurat FindMarkers function, with thresholds set to select genes with >1.5-fold change in gene expression and genes expressed in at least 25% of groups being compared. DEGs in the “Down with DHA” circle of the Venn diagram are downregulated in DHA.LPS.4 relative to Veh.LPS.4 and DEGs in the “Up with LPS” circle of the Venn diagram are upregulated in Veh.LPS.4 relative to Veh. The intersection represents LPS-induced genes suppressed by DHA at 1h. (B) The Enrichr database was used to identify GO Biological Process terms for the indicated groups of genes. Shown are the five most enriched pathways are shown, as determined by the size of the adjusted p-value. (C) Selected input genes enriched in the “Cellular response to LPS” and (D) “Cytokine-mediated signaling pathway” GO terms are depicted using the Seurat DotPlot feature, where the size of the dot indicates the percent of cells expressing the gene and the depth of the dot color indicates the average expression of the gene across the cells in which it is expressed.
Figure 9
Figure 9
DHA suppresses expression of selected IFN1-regulated genes. A panel of IFN1-regulated genes was investigated by bulk qPCR in samples treated with LPS for 1 and 4 h. Cells were pre-treated with DHA or Veh for 24 h prior to LPS treatment. Asterisks indicate significant differences (*p<0.05, **p<0.01) between the DHA and Veh groups, n=3.
Figure 10
Figure 10
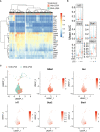
FLMs with high IFN1-regulated gene expression cluster together. (A) Regulon scores for cells in each group were generated using the SCENIC workflow. Regulons were selected that were significantly different between Veh.LPS.4 and DHA.LPS.4. Cells in the Veh.LPS.4 and DHA.LPS.4 treatment groups (as indicated by the horizontal bar above the heatmap) were analyzed for selected regulons. Clustering was performed using Ward’s method in the pheatmap tool in R Studio. The regulon AUC values were directly plotted without scaling the heatmap. (B) Boxplots for regulon scores were generated to identify differences between treatment groups. Irf7, Stat1, Stat2, NF-κB, and Rel regulons were increased by LPS at 4 hr. DHA reduced the regulon scores for NF-κB and Rel regulons and completely suppressed scores for Irf7, Stat1, and Stat2 regulons scores. (C) The Seurat FeaturePlot function was used to color cells from Veh.LPS.4 and DHA.LPS.4 treatment groups according to Irf7, Stat1, Stat2, Rel, and NF-κB1 regulon expression.
Figure 11
Figure 11
IFN1-regulated gene expression at 4 h post-LPS is driven by IRF rather than STAT activity. (A) Ifnar1 and Ifnar2 are homogenously expressed at a high level in the FLMs across the time clusters. (B) A small number of cells express Ifnb (arrow), and it is limited primarily to Veh-treated cells. (C) The majority of the genes identified in the STAT1 and STAT2 regulons are also IRF7 targets. (D) Genes driven by IRF7 alone are more highly expressed than genes driven by either STAT1 or STAT2 alone. Genes are presented using the Seurat DotPlot function, where the size of the dot indicates the percent of cells expressing the gene and the depth of the dot color indicates the average expression of the gene across the cells in which it is expressed.
Figure 12
Figure 12
Putative model for DHA suppression of LPS-induced proinflammatory and IFN1-regulated gene expression in the macrophage. Time-dependent transcriptional changes elicited by DHA and/or LPS reveal multiple potential mechanisms by which DHA may counteract the inflammatory response to LPS. First, at 0 h (in the absence of LPS), DHA triggers expression of NRF2 target genes, which may promote a pro-resolving macrophage phenotype. At 1 h following LPS exposure, DHA suppresses LPS-triggered cholesterol genes, which may prevent cholesterol-mediated facilitation of further TLR4 signaling. At 4h following LPS exposure, DHA downregulates NF-κB-target and IFN1-regulated gene (IRGs) including IFN-β, likely preventing robust induction of further IFN-response at ≥ 4h.

Similar articles

Cited by

References

    1. Murray PJ. Macrophage polarization. Annu Rev Physiol (2017) 79(1):541–66. doi: 10.1146/annurev-physiol-022516-034339 - DOI - PubMed
    1. Yang S, Yuan HQ, Hao YM, Ren Z, Qu SL, Liu LS, et al. . Macrophage polarization in atherosclerosis. Clin Chim Acta (2020) 501:142–6. doi: 10.1016/j.cca.2019.10.034 - DOI - PubMed
    1. Lumeng CN, Bodzin JL, Saltiel AR. Obesity induces a phenotypic switch in adipose tissue macrophage polarization. J Clin Invest (2007) 117(1):175–84. doi: 10.1172/JCI29881 - DOI - PMC - PubMed
    1. Udalova IA, Mantovani A, Feldmann M. Macrophage heterogeneity in the context of rheumatoid arthritis. Nat Rev Rheum (2016) 12(8):472–85. doi: 10.1038/nrrheum.2016.91 - DOI - PubMed
    1. Herrada AA, Escobedo N, Iruretagoyena M, Valenzuela RA, Burgos PI, Cuitino L, et al. . Innate immune cells’ contribution to systemic lupus erythematosus. Front Immunol (2019) 10:772. doi: 10.3389/fimmu.2019.00772 - DOI - PMC - PubMed

Publication types