. 2022 Nov 3:13:1021928.
doi: 10.3389/fimmu.2022.1021928. eCollection 2022.

Differential effects of age, sex and dexamethasone therapy on ACE2/TMPRSS2 expression and susceptibility to SARS-CoV-2 infection

Affiliations

Differential effects of age, sex and dexamethasone therapy on ACE2/TMPRSS2 expression and susceptibility to SARS-CoV-2 infection

Shima Shahbaz et al. Front Immunol. .

Abstract

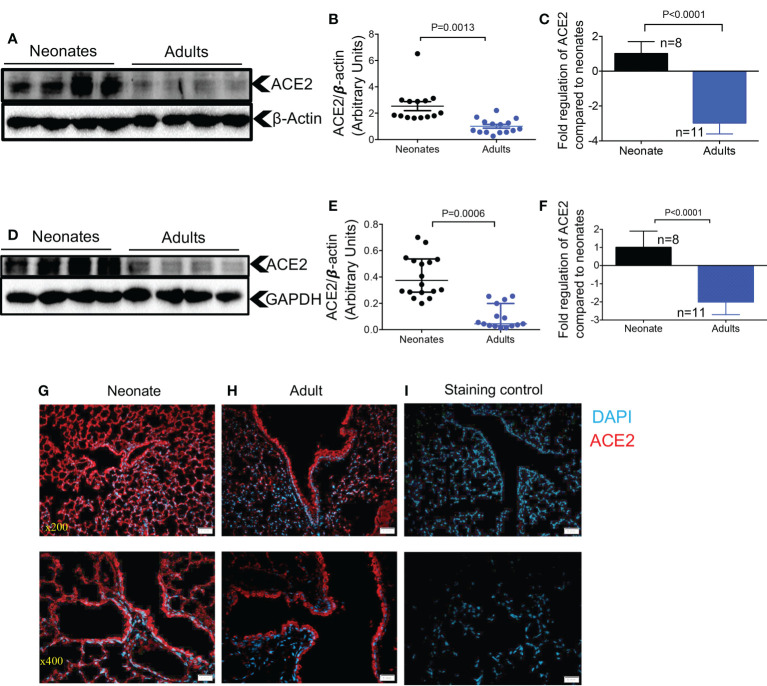
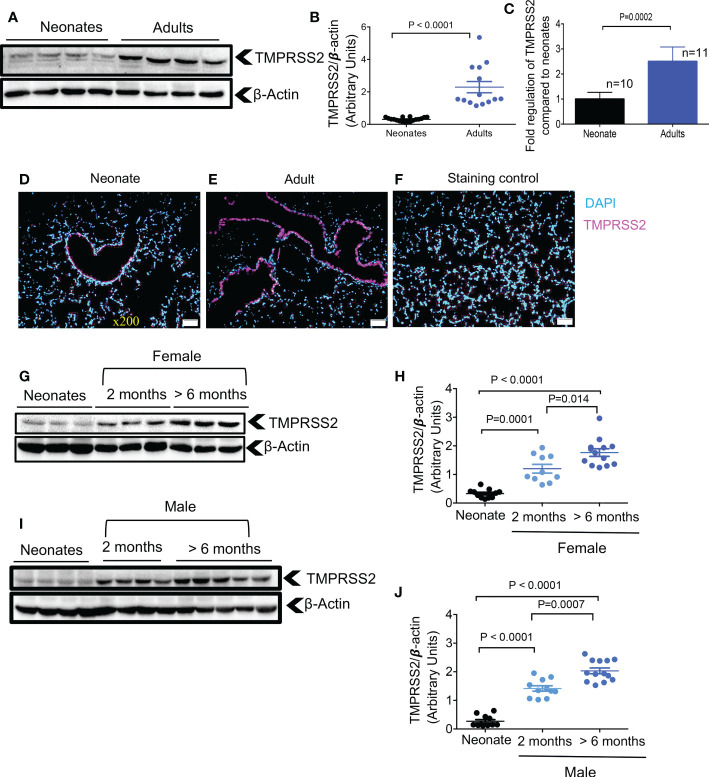
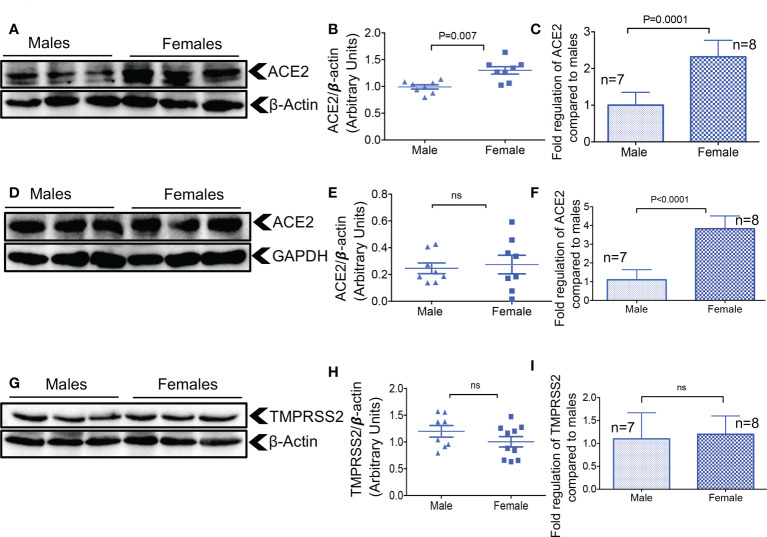
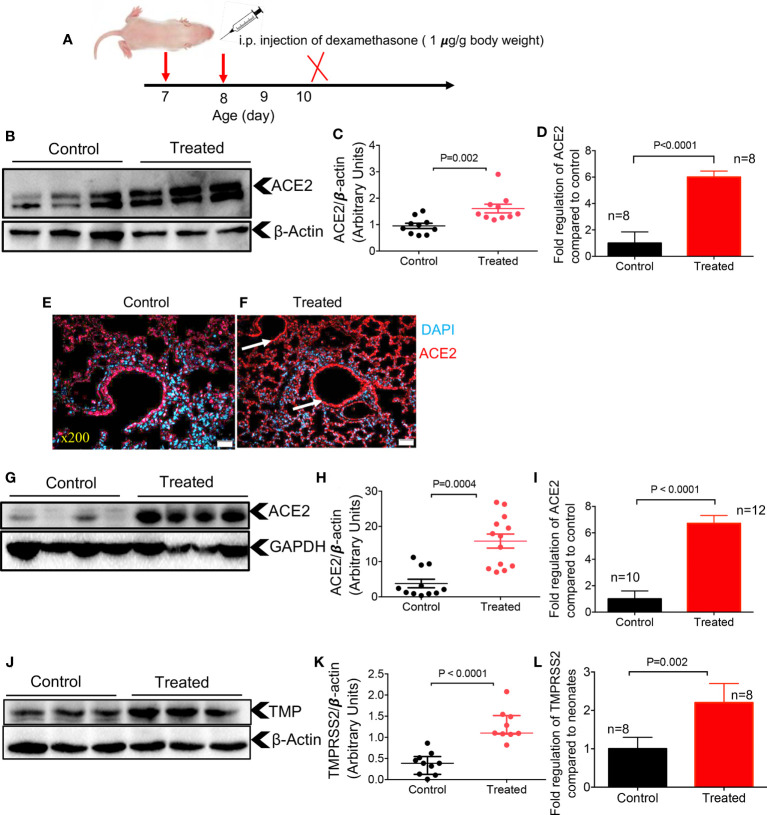
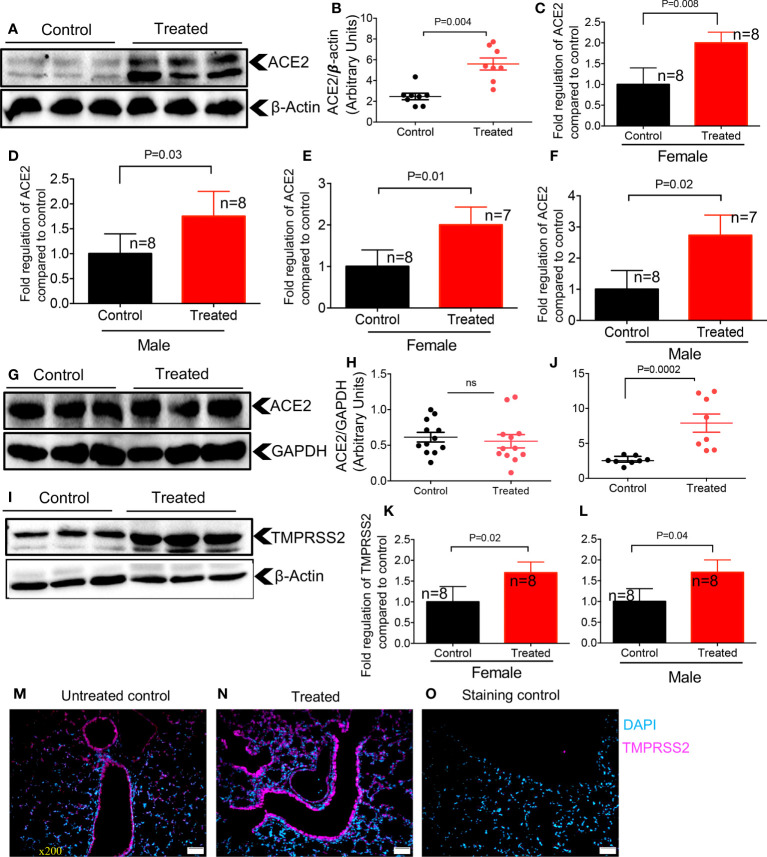
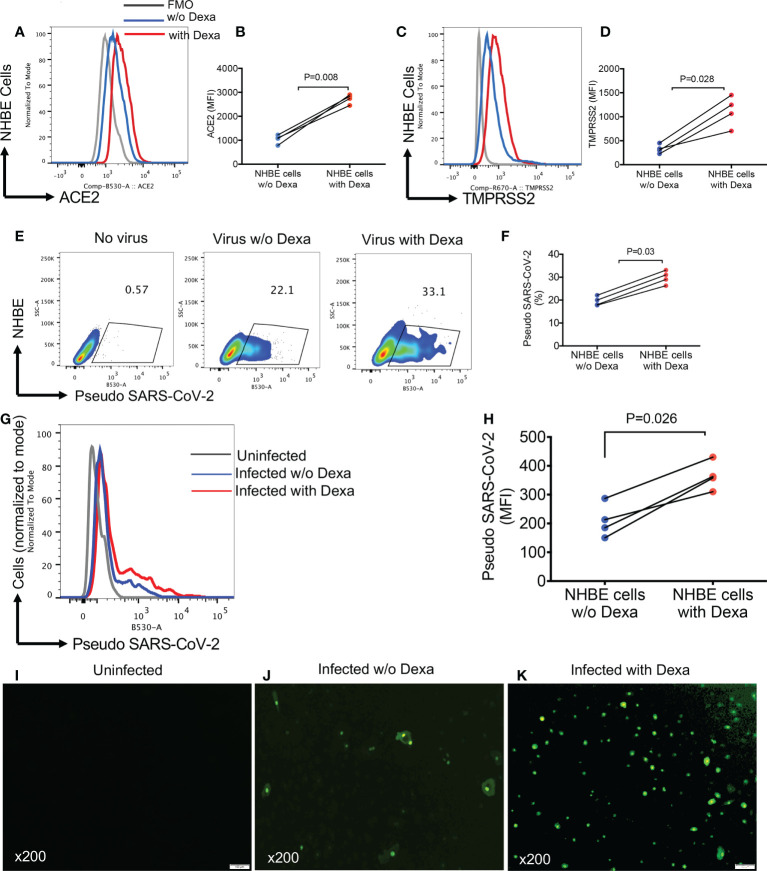
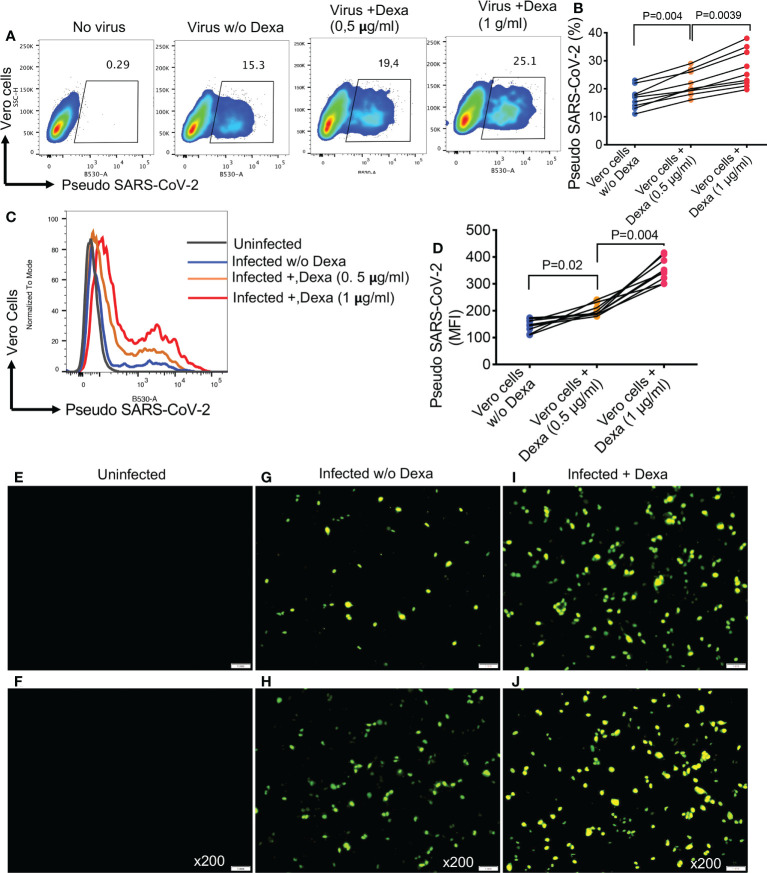
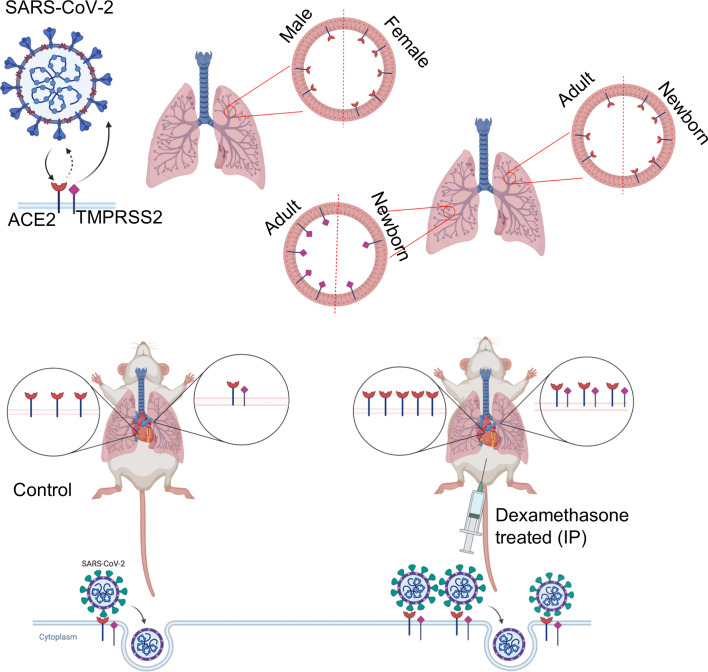
ACE2 and TMPRSS2 are crucial for SARS-CoV-2 entry into the cell. Although ACE2 facilitates viral entry, its loss leads to promoting the devastating clinical symptoms of COVID-19 disease. Thus, enhanced ACE2/TMPRSS2 expression is likely to increase predisposition of target cells to SARS-CoV-2 infection. However, little evidence existed about the biological kinetics of these two enzymes and whether dexamethasone treatment modulates their expression. Here, we show that the expression of ACE2 at the protein and mRNA levels was significantly higher in the lung and heart tissues of neonatal compared to adult mice. However, the expression of TMPRSS2 was developmentally regulated. Our results may introduce a novel concept for the reduced susceptibility of the young to SARS-CoV-2 infection. Moreover, ACE2 expression but not TMPRSS2 was upregulated in adult female lungs compared to their male counterparts. Interestingly, the ACE2 and TMPRSS2 expressions were upregulated by dexamethasone treatment in the lung and heart tissues in both neonatal and adult mice. Furthermore, our findings provide a novel mechanism for the observed differential therapeutic effects of dexamethasone in COVID-19 patients. As such, dexamethasone exhibits different therapeutic effects depending on the disease stage. This was supported by increased ACE2/TMPRSS2 expression and subsequently enhanced infection of normal human bronchial epithelial cells (NHBE) and Vero E6 cells with SARS-CoV-2 once pre-treated with dexamethasone. Therefore, our results suggest that individuals who take dexamethasone for other clinical conditions may become more prone to SARS-CoV-2 infection.

Keywords: ACE2; COVID-19; TMPRSS2; age; dexamethasone; sex.


Conflict of interest statement

The authors declare that the research was conducted in the absence of any commercial or financial relationships that could be construed as a potential conflict of interest.

Figures

Figure 1
Figure 1
Differential expression of ACE2 and TMPRSS2 in the lung and heart tissues of neonatal compared to adult mice. (A) Representative western immunoblots, and (B) cumulative data of ACE2 protein in the lung tissues of neonatal (1-week-old) versus adult mice (> 6 months). (C) Cumulative data showing fold regulation of ACE2 mRNA in the lung tissues of neonatal versus adult mice (> 6 months). (D) Representative western immunoblots, and (E) cumulative data of ACE2 in the heart tissues of neonatal versus adult mice (> 6 months). (F) Cumulative data showing fold regulation of ACE2 mRNA in the heart tissues of neonatal versus adult mice (> 6 months). (G) Representative immunofluorescence (IF) images of ACE2 expression in the lung tissue of a neonatal mouse, and (H) an adult mouse (5 sections/tissue, n= >3/group). (I) IF image of the lung section stained with the secondary antibody as control. Scale bar: 100 μm. Magnification x200 and x400. Sample size (n) is shown for each group. All blots were repeated for reproducibility and lanes were loaded with equal amounts of protein. Quantification of ACE2 (97 KDa) and TMPRSS2 (54 KDa) normalised to the loading control. Error bars indicate mean ± SEM from more than two independent experiments. Each dot represents data from an animal.
Figure 2
Figure 2
Developmental regulation of TMPRSS2 in the lung tissues of mice. (A) Representative western immunoblots, and (B) cumulative data of TMPRSS2 protein in the lung tissues of neonatal versus adult mice (> 6 months). (C) Cumulative data showing fold regulation of TMPRSS2 mRNA in the lung tissues of neonatal versus adult mice (> 6 months). (D) Representative immunofluorescence (IF) images of TMPRSS2 expression in the lung tissue of a neonatal mouse, and (E) an adult mouse (5 sections/tissue, n= >3/group). (F) IF image of the lung section stained with the secondary antibody as control. Scale bar: 100 μm. Magnification x200. (G) Representative western immunoblots, and (H) cumulative data of TMPRSS2 protein in the lung tissues of neonatal (8 days old), young adults (2 months) versus older adult (> 6 months) female mice. (I) Representative western immunoblots, and (J) cumulative data of TMPRSS2 protein in the lung tissues of neonatal, young adults (2 months) versus older adult (> 6 months) male mice. All blots were repeated for reproducibility and lanes were loaded with equal amounts of protein. Quantification of ACE2 and TMPRSS2 normalised to the loading control. Error bars indicate mean ± SEM from at least three independent experiments.
Figure 3
Figure 3
Elevated ACE2 at the gene and protein levels in the lungs of female mice. (A) Representative western immunoblots, and (B) cumulative data of ACE2 protein in the lung tissues of adult male and female mice. (C) Cumulative data showing fold regulation of ACE2 mRNA in the lung tissues of male versus female adult mice. (D) Representative western immunoblots, and (E) cumulative data of ACE2 protein in the heart tissues of adult male and female mice. (F) Cumulative data showing fold regulation of ACE2 mRNA in the heart tissues of male versus female adult mice. (G) Representative western immunoblots, and (H) cumulative data of TMPRSS2 protein in the lung tissues of male versus female older adult mice. (I) Cumulative data showing fold regulation of TMPRSS2 mRNA in the lung tissues of male versus female adult mice. All blots were repeated for reproducibility and lanes were loaded with equal amounts of protein. Quantification of ACE2 and TMPRSS2 normalised to the loading control. Error bars indicate mean ± SEM from at least two independent experiments. ns, Not significant.
Figure 4
Figure 4
Dexamethasone upregulates the expression of ACE2 and TMPRSS2 in the tissues of neonatal mice. (A) Dexamethasone treatment strategy. (B) Representative western immunoblots, and (C) cumulative data of ACE2 protein in the lung tissues of neonatal mice treated with dexamethasone (IP, 1 μg/g body weight for two consecutive days) versus those treated with PBS (control). (D) Cumulative data showing fold regulation of ACE2 mRNA in the lung tissues of treated neonates versus control. (E) Representative immunofluorescence (IF) images of ACE2 expression in the lung tissue of a control versus (F) dexamethasone treated neonatal mouse (5 sections/tissue, n= >3/group). Scale bar: 100 μm. Magnification x200. (G) Representative western immunoblots, and (H) cumulative data of ACE2 protein in the heart tissues of control versus dexamethasone treated neonatal mice (I) Cumulative data showing fold regulation of ACE2 mRNA in the heart tissues of neonatal mice treated with dexamethasone compared to controls. (J) Representative western immunoblots, and (K) cumulative data of TMPRSS2 (TMP) protein in the lung tissues of control versus dexamethasone treated neonatal mice (L) Cumulative data showing fold regulation of TMPRSS2 mRNA in the lung tissues of neonatal mice treated with dexamethasone compared to controls. All blots were repeated for reproducibility and lanes were loaded with equal amounts of protein. Quantification of ACE2 and TMPRSS2 normalised to the loading control. Error bars indicate mean ± SEM from more than three independent experiments.
Figure 5
Figure 5
Dexamethasone upregulates the expression of ACE2 and TMPRSS2 in the lung and heart tissues of adult mice. (A) Representative western immunoblots, and (B) cumulative data of ACE2 protein in the lung tissues of adult mice (> 6 months) treated with dexamethasone (IP, 1 μg/g body weight for two consecutive days) versus those treated with PBS (control). (C) Cumulative data showing fold regulation of ACE2 mRNA in the lung tissues of treated male, and (D) female versus control mice. (E) Cumulative data showing fold regulation of ACE2 mRNA in the heart tissues of treated male, and (F) female versus control mice. (G) Representative western immunoblots, and (H) cumulative data of ACE2 protein in the heart tissues of adult mice (> 6 months) treated with dexamethasone versus controls. (I) Representative western immunoblots, and (J) cumulative data of TMPRSS2 protein in the lung tissues of adult mice (> 6 months) treated with dexamethasone versus controls. (K) Cumulative data showing fold regulation of YMPRSS2 mRNA in the lung tissues of treated male, and (L) female versus controls. (M) IF images of TMPRSS2 expression in the lung tissue of a control versus (N) dexamethasone treated adult mouse. (O) Stained with the secondary antibody (5 sections/tissue, n= >3/group). Scale bar: 100 μm. Magnification x200. All blots were repeated for reproducibility and lanes were loaded with equal amounts of protein. Quantification of ACE2 and TMPRSS2 normalised to the loading control. Error bars indicate mean ± SEM from more than three independent experiments. ns, Not significant.
Figure 6
Figure 6
Dexamethasone treatment enhances the infectivity of NHBE cells to Pseudo SARS-CoV-2 infection. (A) Representative plots, and (B) cumulative data of ACE2 expression as measured by the mean fluorescence intensity (MFI) in NHBE cells following overnight treatment with (0.5 µg/ml) or without dexamethasone treatment. (C) Representative plots, and (D) cumulative data of TMPRSS2 expression (MFI) in NHBE cells following overnight treatment with (0.5 µg/ml) or without dexamethasone treatment. (E) Representative flow cytometry plots, and (F) cumulative data showing percentages of NHBE cells untreated or treated with dexamethasone (0.5 μg/ml) and infected with the pseudo SARS-CoV-2. (G) Representative flow cytometry histogram plots, and (H) cumulative data showing the intensity [the mean fluorescence intensity (MFI)] of pseudo SARS-CoV-2 infection in NHBE cells untreated or treated with dexamethasone (0.5 μg/ml). (I) Representative image of uninfected NHBE cells. (J) Representative images of dexamethasone untreated but infected NHBE cells with pseudo SARS-CoV-2. (K) Representative images of dexamethasone treated (0.5 µg/ml) and infected NHBE cells with pseudo SARS-CoV-2, magnification x200. Error bars indicate mean ± SEM from at least two independent experiments. Each dot represents results from a single experiment. Dexamethasone (Dexa), w/o (without). Fluorescence minus one (FMO).
Figure 7
Figure 7
Dexamethasone treatment enhances the infectivity of Vero E6 cells to Pseudo SARS-CoV-2 infection. (A) Representative flow cytometry plots, and (B) cumulative data showing percentages of Vero E6 cells untreated or treated with dexamethasone (0.5 μg/ml and 1 μg/ml) and infected with the pseudo SARS-CoV-2. (C) Representative flow cytometry histogram plots, and (D) cumulative data showing the MFI of pseudo SARS-CoV-2 infection in Vero E6 cells untreated or treated with dexamethasone (0.5 μg/ml and 1 μg/ml). (E, F) Representative images of uninfected Vero E6 cells. (G, H) Representative images of dexamethasone untreated but infected Vero E6 cells with pseudo SARS-CoV-2. (I, J) Representative images of dexamethasone treated and infected Vero E6 cells with pseudo SARS-CoV-2, magnification x200. Error bars indicate mean ± SEM from at least two independent experiments. Each dot represents results from a single experiment. Dexamethasone (Dexa), Vero E6 cells (Vero cells), virus (pseudo SARS-CoV-2).
Figure 8
Figure 8
The visual summary of the study.

Similar articles

Cited by

References

    1. Wu ZY, McGoogan JM. Characteristics of and important lessons from the coronavirus disease 2019 (COVID-19) outbreak in China summary of a report of 72 314 cases from the Chinese center for disease control and prevention. Jama-J Am Med Assoc (2020) 323(13):1239–42. doi: 10.1001/jama.2020.2648 - DOI - PubMed
    1. Bialek S, Gierke R, Hughes M, McNamara LA, Pilishvili T, Skoff T, et al. . Coronavirus disease 2019 in children - united states, February 12-April 2, 2020. Mmwr-Morbid Mortal W. (2020) 69(14):422–6. doi: 10.15585/mmwr.mm6914e4 - DOI - PMC - PubMed
    1. Elahi S. Neonatal and children's immune system and COVID-19: Biased immune tolerance versus resistance strategy. J Immunol (2020) 205(8):1990–7. doi: 10.4049/jimmunol.2000710 - DOI - PubMed
    1. Dong YY, Mo X, Hu YB, Qi X, Jiang F, Jiang ZY, et al. . Epidemiology of COVID-19 among children in China. Pediatrics (2020) 145(6). doi: 10.1542/peds.2020-0702 - DOI - PubMed
    1. Fidel PL, Jr., Noverr MC. Could an unrelated live attenuated vaccine serve as a preventive measure to dampen septic inflammation associated with COVID-19 infection? mBio (2020) 11(3):e00907-20. doi: 10.1128/mBio.00907-20 - DOI - PMC - PubMed

Publication types