

A nomogram model based on the number of examined lymph nodes-related signature to predict prognosis and guide clinical therapy in gastric cancer
- PMID: 36405735
- PMCID: PMC9667298
- DOI: 10.3389/fimmu.2022.947802
A nomogram model based on the number of examined lymph nodes-related signature to predict prognosis and guide clinical therapy in gastric cancer
Abstract
Background: Increasing evidence suggests that the number of examined lymph nodes (ELNs) is strongly linked to the survivorship of gastric cancer (GC). The goal of this study was to assess the prognostic implications of the ELNs number and to construct an ELNs-based risk signature and nomogram model to predict overall survival (OS) characteristics in GC patients.
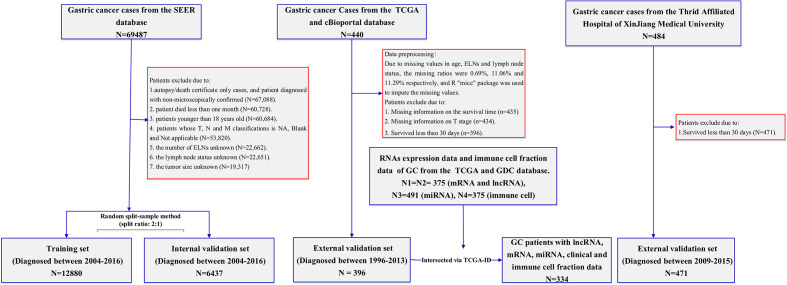
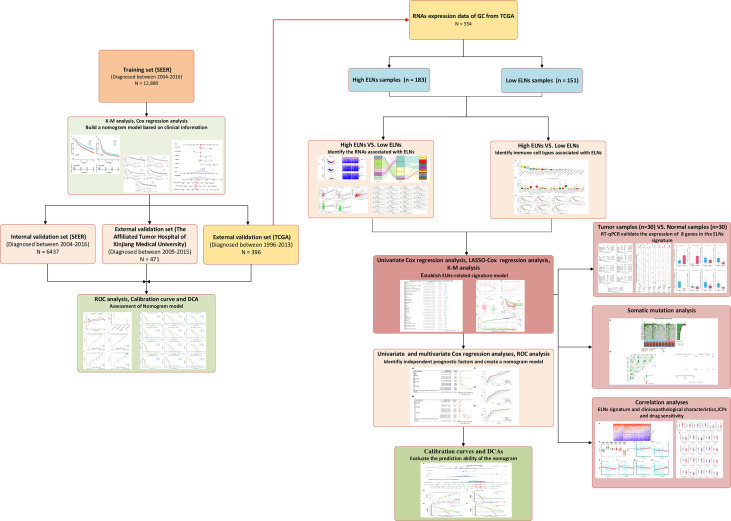
Methods: This inception cohort study included 19,317 GC patients from the U.S. Surveillance, Epidemiology, and End Results (SEER) database, who were separated into a training group and an internal validation group. The nomogram was built with the training set, then internally verified with SEER data, and externally validated with two different data sets. Based on the RNA-seq data, ELNs-related DERNAs (DElncRNAs, DEmiRNAs, andDEmRNAs) and immune cells were identified. The LASSO-Cox regression analysis was utilized to construct ELNs-related DERNAs and immune cell prognostic signature in The Cancer Genome Atlas (TCGA) cohort. The OS of subgroups with high- and low-ELN signature was compared using the Kaplan-Meier (K-M) analysis. A nomogram was successfully constructed based on the ELNs signature and other clinical characteristics. The concordance index (C-index), calibration plot, receiver operating characteristic curve, and decision curve analysis (DCA) were all used to evaluate the nomogram model. The meta-analysis, the Gene Expression Profiling Interactive Analysis database, and reverse transcription-quantitative PCR (RT-qPCR) were utilized to validate the RNA expression or abundance of prognostic genes and immune cells between GC tissues and normal gastric tissues, respectively. Finally, we analyzed the correlations between immune checkpoints, chemotherapy drug sensitivity, and risk score.
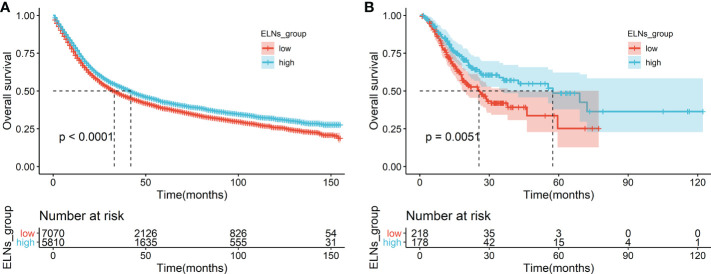
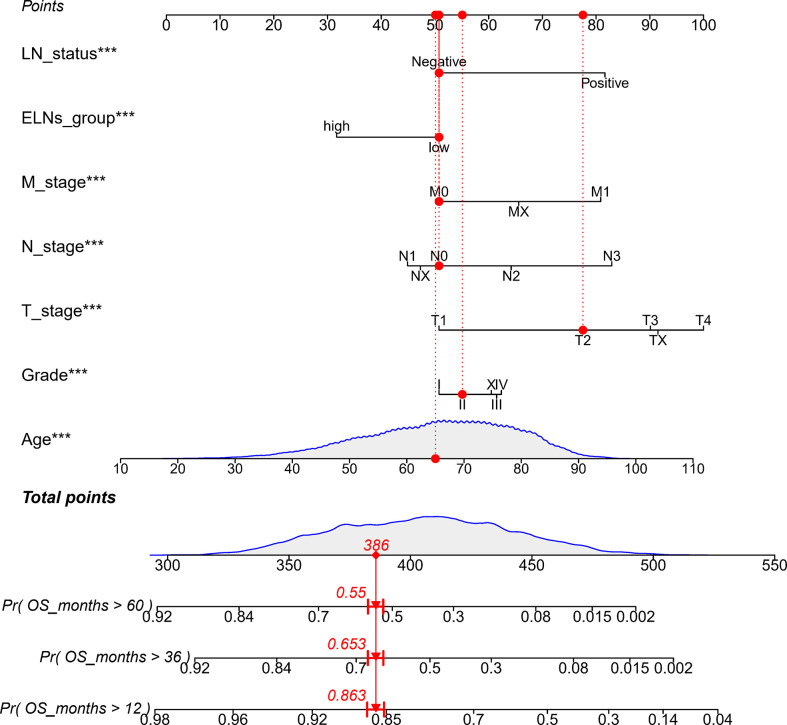
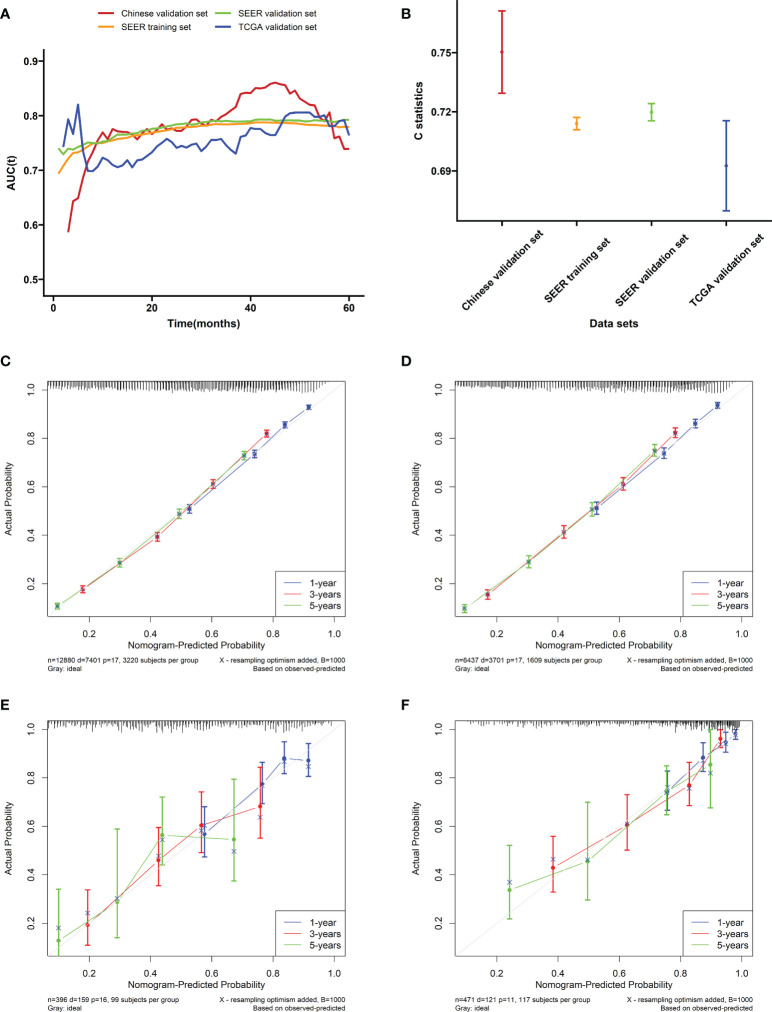
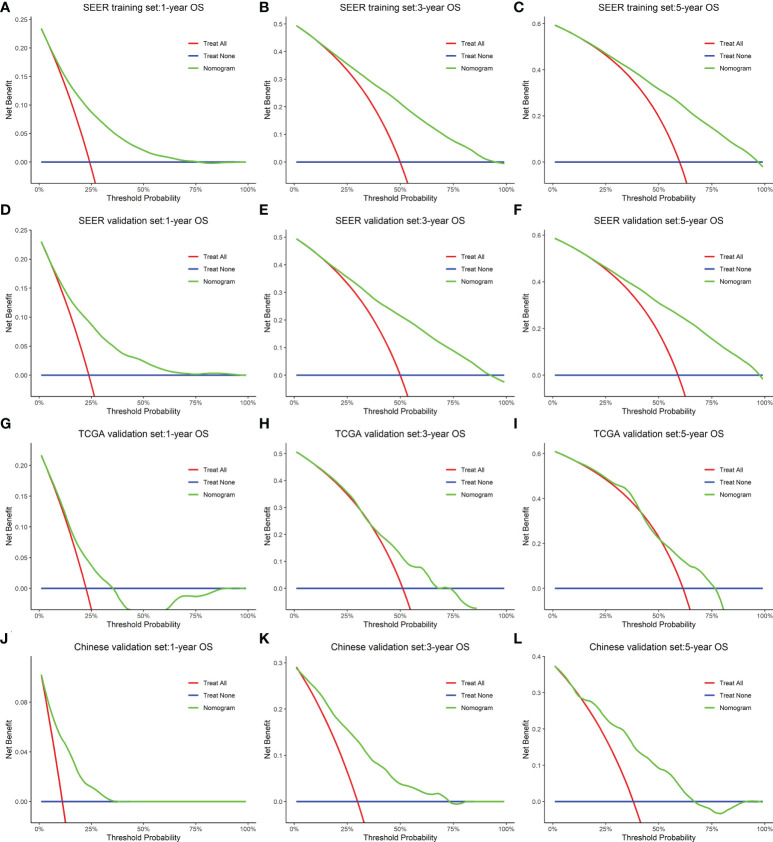
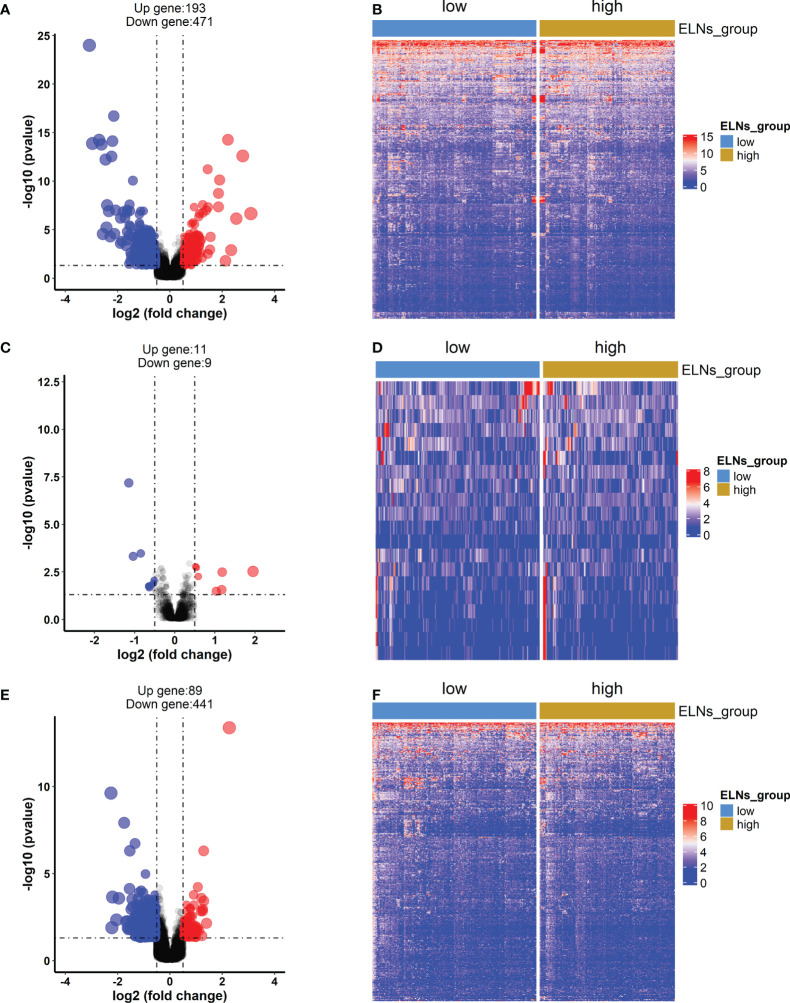
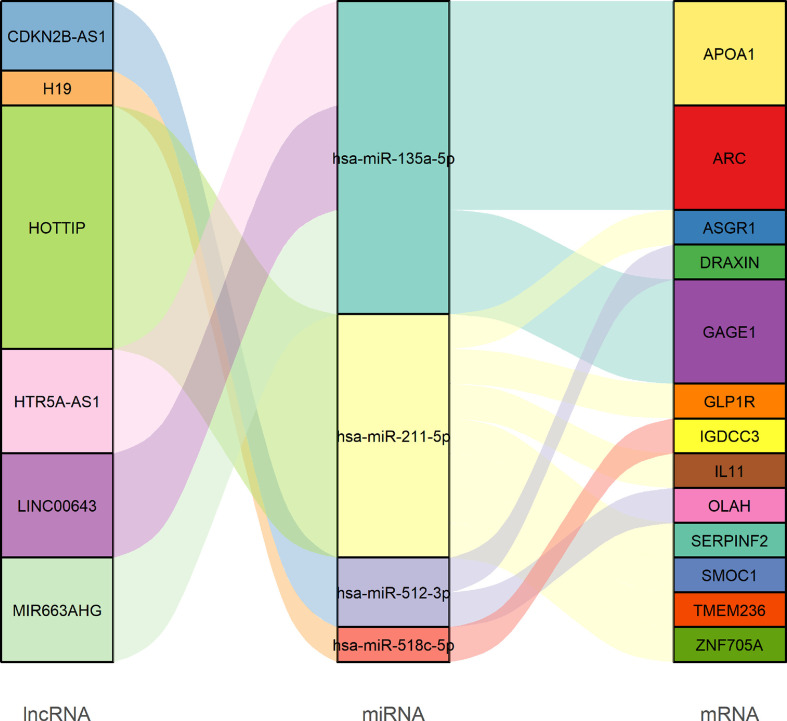
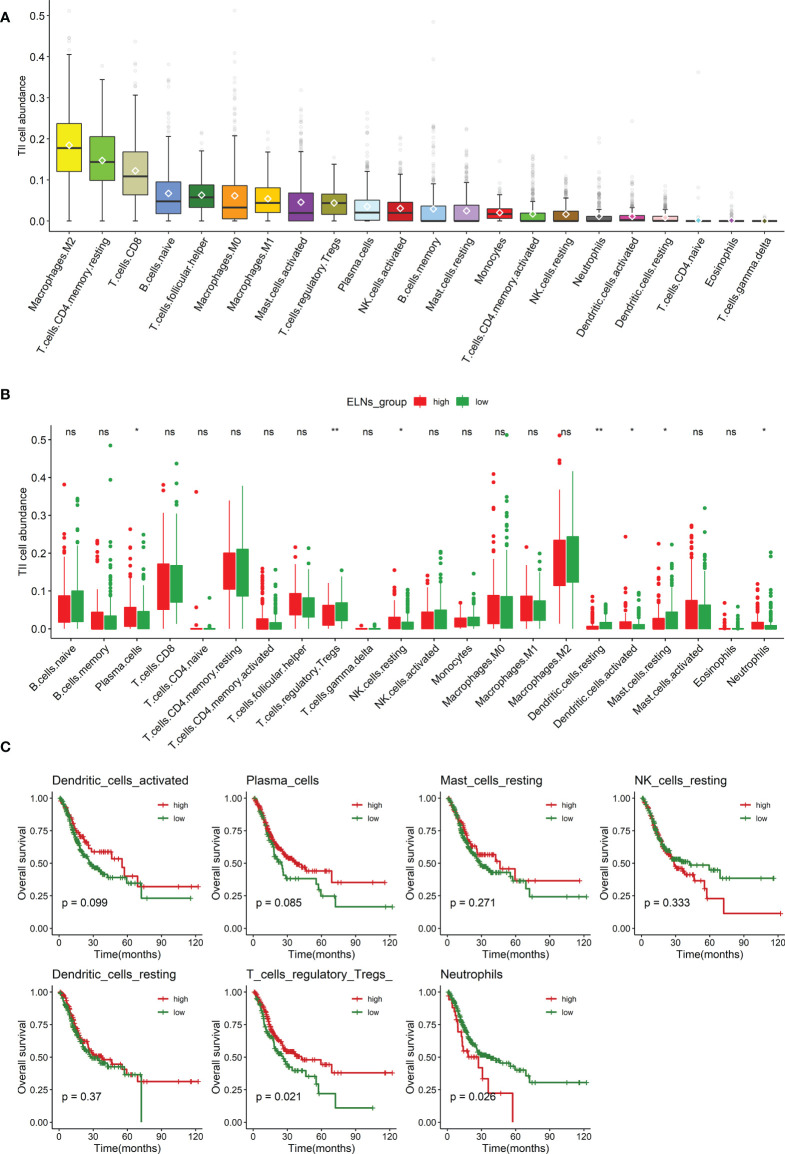
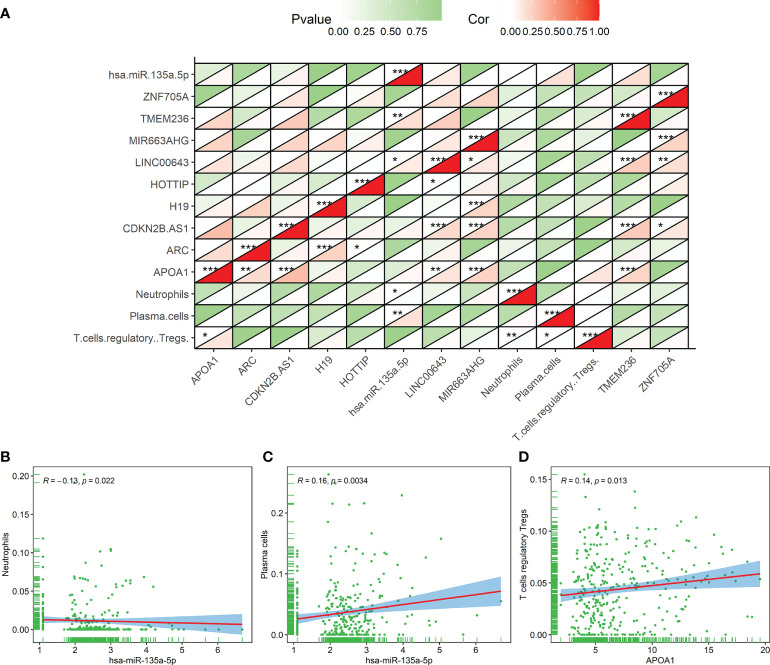
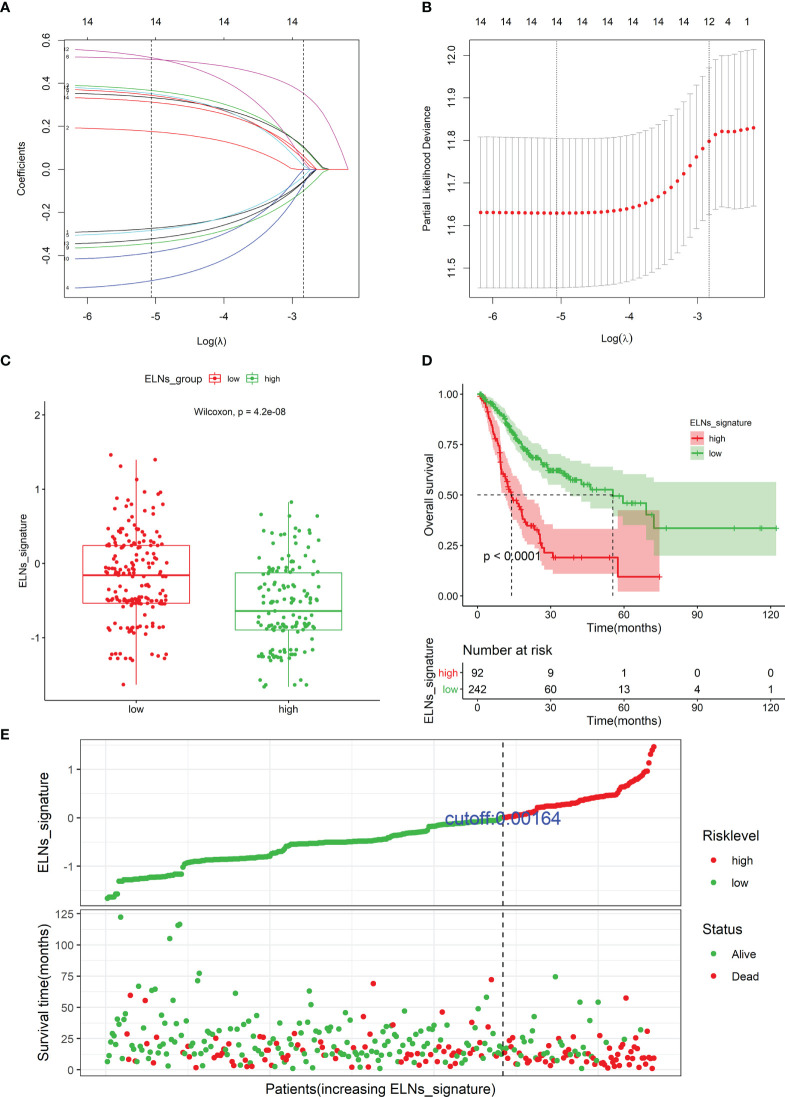
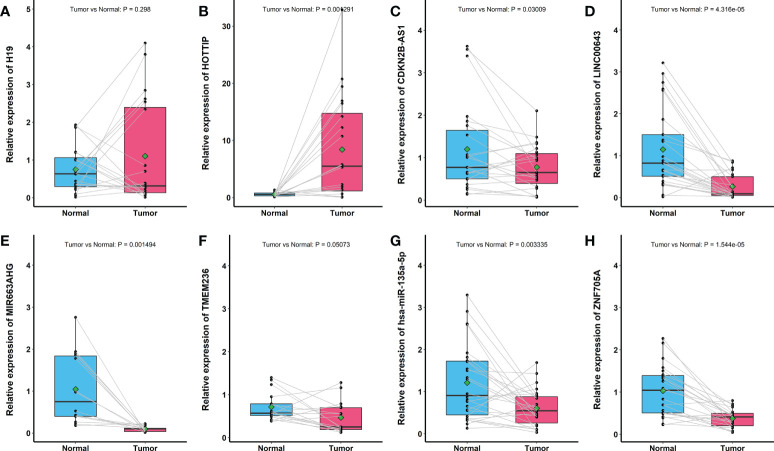
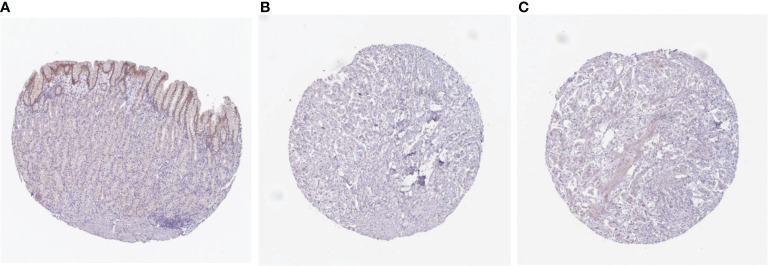
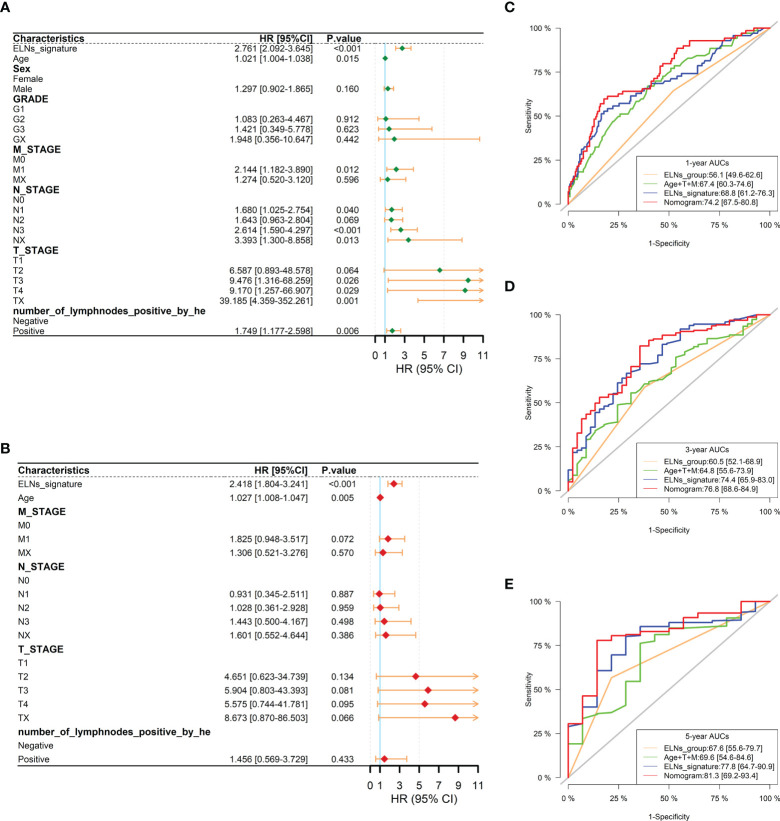
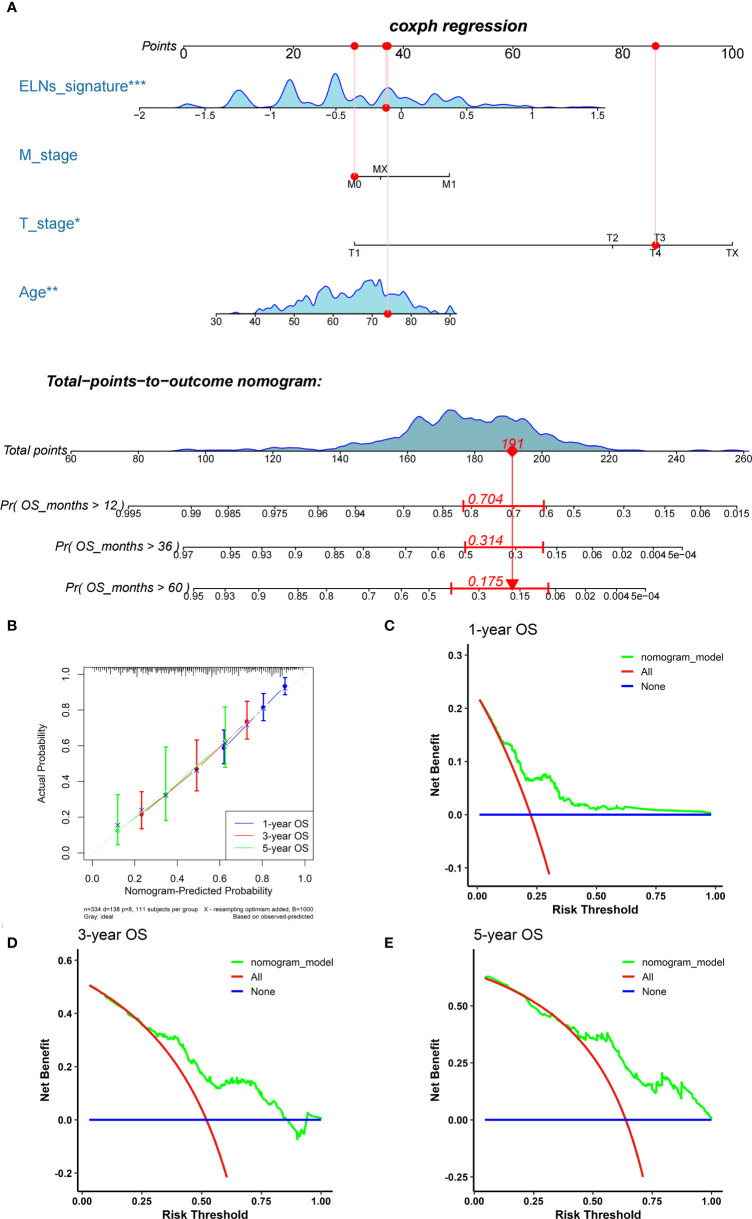
Results: The multivariate analysis revealed that the high ELNs improved OS compared with low ELNs (hazard ratio [HR] = 0.659, 95% confidence interval [CI]: 0.626-0.694, p < 0.0001). Using the training set, a nomogram incorporating ELNs was built and proven to have good calibration and discrimination (C-index [95% CI], 0.714 [0.710-0.718]), which was validated in the internal validation set (C-index [95% CI], 0.720 [0.714-0.726]), the TCGA set (C-index [95% CI], 0.693 [0.662-0.724]), and the Chinese set (C-index [95% CI], 0.750 [0.720-0.782]). An ELNs-related signature model based on ELNs group, regulatory T cells (Tregs), neutrophils, CDKN2B-AS1, H19, HOTTIP, LINC00643, MIR663AHG, TMEM236, ZNF705A, and hsa-miR-135a-5p was constructed by the LASSO-Cox regression analysis. The result showed that OS was remarkably lower in patients with high-ELNs signature compared with those with low-ELN signature (HR = 2.418, 95% CI: 1.804-3.241, p < 0.001). This signature performed well in predicting 1-, 3-, and 5-year survival (AUC [95% CI] = 0.688 [0.612-0.763], 0.744 [0.659-0.830], and 0.778 [0.647-0.909], respectively). The multivariate Cox analysis illustrated that the risk score was an independent predictor of survival for patients with GC. Moreover, the expression of prognostic genes (LINC00643, TMEM236, and hsa-miR-135a-5p) displayed differences between GC tissues and adjacent non-tumor tissues. The C-index of the nomogram that can be used to predict the OS of GC patients was 0.710 (95% CI: 0.663-0.753). Both the calibration plots and DCA showed that the nomogram has good predictive performance. Moreover, the signature was significantly correlated with the N stage and T stage. According to our analysis, GC patients in the low-ELN signature group may have a better immunotherapy response and OS outcome.
Conclusions: We explored the prognostic role of ELNs in GC and successfully constructed an ELNs signature linked to the GC prognosis in TCGA. The findings manifested that the signature is a powerful predictive indicator for patients with GC. The signature might contain potential biomarkers for treatment response prediction for GC patients. Additionally, we identified a novel and robust nomogram combining the characteristics of ELNs and clinical factors for predicting 1-, 3-, and 5-year OS in GC patients, which will facilitate personalized survival prediction and aid clinical decision-making in GC patients.
Keywords: ELNs signature; chemotherapy; gastric cancer (GC); immunotherapy; nomogram; the number of lymph nodes examined (ELNs).
Copyright © 2022 Li, Lin, Yu, Li, Zhao, Hainisayimu, Liu and Wang.
Conflict of interest statement
The authors declare that the research was conducted in the absence of any commercial or financial relationships that could be construed as a potential conflict of interest.
Figures
Similar articles
-
Impact of examined lymph node count on staging and long-term survival of patients with node-negative stage III gastric cancer: a retrospective study using a Chinese multi-institutional registry with Surveillance, Epidemiology, and End Results (SEER) data validation.Ann Transl Med. 2020 Sep;8(17):1075. doi: 10.21037/atm-20-1358a. Ann Transl Med. 2020. PMID: 33145294 Free PMC article.
-
The log odds of negative lymph nodes/T stage: a new prognostic and predictive tool for resected gastric cancer patients.J Cancer Res Clin Oncol. 2021 Aug;147(8):2259-2269. doi: 10.1007/s00432-021-03654-y. Epub 2021 May 18. J Cancer Res Clin Oncol. 2021. PMID: 34003367 Free PMC article.
-
Development and Validation of a Prognostic Nomogram for Gastric Cancer Based on DNA Methylation-Driven Differentially Expressed Genes.Int J Biol Sci. 2020 Feb 10;16(7):1153-1165. doi: 10.7150/ijbs.41587. eCollection 2020. Int J Biol Sci. 2020. PMID: 32174791 Free PMC article.
-
Prognostic nomogram and risk factors for predicting survival in patients with pT2N0M0 esophageal squamous carcinoma.Sci Rep. 2023 Mar 26;13(1):4931. doi: 10.1038/s41598-023-32171-w. Sci Rep. 2023. PMID: 36967413 Free PMC article. Review.
-
Analysis of prognostic factors of metastatic endometrial cancer based on surveillance, epidemiology, and end results database.Front Surg. 2023 Jan 6;9:1001791. doi: 10.3389/fsurg.2022.1001791. eCollection 2022. Front Surg. 2023. PMID: 36684133 Free PMC article. Review.
Cited by
-
Effect of carbon nanoparticle suspension injection versus indocyanine green tracer in guiding lymph node dissection during radical gastrectomy (FUTURE-01): a randomized clinical trial.Int J Surg. 2025 Jan 1;111(1):609-616. doi: 10.1097/JS9.0000000000001873. Int J Surg. 2025. PMID: 38954670 Free PMC article. Clinical Trial.
-
Development of a prognostic nomogram and risk factor analysis for survival in H. pylori-positive non-cardia gastric adenocarcinoma patients.Transl Cancer Res. 2025 May 30;14(5):2822-2834. doi: 10.21037/tcr-24-1776. Epub 2025 May 26. Transl Cancer Res. 2025. PMID: 40530114 Free PMC article.
-
Establishment of a prognostic model for gastric cancer patients who underwent radical gastrectomy using machine learning: a two-center study.Front Oncol. 2024 Apr 11;13:1282042. doi: 10.3389/fonc.2023.1282042. eCollection 2023. Front Oncol. 2024. PMID: 38665864 Free PMC article.
-
Collagen signature adds prognostically significant information to staging for breast cancer.ESMO Open. 2024 Dec;9(12):103990. doi: 10.1016/j.esmoop.2024.103990. Epub 2024 Nov 21. ESMO Open. 2024. PMID: 39577107 Free PMC article.
-
Prognostic value of circulating tumor cells associated with white blood cells in solid cancer: a systematic review and meta-analysis of 1471 patients with solid tumors.BMC Cancer. 2023 Dec 12;23(1):1224. doi: 10.1186/s12885-023-11711-7. BMC Cancer. 2023. PMID: 38087278 Free PMC article.
References
Publication types
MeSH terms
Substances
LinkOut - more resources
Full Text Sources
Medical
Miscellaneous