. 2022 Nov 4:13:1035285.
doi: 10.3389/fimmu.2022.1035285. eCollection 2022.

Identifying hub genes of calcific aortic valve disease and revealing the immune infiltration landscape based on multiple WGCNA and single-cell sequence analysis

Affiliations

Identifying hub genes of calcific aortic valve disease and revealing the immune infiltration landscape based on multiple WGCNA and single-cell sequence analysis

Kan Wang et al. Front Immunol. .

Abstract

Background: Calcific aortic valve disease (CAVD) is a progressive fibrocalcific disease that can be treated only through valve replacement. This study aimed to determine the role of hub genes and immune cell infiltration in CAVD progression.

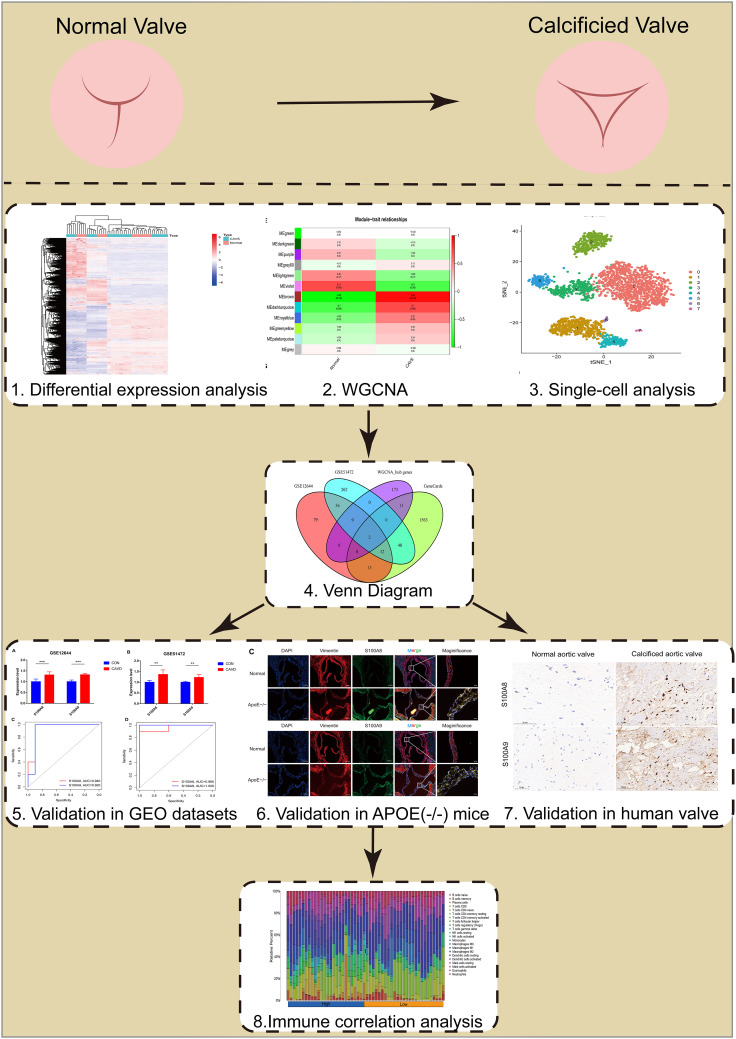
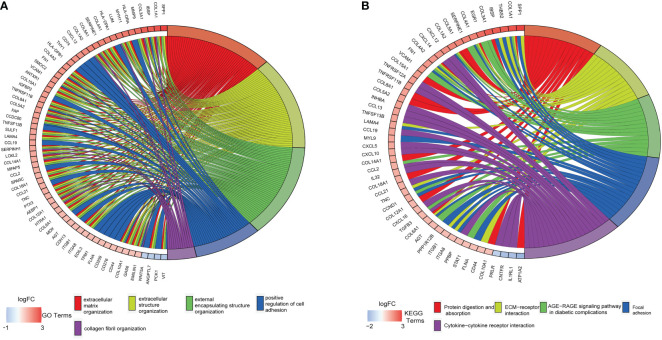
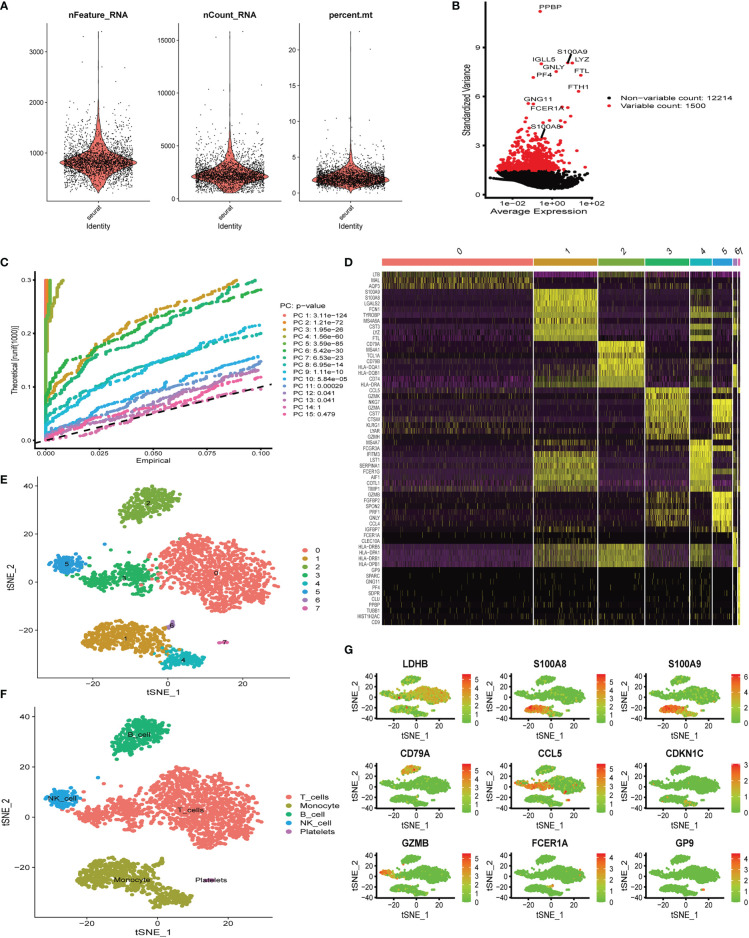
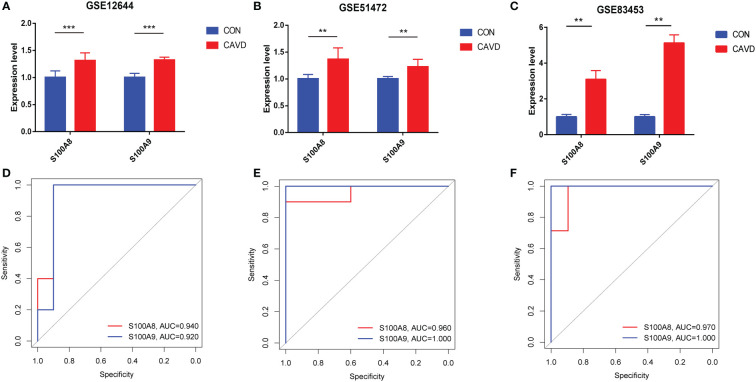
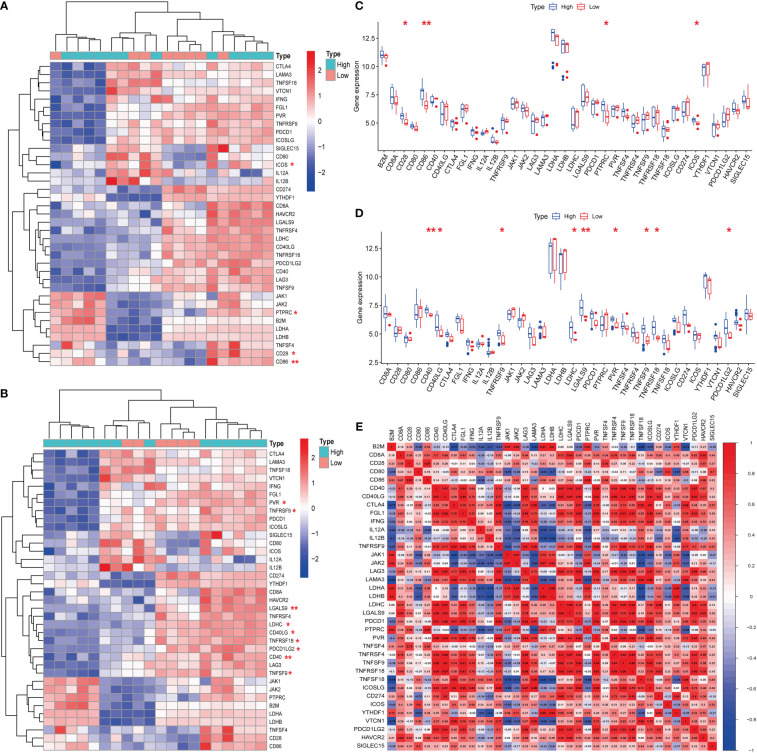
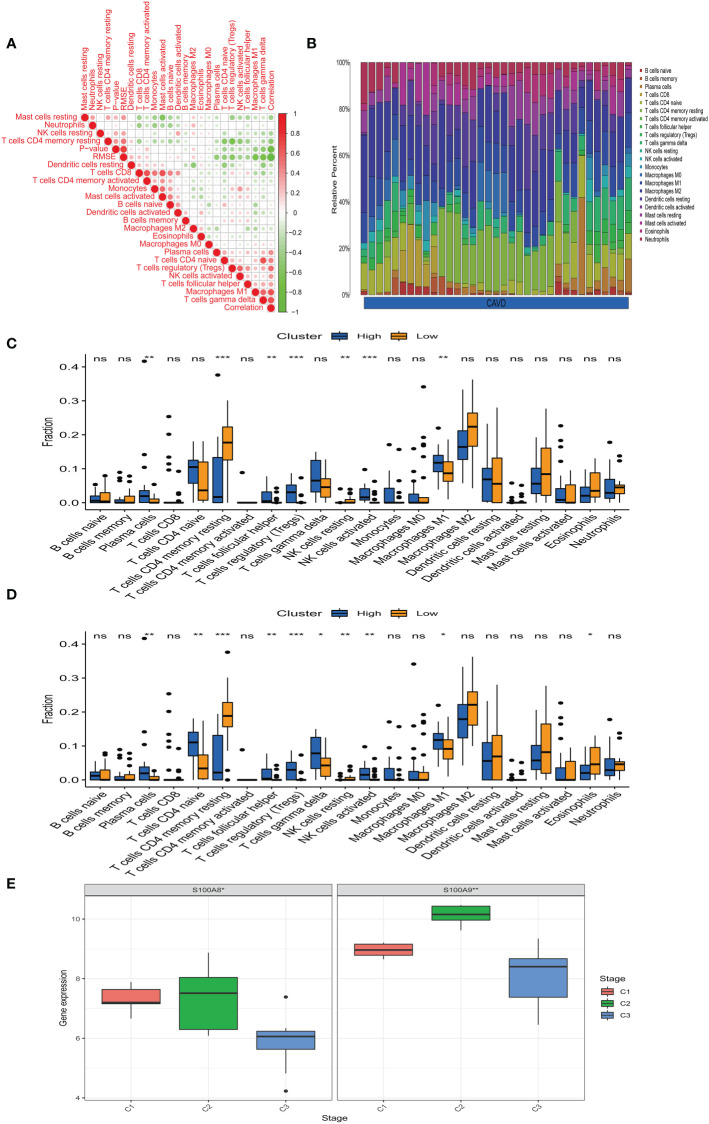
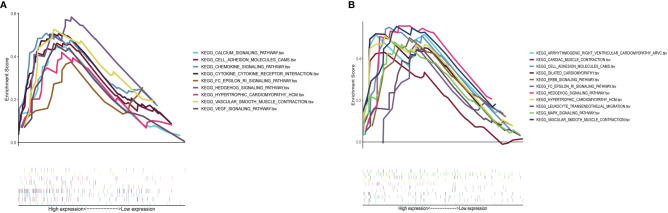
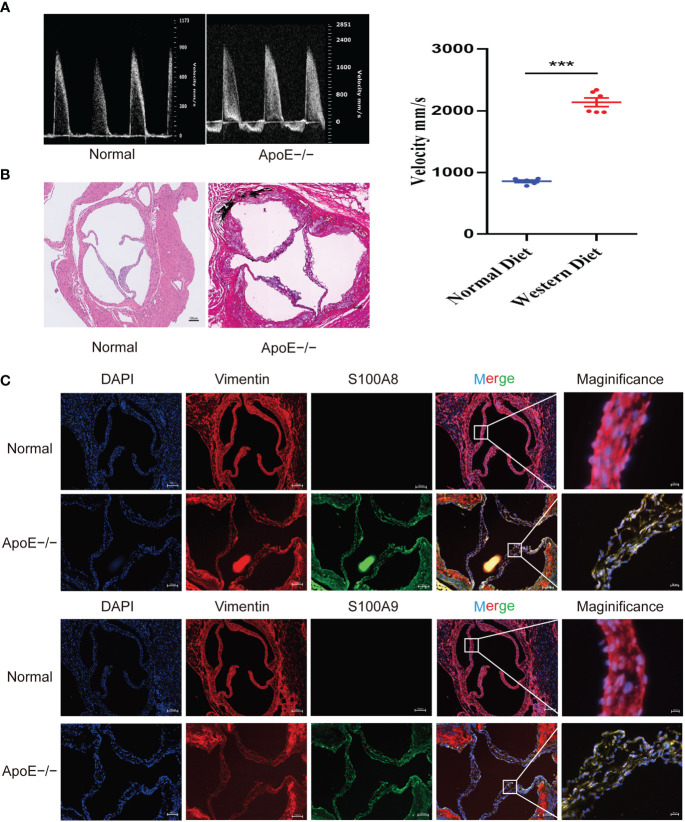
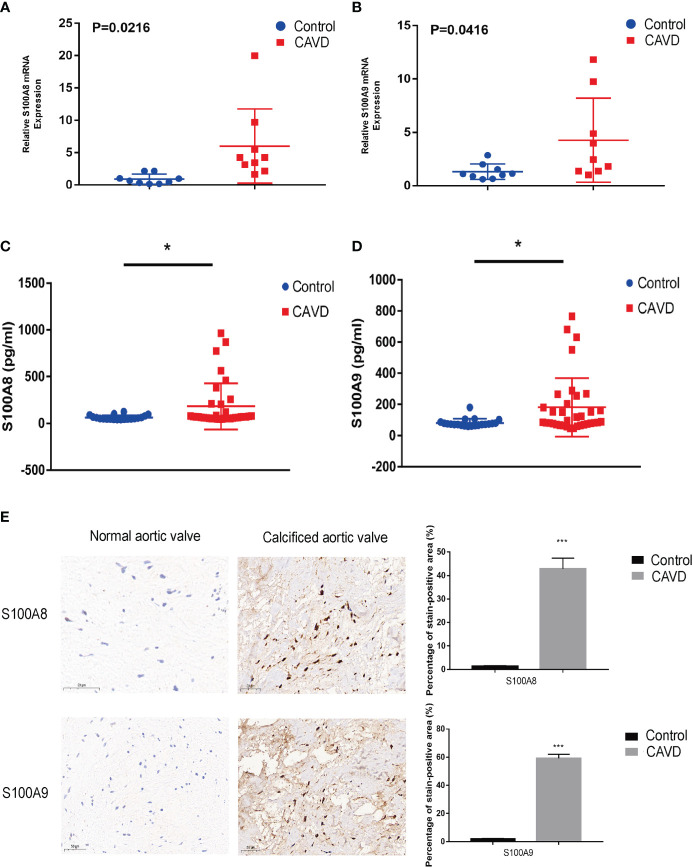
Methods: In this study, bioinformatics analysis was used to identify hub genes involved in CAVD. The datasets were downloaded from the Gene Expression Omnibus (GEO) database. Gene expression differences were evaluated via pathway and Gene Ontology analyses. Weighted gene co-expression network analysis (WGCNA) and differentially expressed genes were used to screen hub genes. The CIBERSORT algorithm was used to compare immune infiltration into the calcified aortic valve based on the hub genes between high- and low-expression groups. We also performed single-cell RNA sequencing based on six different human aortic valve leaflets. The expression of hub genes was identified in human and mouse samples through quantitative real-time polymerase chain reaction (qPCR), immunohistochemistry, immunofluorescence, and ELISA, and clinical features of the patients were investigated.

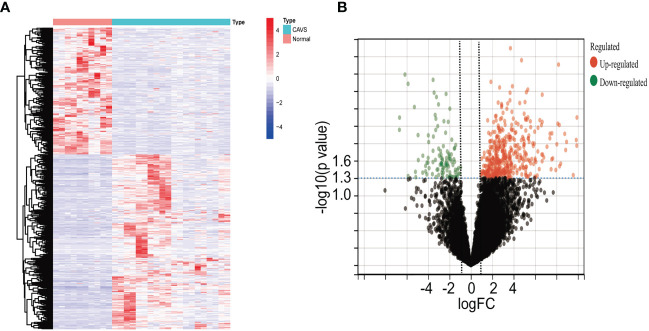
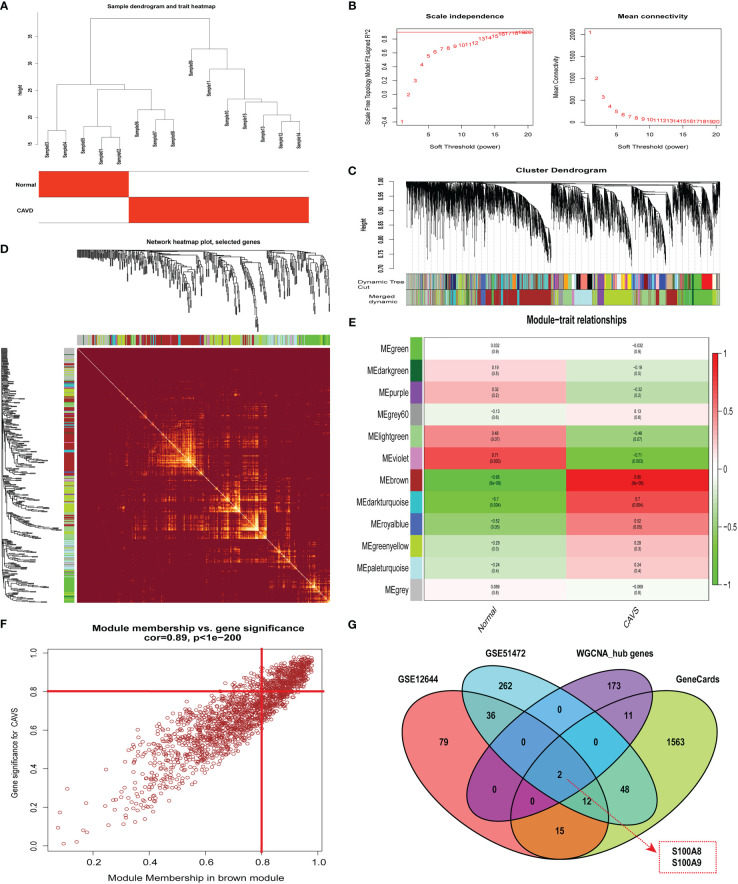
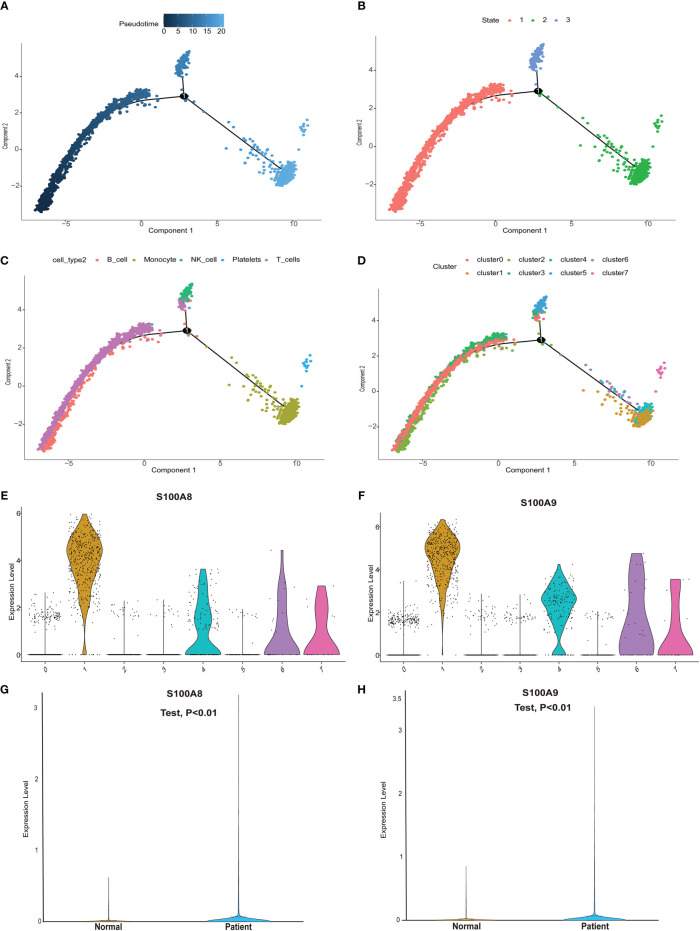
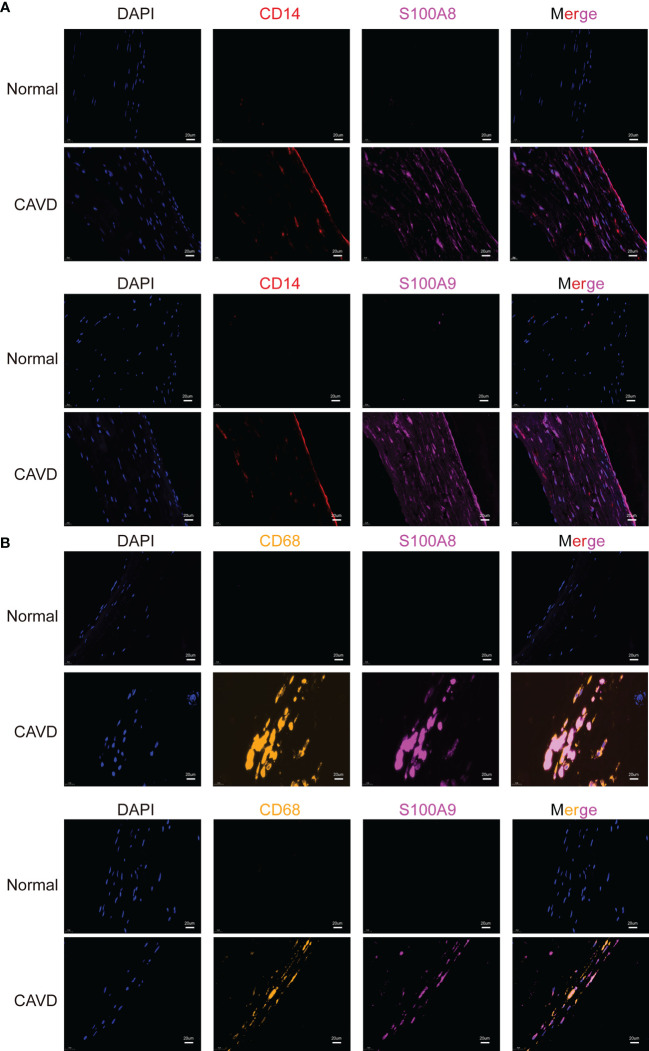
Results: In total, 454 differentially expressed genes were obtained from the GEO database. WGCNA was used to find 12 co-expression modules in the Array Express database, of which one hub module (brown module) was most correlated with CAVD. Two hub genes were identified after combining the differentially expressed genes S100A8 and S100A9. Regarding these genes, the immune infiltration profiles varied between high- and low-expression groups. Compared with that in the low hub gene expression group, the high hub gene expression group had a higher proportion of activated NK cells (p < 0.01) and M1 macrophages (p < 0.05). The expression of S100A8 and S100A9 was consistent with single-gene RNA sequencing results, confirming that the expression levels of these two hub genes are significantly upregulated in patients with CAVD (p < 0.01). Furthermore, these results were verified using mouse and human samples by performing immunofluorescence, immunohistochemistry, qPCR, and ELISA analyses. Finally, the localization of S100A8 and S100A9 in monocytes and macrophages was confirmed via immunofluorescence using human aortic valves.

Conclusion: These results demonstrate that S100A8 and S100A9 are two hub genes involved in CAVD, which might play an important role in its development through immune-related signaling pathways.

Keywords: DEGs; bioinformatics; calcific aortic valve diseases (CAVD); immune infiltration; single cell sequence (scRNA-seq); weighted gene co-expression network analysis (WGCNA).


Conflict of interest statement

The authors declare that the research was conducted in the absence of any commercial or financial relationships that could be construed as a potential conflict of interest.

Figures

Figure 1
Figure 1
Flowchart of our study.
Figure 2
Figure 2
Differential gene analysis of GSE51472 and GSE153555 datasets. (A) Heatmap of the combined GEO database. Green represents downregulated genes, and red represents upregulated genes. (B) Volcano plot of the combined GEO database. Left green plots represent genes that are expressed at low levels in calcific aortic valve disease (CAVD) tissue, and right red plots represent genes that are expressed at high levels in CAVD tissue.
Figure 3
Figure 3
Enrichment analysis of GSE51472 and GSE153555 datasets. (A) Gene Ontology (GO) enrichment. (B) Kyoto Encyclopedia of Genes and Genomes enrichment (KEGG).
Figure 4
Figure 4
Weighted co-expression network analysis (WGCNA) of GSE12644 dataset and Venn diagram to obtain the key genes S100A8 and S100A9. (A) Sample clustering of the GSE12644 dataset. The sample was clustered into two significantly different clusters. (B) Selection of optimal thresholds. The threshold was 16. (C) By aggregating genes with strong correlations in the same module, different modules were obtained and are displayed in different colors. (D) A network heatmap plot was created through WGCNA showing overall module-related gene branches in hierarchical clustering dendrograms. (E) Correlation analysis between modules and calcific aortic valve disease (CAVD). (F) The brown module was significantly positively correlated with CAVD (COR = 0.95, P < 0.001). The genes in the brown module are labeled as the WGCNA-hub genes. (G) Intersection of GeneCards, WGCNA, and differential expression data, displayed in the Venn diagram. The two most significant genes, S100A8 and S100A9, were obtained.
Figure 5
Figure 5
Single-cell quality control and dimension reduction clustering at our center. (A) The percentage of mitochondrial genes and erythrocyte genes was limited to ensure the reliability of cell samples; (B) 1,500 highly variable genes are shown in red, with the top 10 highlighted. (C) Principal component analysis (PCA) of the single-cell expression profiles. (D) Heatmap of expression patterns of cluster-enriched genes. (E, F) Dimensionality reduction and cluster analysis. The cells in the valve could be divided into eight clusters, which could be approximately summarized as T cells, monocytes, B cells, NK cells, and platelets. (G) Expression of marker genes in the main cell clusters based on the tSNE map.
Figure 6
Figure 6
Pseudotime analysis and expression level of hub genes in the single-cell dataset. (A) Differences in the time sequence of cell differentiation. Darker blue indicates earlier differentiation, and lighter blue indicates later differentiation. This provided a reference for subsequent analysis. (B) Three differentiation states of calcified valve diseases. The differentiation in state 2 occurred at the latest timepoint. (C) Differences in differentiation among five different cell types. (D) All cells were clustered into eight clusters. (E, F) Analysis of hub gene (S100A8/S100A9) expression based on our single-cell sequencing dataset from our center. S100A8/S100A9 expression was upregulated in cluster groups (1, 4, 6, 7), which suggested that hub gene expression is higher in the latest stage of calcific aortic valve disease (CAVD). (G, H) S100A8/S100A9 expression analysis in the single-cell dataset. S100A8/S100A9 expression was upregulated in CAVD.
Figure 7
Figure 7
Diagnostic performance of S100A8/S100A9 expression levels for calcific aortic valve disease (CAVD) patients in the datasets. (A–C) The expression levels of S100A8/S100A9 in CAVD were based on the GSE databases (GSE153555, GSE51472, and GSE83453). (D–F) Diagnostic value of S100A8 and S100A9 in GSE databases (GSE153555, GSE51472, and GSE83453). Receiver operating characteristic (ROC) curve of normal and CAVD valve tissues. ** P < 0.01, *** P < 0.001 when two groups were compared as indicated or compared with the corresponding control.
Figure 8
Figure 8
Expression of immune checkpoint-related mRNAs in calcific aortic valve disease (CAVD) patients. (A, B) Comparison of expression levels of 38 immune checkpoint-related RNAs. Immune checkpoint-related RNA expression between S100A8/S100A9 high- and low-expression groups of patients. Blue represents high expression, whereas red represents low expression. (C, D) Visualization of differentially expressed immune checkpoint-related genes in CAVD. S100A8/S100A9 high expression in CAVD patients is marked with blue, and S100A8/S100A9 low expression is marked with red. (E) Spearman correlation analysis of 38 immune checkpoint-related RNAs in CAVD. A higher number in the circle indicates a stronger correlation. The change in color on the right represents a positive or negative correlation. * P < 0.05, ** P < 0.01, *** P < 0.001 when two groups were compared as indicated or compared with the corresponding control.
Figure 9
Figure 9
Immune infiltration analysis. (A) Correlation analysis of different immune cells. Darker green indicates a stronger negative correlation, and darker red shows the strongest positive correlation. (B) The immune landscape of calcific aortic valve disease (CAVD) revealed that the proportion of macrophages in the CAVD immune microenvironment was highest. (C) According to the expression of S100A8, patients were divided into a high- and low-expression groups. The infiltration levels of some immune cells (plasma cells, resting CD4 memory T cells, etc.) were different between the two groups. (D) According to the expression of S100A9, patients were divided into high- and low-expression groups. The infiltration level of some immune cells (plasma cells, CD4 native T cells, etc.) was different between the two groups. (E) Expression of S100A8 and S100A9 in immune subtypes. S100A8 and S100A9 tended to be highly expressed in the C2 immune subtype, and the difference was statistically significant (P < 0.05). * P < 0.05, ** P < 0.01, *** P < 0.001 when two groups were compared as indicated or compared with the corresponding control. Ns indicates non-significant.
Figure 10
Figure 10
GSEA plot showing that a high expression of S100A8 and S100A9 is positively correlated with these significant signaling pathways. (A) In the group with high S100A8 expression in calcific aortic valve disease (CAVD), the enriched pathways included calcium signaling, cell adhesion molecules, chemokine signaling, cytokine–cytokine receptor interaction, FC epsilon RI signaling, Hedgehog signaling, hypertrophic cardiomyopathy, vascular smooth muscle contraction, and VEGF signaling. (B) In the group with a high expression of S100A9 in CAVD, the enriched pathways included arrhythmogenic right ventricular cardiomyopathy, cardiac muscle contraction, cell adhesion molecules, dilated cardiomyopathy, ERBB signaling, FC epsilon RI signaling, Hedgehog signaling, hypertrophic cardiomyopathy, leukocyte transendothelial migration, MAPK signaling, and vascular smooth muscle contraction.
Figure 11
Figure 11
Validation of S100A8 and S100A9 expression in ApoE−/− mice. (A) Echocardiography of hearts from APOE−/− mice in each group. Quantification of flow-velocity maximum of the aortic valve, mm/s. Blue represents a normal diet, and red represents a western diet administered to APOE−/− mice. (B) Von Kossa staining of the mouse valves. The areas of valve calcification are stained black. (C) Immunofluorescence showed increased S100A8 and S100A9 expression levels in aortic valve tissues from ApoE−/− mice fed a western diet for 4 months. ***P< 0.001 when two groups were compared as indicated or compared to the corresponding control.
Figure 12
Figure 12
Validation of S100A8 and S100A9 expression in human samples. RT-PCR analysis of samples from nine patients with calcific aortic valve disease (CAVD) and nine normal patients. The expression of S100A8 (A) and S100A9 (B) was significantly higher in calcified aortic valves than in normal aortic valves (P < 0.05). Expression of S100A8 (C) and S100A9 (D) in human serum (n = 55), as determined by ELISA. (E) Immunohistochemical analysis and quantitative data confirmed S100A8 and S100A9 expression in calcified aortic valves. *P< 0.05, ***P< 0.001 when two groups were compared as indicated or compared to the corresponding control. Ns indicates non-significant.
Figure 13
Figure 13
Colocalization of hub genes (S100A8 and S100A9) and CD14 and CD68 staining. Immunofluorescence analysis of CD14/S100A8 and S100A9 (A). The human aortic valve was stained with anti-CD14 (red) and anti-S100A8/S100A9 (purple) antibodies. S100A8 and S100A9 partly co-localized with monocytes. Immunofluorescence analysis showed CD68/S100A8 and S100A9 expression (B). The human aortic valve was stained with anti-CD68 (yellow) and anti-S100A8/S100A9 (purple) antibodies. The scale bar represents 20 μm.

Similar articles

Cited by

References

    1. Lindman BR, Clavel MA, Mathieu P, Iung B, Lancellotti P, Otto CM, et al. . Calcific aortic stenosis. Nat Rev Dis Primers (2016) 2:16006. doi: 10.1038/nrdp.2016.6 - DOI - PMC - PubMed
    1. Carabello BA, Paulus WJ. Aortic stenosis. LANCET (2009) 373:956–66. doi: 10.1016/S0140-6736(09)60211-7 - DOI - PubMed
    1. Goody PR, Hosen MR, Christmann D, Niepmann ST, Zietzer A, Adam M, et al. . Aortic valve stenosis: From basic mechanisms to novel therapeutic targets. Arterioscler Thromb Vasc Biol (2020) 40:885–900. doi: 10.1161/ATVBAHA.119.313067 - DOI - PubMed
    1. Makkar RR, Fontana GP, Jilaihawi H, Kapadia S, Pichard AD, Douglas PS, et al. . Transcatheter aortic-valve replacement for inoperable severe aortic stenosis. N Engl J Med (2012) 366:1696–704. doi: 10.1056/NEJMoa1202277 - DOI - PubMed
    1. Otto CM, Prendergast B. Aortic-valve stenosis–from patients at risk to severe valve obstruction. N Engl J Med (2014) 371:744–56. doi: 10.1056/NEJMra1313875 - DOI - PubMed

Publication types

Supplementary concepts

LinkOut - more resources