. 2022 Oct 27:13:1034774.
doi: 10.3389/fimmu.2022.1034774. eCollection 2022.

Improved intratumoral penetration of IL12 immunocytokine enhances the antitumor efficacy

Affiliations

Improved intratumoral penetration of IL12 immunocytokine enhances the antitumor efficacy

Keunok Jung et al. Front Immunol. .

Abstract

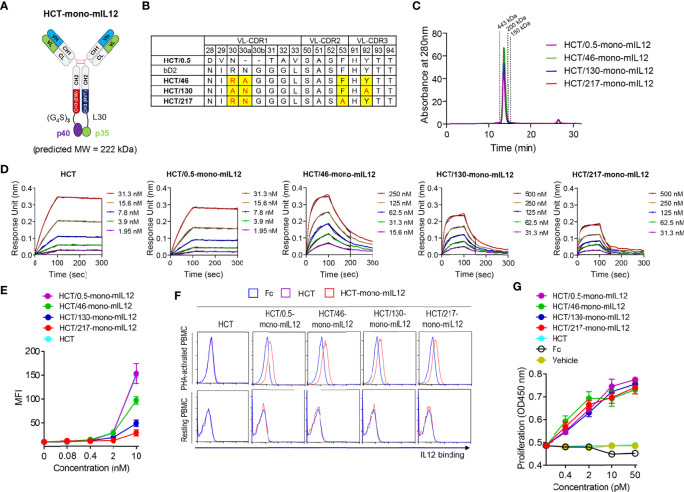
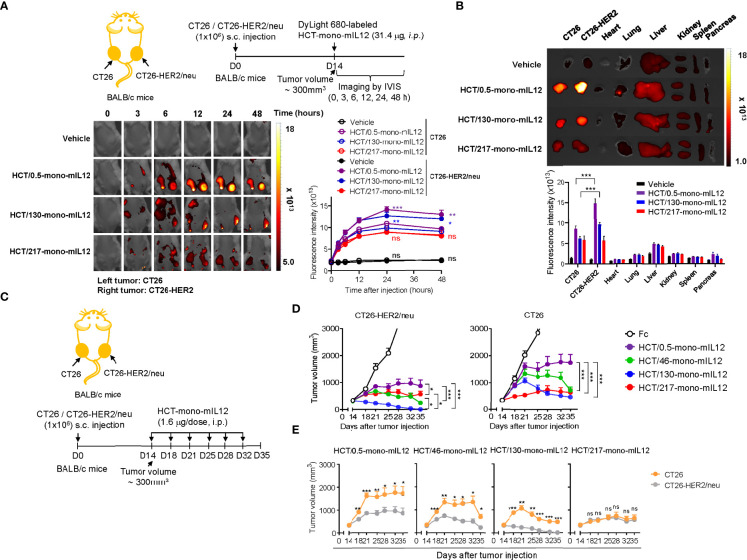
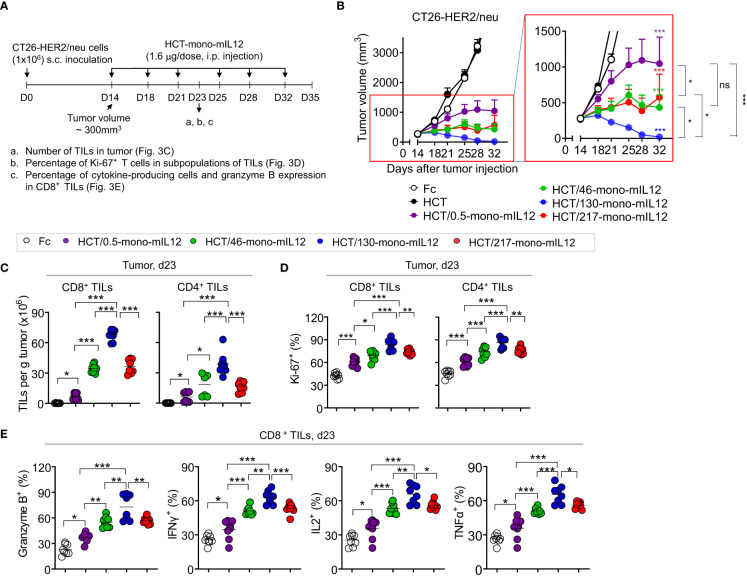
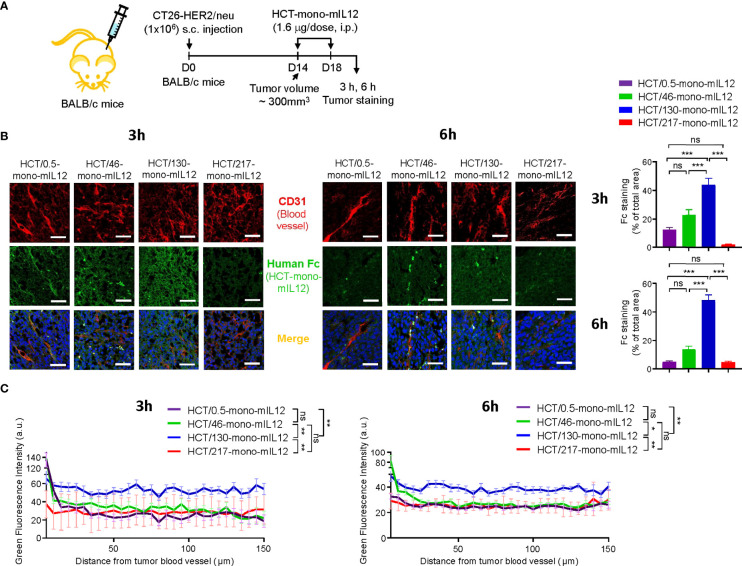
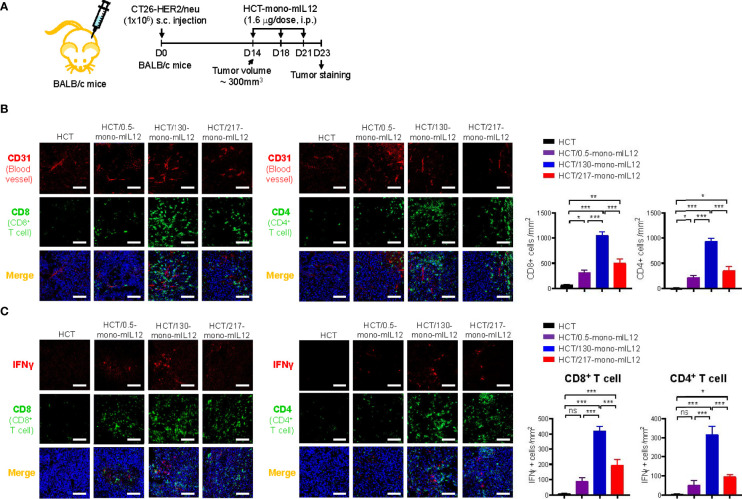
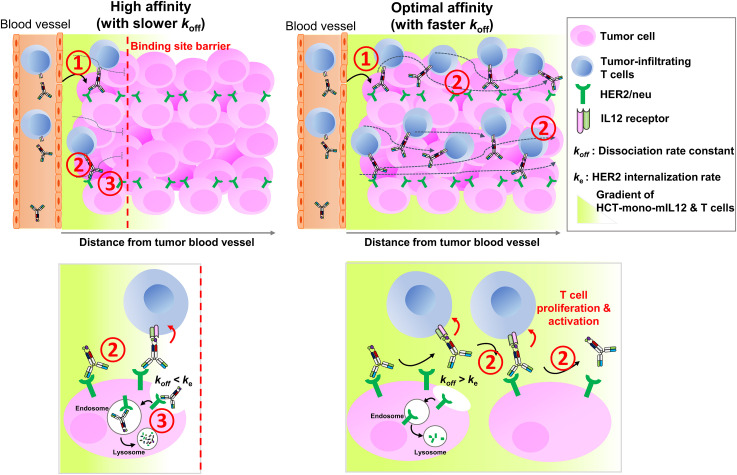
Tumor-targeting antibody (Ab)-fused cytokines, referred to as immunocytokines, are designed to increase antitumor efficacy and reduce toxicity through the tumor-directed delivery of cytokines. However, the poor localization and intratumoral penetration of immunocytokines, especially in solid tumors, pose a challenge to effectively stimulate antitumor immune cells to kill tumor cells within the tumor microenvironment. Here, we investigated the influence of the tumor antigen-binding kinetics of a murine interleukin 12 (mIL12)-based immunocytokine on tumor localization and diffusive intratumoral penetration, and hence the consequent antitumor activity, by activating effector T cells in immunocompetent mice bearing syngeneic colon tumors. Based on tumor-associated antigen HER2-specific Ab Herceptin (HCT)-fused mIL12 carrying one molecule of mIL12 (HCT-mono-mIL12 immunocytokine), we generated a panel of HCT-mono-mIL12 variants with different affinities (K D) mainly varying in their dissociation rates (k off) for HER2. Systemic administration of HCT-mono-mIL12 required an anti-HER2 affinity above a threshold (K D = 130 nM) for selective localization and antitumor activity to HER2-expressing tumors versus HER2-negative tumors. However, the high affinity (K D = 0.54 or 46 nM) due to the slow k off from HER2 antigen limited the depth of intratumoral penetration of HCT-mono-mIL12 and the consequent tumor infiltration of T cells, resulting in inferior antitumor activity compared with that of HCT-mono-mIL12 with moderate affinity of (K D = 130 nM) and a faster k off. The extent of intratumoral penetration of HCT-mono-mIL12 variants was strongly correlated with their tumor infiltration and intratumoral activation of CD4+ and CD8+ T cells to kill tumor cells. Collectively, our results demonstrate that when developing antitumor immunocytokines, tumor antigen-binding kinetics and affinity of the Ab moiety should be optimized to achieve maximal antitumor efficacy.

Keywords: IL12; T cell activation; binding kinetics; immunocytokine; solid tumor; tumor penetration.


Conflict of interest statement

The authors declare that the research was conducted in the absence of any commercial or financial relationships that could be construed as a potential conflict of interest.

Figures

Figure 1
Figure 1
Generation and characterization of HCT-mono-mIL12 variants with different anti-HER2 binding kinetics. (A) Schematic diagram of HCT-mono-mIL12, where the two subunits of mIL12, p40 and p35, were separately fused to the C-terminus of heterodimeric Fc-based HC via (G4S)3 and a 30-residue linker (L30), respectively. (B) The sequence alignment of VL-CDRs of HCT variants highlighting the mutated residues in VL-CDRs of bD2. (C) SEC elution profiles of the purified HCT-mono-mIL12 (30 μg loading amount each). The dotted lines indicate the elution positions of molecular mass standard markers: 443 kDa (apoferritin), 200 kDa (β-amylase), and 150 kDa (alcohol dehydrogenase). (D) Representative binding isotherms of the immobilized HCT or HCT-mono-mIL12 to soluble HER2 antigen, measured by bio‐layer interferometry. The concentrations of HER2 analyzed are indicated in different colors as defined in the in-graph legends. The binding kinetics (k on and k off) and affinities (K D), shown in Table 1 , were obtained by global fitting of the association and dissociation phases (indicated by the black vertical line) with R 2 ≥ 0.99. (E) Dose-dependent binding of HCT (control) or HCT-mono-mIL12 to CT26-HER2/neu cells, measured by flow cytometry and represented by the mean fluorescence intensity (MFI). (F) Binding activities of Fc (40 nM), HCT (40 nM), or HCT-mono-mIL12 variants (40 nM) for resting and PHA-activated PBMCs, analyzed by flow cytometry. (G) Proliferation of PHA-activated PBMCs after 72 h culture with the indicated concentrations of Fc (control), HCT (control), or HCT-mono-mIL12 variants. Data in (C, D, F) are representative of three independent experiments. Data in (E, G) represent the mean ± SD (n=3).
Figure 2
Figure 2
Selective tumor accumulation and antitumor activity of HCT-mono-mIL12 requires anti-HER2 affinity above a certain threshold. (A) Representative whole-body fluorescence images showing the biodistribution of DyLight 680-labeled HCT-mono-mIL12 according to the indicated time after a single i.p. injection of 31.4 μg into BALB/c mice bearing dual-flank tumors of CT26 (left flank) and CT26-HER2/neu (right flank) cells assessed at a tumor volume of ~300 mm3; additional images are shown in Supplementary Figure 2A . Right, fluorescence intensities in CT26 and CT26-HER2/neu tumor tissues, quantified by radiant efficiency. Data represent means ± SEM (n = 7). *p < 0.05, **p < 0.01, ***p < 0.001 between CT26 and CT26-HER2/neu tumors; ns, not significant. (B) Ex vivo analysis of fluorescence intensity of the excised tumors and normal organs 48 h after a single i.p. injection of DyLight 680-labeled HCT-mono-mIL12, as shown in (A). Tumor tissue and normal organs of one representative mouse from each group are shown; additional images are shown in Supplementary Figure 2B . Lower, fluorescence intensities of tumors and organs quantified by radiant efficiency. In (A, B), vehicle indicates PBS buffer as control. Data represent means ± SEM (n = 7). *** p < 0.001 between the indicated groups. (C–E) Treatment scheme of BALB/c mice bearing dual-flank tumors of CT26 (left flank) and CT26-HER2/neu (right flank) cells initiated at a tumor volume of ~300 mm3 with i.p. injection of HCT-mono-mIL12 at 1.6 μg per dose (an equimolar amount of 0.5 μg rmIL12 per dose) twice weekly (C) to determine the antitumor efficacy (D, E). In (D, E), the growth of CT26 and CT26-HER2/neu tumors, measured by tumor volume, is shown separately (D) or comparatively (E) according to HCT-mono-mIL12. Data represent means ± SEM (n = 12–14 per group). *p < 0.05, **p < 0.05, ***p < 0.001 between the indicated groups (D) and between CT26 and CT26-HER2/neu tumors; ns, not significant (E). Data are pooled from two independent experiments with at least four mice per group.
Figure 3
Figure 3
In vivo antitumor efficacy of HCT-mono-mIL12 varies according to its anti-HER2 binding kinetics. (A–E) Treatment scheme of BALB/c mice bearing a single-flank tumor of CT26-HER2/neu cells initiated at a tumor volume of ~300 mm3 with i.p. injection of HCT-mono-mIL12 at 1.6 μg per dose (an equimolar amount of 0.5 μg rmIL12 per dose) twice weekly (A) to determine the antitumor activity (B) and its effect on the number and function of CD4+ and CD8+ TILs (C–E) assessed on day 23 after tumor inoculation [see a–c of (A)]. In (A), the arrows indicate each time point for the treatment or assay. In (B), data represent means ± SEM (n = 14 per group). The region boxed in red is enlarged to the right to better visualize the differences in the antitumor activity among HCT-mono-mIL12 variants. (C–E) Number of CD4+ and CD8+ TILs (C) and percentage of Ki-67-expressing (D) and cytokine-producing or granzyme B-expressing cells (E) among CD4+ and/or CD8+ TILs in the CT26-HER2/neu tumor-bearing mice analyzed by flow cytometry. In (C–E), each symbol represents the value obtained from individual mice (n ≥ 8 per group), and midlines represent the means of two pooled experiments. In (B–E), *p < 0.05, **p < 0.01, ***p < 0.001 between the indicated groups as determined by one-way analysis of variance with the Newman-Keuls post-hoc test; ns, not significant. Data are pooled from two independent experiments with at least four mice per group.
Figure 4
Figure 4
Intratumoral penetration of HCT-mono-mIL12 depends on its anti-HER2 binding kinetics. (A–C) Treatment scheme of CT26-HER2/neu–tumor-bearing mice initiated at a tumor volume of ~300 mm3 with i.p. injection of HCT-mono-mIL12 at 1.6 μg per dose (an equimolar amount of 0.5 μg rmIL12 per dose) two times, on days 14 and 18 after tumor inoculation (A), to determine the intratumoral penetration of HCT-mono-mIL12 in tumor tissues excised from the mice at 3 h or 6 h after the second dosing on day 18 by IF staining (B) and for quantification of the fluorescence intensity from the nearest blood vessel in the tumor section (C). In (A), the arrows indicate each time point for treatment or assay. (B) Representative IF images depicting intratumoral diffusion of HCT-mono-mIL12 (human Fc staining with FITC, green) in relation to the blood vessels (CD31 staining with TRITC, red). Blue represents nuclei staining. Image magnification, ×200; scale bar, 50 μm. Right, quantification of positive areas of Fc staining (green) analyzed by ImageJ software. (C) Fluorescence intensity of HCT-mono-mIL12 in (B) quantified according to the distance from the nearest blood vessel in the tumor tissues. Each line represents the value of fluorescence intensity averaged every 5 μm. In (B, C) data represent mean ± SEM of four fields per tumor (n = 3 per group). *p < 0.05, **p < 0.01, ***p < 0.001 between the indicated groups; ns, not significant.
Figure 5
Figure 5
Intratumoral distribution of CD4+ and CD8+ TILs correlates strongly with the intratumoral penetration of HCT-mono-mIL12. (A–C) Treatment scheme of CT26-HER2/neu tumor-bearing mice initiated at a tumor volume of ~300 mm3 with i.p. injection of HCT-mono-mIL12 at 1.6 μg per dose (an equimolar amount of 0.5 μg rmIL12 per dose) three times on day 14, 18, and 21 after tumor inoculation (A) to determine the intratumoral distribution of total CD4+ and CD8+ TILs in relation to the blood vessels (B) and IFNγ-producing cells among CD4+ and CD8+ TILs (C) at 2 days after the third dosing determined by IF staining. In (A), the arrows indicate each time point for treatment or assay. In (B, C), tumor tissues were excised and stained for CD4 or CD8 (Alexa Fluor 488, green) with CD31 (TRITC, red) (B) and/or IFNγ (TRITC, red) (C). Blue represents nuclei staining. Image magnification, ×200; scale bar, 50 μm. The bar graphs depict the number of the indicated cells per mm2 in a tumor section. Data represent mean ± SEM of four fields per tumor (n = 3 per group). *p < 0.05, **p < 0.01, ***p < 0.001 between the indicated groups; ns, not significant.
Figure 6
Figure 6
Schematics of in vivo intratumoral penetration of HCT-mono-mIL12 as a function of anti-HER2 binding kinetics, and its effect on tumor infiltration and activation of CD4+ and CD8+ T cells in the TME. The tumor localization and intratumoral penetration of HCT-mono-mIL12 are governed by three major steps: (1) vascular transport (extravasation) and tumor retention, (2) interstitial transport, and (3) HER2 receptor-mediated clearance. For tumor retention after extravasation (step 1), HCT-mono-mIL12 requires an anti-HER2 affinity above a threshold to strongly bind tumor cells; otherwise, it will be systemically eliminated. The interstitial transport (step 2) and HER2 receptor-mediated clearance (step 3) are mainly governed by the dissociation rate constant (k off) for HER2 antigen. In step 2, the slower the k off, the longer it takes to diffuse over a certain distance (left panel) and the faster the k off, the farther it transports across the tumor interstitium (right panel). In step 3, a slower k off than the HER2 internalization rate (k e) leads to rapid depletion of HCT-mono-mIL12 (left panel) and a k off faster than k e leads to the extracellular presence and deeper penetration of HCT-mono-mIL12 (right panel). A deep and wide distribution of HCT-mono-mIL12 can induce the tumor infiltration of CD4+ and CD8+ TILs into the distal regions from the blood vessels and/or stimulate the in situ proliferation and activation of the TILs to kill tumor cells, resulting in profound antitumor efficacy.

Similar articles

Cited by

References

    1. Pires IS, Hammond PT, Irvine DJ. Engineering strategies for immunomodulatory cytokine therapies - challenges and clinical progress. Adv Ther (Weinh) (2021) 4(8):2100035. doi: 10.1002/adtp.202100035 - DOI - PMC - PubMed
    1. Propper DJ, Balkwill FR. Harnessing cytokines and chemokines for cancer therapy. Nat Rev Clin Oncol (2022) 19:237–53. doi: 10.1038/s41571-021-00588-9 - DOI - PubMed
    1. Holder PG, Lim SA, Huang CS, Sharma P, Dagdas YS, Bulutoglu B, et al. . Engineering interferons and interleukins for cancer immunotherapy. Adv Drug Delivery Rev (2022) 182:114112. doi: 10.1016/j.addr.2022.114112 - DOI - PubMed
    1. Kim JS, Jun SY, Kim YS. Critical issues in the development of immunotoxins for anticancer therapy. J Pharm Sci (2020) 109(1):104–15. doi: 10.1016/j.xphs.2019.10.037 - DOI - PubMed
    1. Al Ojaimi Y, Blin T, Lamamy J, Gracia M, Pitiot A, Denevault-Sabourin C, et al. . Therapeutic antibodies - natural and pathological barriers and strategies to overcome them. Pharmacol Ther (2022) 233:108022. doi: 10.1016/j.pharmthera.2021.108022 - DOI - PMC - PubMed

Publication types