. 2022 Oct 28:12:945750.
doi: 10.3389/fcimb.2022.945750. eCollection 2022.

The lipidome of Crithidia fasiculata and its plasticity

Affiliations

The lipidome of Crithidia fasiculata and its plasticity

Michela Cerone et al. Front Cell Infect Microbiol. .

Abstract

Crithidia fasiculata belongs to the trypanosomatidae order of protozoan parasites, bearing close relation to other kinetoplastid parasites such as Trypanosoma brucei and Leishmania spp. As an early diverging lineage of eukaryotes, the study of kinetoplastid parasites has provided unique insights into alternative mechanisms to traditional eukaryotic metabolic pathways. Crithidia are a monogenetic parasite for mosquito species and have two distinct lifecycle stages both taking place in the mosquito gut. These consist of a motile choanomastigote form and an immotile amastigote form morphologically similar to amastigotes in Leishmania. Owing to their close relation to Leishmania, Crithidia are a growing research tool, with continuing interest in its use as a model organism for kinetoplastid research with the added benefit that they are non-pathogenic to humans and can be grown with no special equipment or requirements for biological containment. Although comparatively little research has taken place on Crithidia, similarities to other kinetoplast species has been shown in terms of energy metabolism and genetics. Crithidia also show similarities to kinetoplastids in their production of the monosaccharide D-arabinopyranose similar to Leishmania, which is incorporated into a lipoarabinogalactan a major cell surface GPI-anchored molecule. Additionally, Crithidia have been used as a eukaryotic expression system to express proteins from other kinetoplastids and potentially other eukaryotes including human proteins allowing various co- and post-translational protein modifications to the recombinant proteins. Despite the obvious usefulness and potential of this organism very little is known about its lipid metabolism. Here we describe a detailed lipidomic analyses and demonstrate the possible placidity of Crithidia's lipid metabolis. This could have important implications for biotechnology approaches and how other kinetoplastids interact with, and scavenge nutrients from their hosts.

Keywords: Crithidia; fatty acids; kinetoplastid; lipids; oils; plasticity; sugars.


Conflict of interest statement

The authors declare that the research was conducted in the absence of any commercial or financial relationships that could be construed as a potential conflict of interest.

Figures
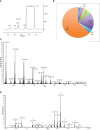
Figure 1
Figure 1
Crithidia fasiculata Phospholipid Composition (A) (Mwenechanya et al., 2017)P-NMR analysis of cellular lipid extract. (B) Quantitation of phospholipid content by head-group (Mwenechanya et al., 2017)P NMR. High resolution mass spectrometry survey scan of lipid extract in (C) positive mode and (D) negative mode.
Figure 2
Figure 2
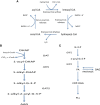
Inositol metabolism in Crithidia (A) An overview of inositol metabolism in kinetoplasts. (Key – INO1, Inositol-3-phosphate synthase; IMPase PIK, Phosphatidylinositol kinase; PIS, Phosphatidylinositol synthase; IPC synthase, Inositol phosphorylceramide synthase; PIPn, Phosphatidylinositol phosphate; CDP-DAG, cytidine diphosphate-diacylglycerol; CMP, cytidine monophosphate; IPC, phosphorylceramide.) (B) ESI-MS-MS negative parent ion scan of PI lipids from C. fasiculata lipid extract, scanning for m/z 241. Peaks are plotted as their relative intensity (%) to that of the largest peak in the spectrum and in terms of their mass to charge (m/z) ratio. (Species identities are given in Supplementary Table 4 ).
Figure 3
Figure 3
Choline metabolism in Crithidia (A) An overview of PC metabolism in eukaryotes. Key - CCT, Choline-phosphate cytidylyltransferase; CK, Choline kinase; CPT, Choline phosphotransferase; PEMT, Phosphatidylethanolamine N-methyltransferase; PLA1, Phospholipase A1; AAG, alkyl-acylglycerol; ADP, adenosinediphosphate; ATP, adenosine-triphosphate; CDP-Cho, cytidine diphosphate-choline; CMP, cytidine monophosphate; CTP, cytidine-triphosphate; DAG, diacylglycerol; Cho-P, choline phosphate; LPC, lyso-phosphatidylcholine. (B) ESI-MS-MS positive parent ion scan of PC lipids from C. fasiculata lipid extract, scanning for m/z 184. Peaks are plotted as their relative intensity (%) to that of the largest peak in the spectrum and in terms of their mass to charge (m/z) ratio. Species identities are given in Table S6 .
Figure 4
Figure 4
Ethanolamine metabolism in Crithidia (A) An overview of PE metabolism in most eukaryotes. Key - ECT, Ethanolamine-phosphate cytidylyltransferase; EK, ethanolamine kinase; EPT, Ethanolamine phosphotransferase; PEMT, Phosphatidylethanolamine N-methyltransferase; PSD, Phosphatidylserine decarboxylase; PSS, Phosphtidylserine synthase; AAG, alkyl-acylglycerol; ADP, adenosinediphosphate; ATP, adenosine-triphosphate; CDP-EtN, cytidine diphosphate-ethanolamine; CMP, cytidine monophosphate; CTP, cytidine-triphosphate; DAG, diacylglycerol; EtN-P, ethanolamine phosphate. (B) ESI-MS-MS negative parent ion scan of PE lipids from C. fasiculata lipid extract, scanning for m/z 196. Peaks are plotted as their relative intensity (%) to that of the largest peak in the spectrum and in terms of their mass to charge (m/z) ratio. (Species identification in Table S8 ).
Figure 5
Figure 5
Serine lipid metabolism in Crithidia: An overview of (A) PS synthesis in eukaryotes, (B) ceramide synthesis in kinetoplastids. Key - 3KSR, 3-Ketosphinganine reductase; DHCD, Dihydroceramide desaturase; DHCS, Dihydroceramide synthase; PSD, Phosphatidylserine decarboxylase; SK, Sphingosine kinase; SPL, Sphingosine-1-phosphate lyase; SPT, Serine palmitoyltransferase; Cho, Choline; EtN, Ethanolamine; EtN-P, ethanolamine phosphate; PC, phosphatidylcholine; PE, phosphatidylethanolamine; PS, phosphatidylserine. (C) ESI-MS-MS neutral loss scan of PS lipids from C. fasiculata lipid extract, scanning for m/z 87 in the negative mode. Peaks are plotted as their relative intensity (%) to that of the largest peak in the spectrum and in terms of their mass to charge (m/z) ratio. (Species identification in Table S10 ).
Figure 6
Figure 6
Fatty acid metabolism in kinetoplastids: (A) Fatty acid elongase mechanism, (B) Acyl-alkyl glycerol synthesis and (C) Phosphatidic acid synthesis and metabolism. Key – ADS, 1-Alkyl-dihydroxyacetonephosphate synthase; DAT, Dihydroxyacetonephosphate acyltransferase,; DAGK, DAG kinase; GAT1, Glycerol-3-phosphate acyltransferase; GAT2, 1-Acyl-sn-glycerol-3-phosphate acyltransferase; PAP, Phosphatidic acid phosphatase; AAG, Alkyl-acyl glycerol; CoA, Co-enzyme A; DAG, Diacylglycerol; G-3-P, Glycerol-3-phosphate; PA, Phosphatidic Acid; PLs, Phospholipids.
Figure 7
Figure 7
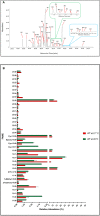
Fatty acid profile in C. fasiculata. (A) GC-MS chromatogram analysis of WT C. fasiculata cultured in standard fat (serum)-free media. Peaks, eluted at different retention times (X axis) and with different abundance (Y axis), are assigned to correspondent FAs. The 20C (green bracket and insert) and 22C PUFAs (light blue bracket and insert) are expanded. (B) The bar chart shows the FAME (or FAs) (Y axis, the order follows increasing retention time) and the relative abundance (X axis) found in C. fasiculata WT grown in standard fat (serum)-free media at 27°C and at 20°C, as shown in the legend. Values are the mean of three independent biological replicates (n=3). Error bars represent the standard deviation of each mean (±). All FAs were identified using GC-MS based upon retention time, fragmentation, and comparison with standards. Statistical analysis was performed by PRISM 6 by using One-way ANOVA multiple comparisons based on a Tukey t-test with a 95% confidence interval.
Figure 8
Figure 8
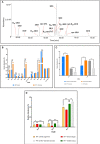
GC-MS analysis of the fatty acids synthesised by C. fasiculata WT upon supplementation with various fatty acid and carbohydrate sources. (A) GC-MS chromatogram of the FA profile after internalisation of D27-myristic acid by C. fasiculata. The cells were supplemented with 50 μM of D27-myristic acid in minimal media (absence of Tween-80). The parasites showed not only to be able to internalise D27-myristic acid, but also to use it as alternative building block to produce various deuterated FAs. (B) GC-MS analysis of the fatty acids in C. fasiculata grown in minimal media supplemented with coconut oil. The bar chart shows the FA (X axis) profile and the relative abundance (Y axis) found in C. fasiculata chemically supplemented with coconut oil and the WT control, as shown in the legend. (C) GC-MS analysis of the fatty acids in the naïve and conditioned media from C. fasiculata cells supplemented with coconut oil. The bar chart shows the variation of the relative abundance (Y axis) of 12:0 and 14:0 (X axis) found in the media immediately after supplementation with coconut oil (naïve media), and after 48 h incubation (condition media). Relative abundances of 12:0 and 14:0 are also reported for WT control and WT supplemented with coconut media to highlight their level of internalisation and consumption. (D) GC-MS analysis of the fatty acids in C. fasiculata grown in minimal media supplemented with brown sugar and golden syrup. The bar chart shows 18C UFAs (X axis, the order follows increasing retention time) and their relative abundance (Y axis) found in C. fasiculata chemically supplemented with brown sugar and golden syrup and compared to WT control grown in sugar-free media or with standard sucrose, as shown in the legend. Values are the mean of three independent biological replicates (n=3). Error bars represent the standard deviation of each mean (±). All FAs were identified using GC-MS based upon retention time, fragmentation, and comparison with standards. Statistical analysis was performed by PRISIM 6 by using One-way ANOVA multiple comparisons based on a Tukey t-test with a 95% confidence interval. **** is p ≤ 0.0001, *** is p ≤ 0.001, ** is p ≤ 0.01 and * is p ≤ 0.05.

Similar articles

Cited by

References

    1. Acosta-Serrano A., Vassella E., Liniger M., Renggli Kunz C., Brun R., Roditi I., et al. . (2001). The surface coat of procyclic trypanosoma brucei: programmed expression and proteolytic cleavage of procyclin in the tsetse fly. Proc. Natl. Acad. Sci. U.S.A. 98, 1513–1518. doi: 10.1073/pnas.98.4.1513 - DOI - PMC - PubMed
    1. Altschul S. F., Gish W., Miller W., Myers E. W., Lipman D. J. (1990). Basic local alignment search tool. J. Mol. Biol. 215, 403–410. doi: 10.1016/S0022-2836(05)80360-2 - DOI - PubMed
    1. Aslett M., Aurrecoechea C., Berriman M., Brestelli J., Brunk B. P., Carrington M., et al. et al. . (2010). TriTrypDB: a functional genomic resource for the trypanosomatidae. Nucleic Acids Res. 38, D457–D462. doi: 10.1093/nar/gkp851 - DOI - PMC - PubMed
    1. Bibis S. S., Dahlstrom K., Zhu T., Zufferey R. (2014). Characterization of leishmania major phosphatidylethanolamine methyltransferases LmjPEM1 and LmjPEM2 and their inhibition by choline analogs. Mol. Biochem. Parasitol. 196, 90–99. doi: 10.1016/j.molbiopara.2014.08.005 - DOI - PMC - PubMed
    1. Bligh E. G., Dyer W. J. (1959). A rapid method of total lipid extraction and purification. Can. J. Biochem. Physiol. 37, 911–917. doi: 10.1139/y59-099 - DOI - PubMed

Publication types