

Does Objectively Measured Social-Media or Smartphone Use Predict Depression, Anxiety, or Social Isolation Among Young Adults?
- PMID: 36406004
- PMCID: PMC9671480
- DOI: 10.1177/21677026221078309
Does Objectively Measured Social-Media or Smartphone Use Predict Depression, Anxiety, or Social Isolation Among Young Adults?
Abstract
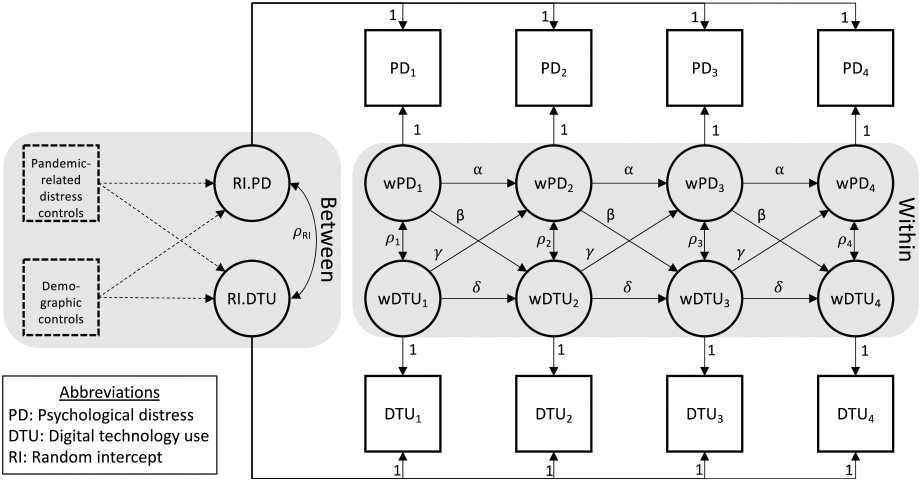
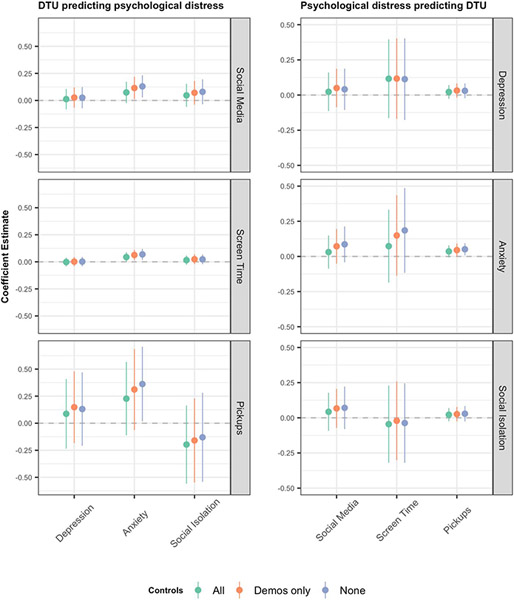
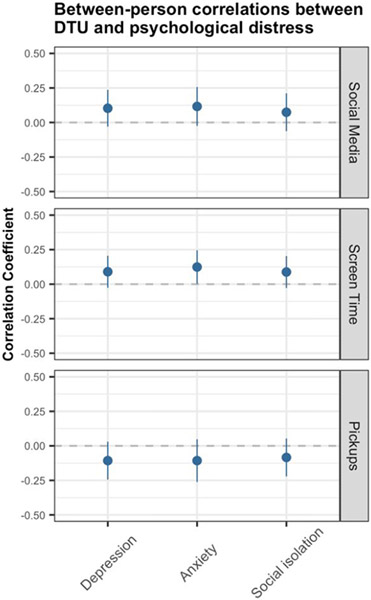
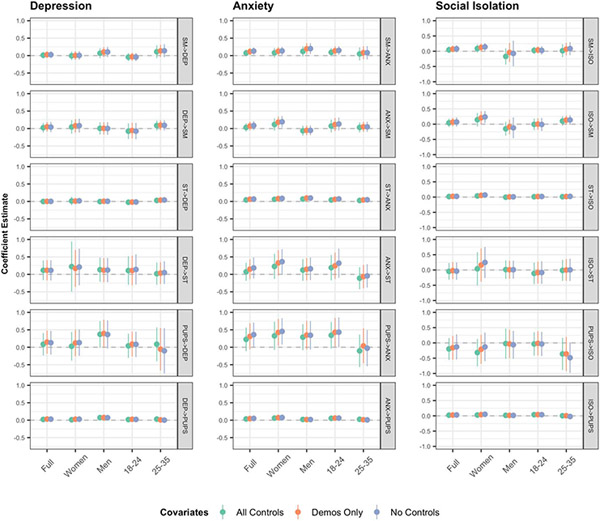
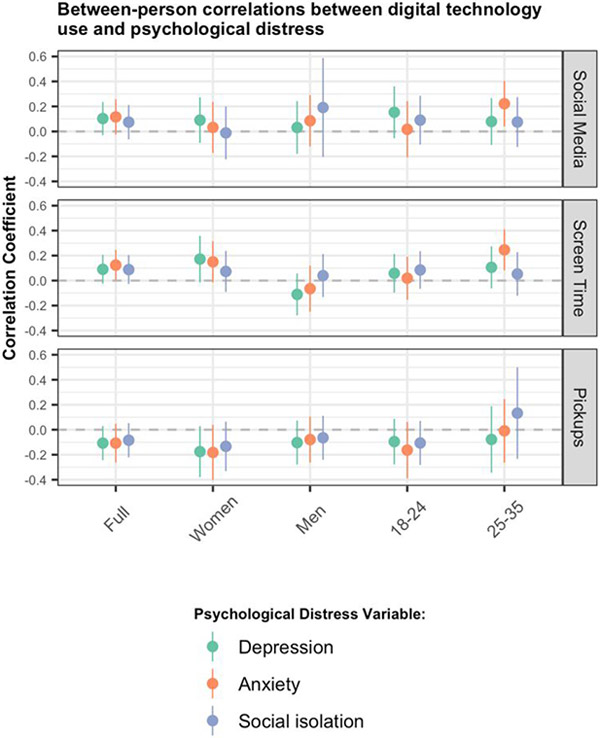
Despite a plethora of research, the link between digital technology use and psychological distress among young adults remains inconclusive. Findings in this area are typically undermined by methodological limitations related to measurement, study design, and statistical analysis. Addressing these limitations, we examined the prospective, within-person associations between three aspects of objectively-measured digital technology use (smartphone use duration and frequency; social media use duration) and three aspects of psychological distress (depression, anxiety, and social isolation) among a sample of young adults (N = 384). Across 81 different model specifications, we found that most within-person prospective effects between digital technology use and psychological distress were statistically non-significant and all were very small-even the largest effects were unlikely to register a meaningful impact on a person's psychological distress. In post hoc subgroup analyses, we found scant evidence for the claim that digital technology use is more harmful for women and/or younger people.
Figures
Similar articles
-
The Mediating Role of Selfitis in the Associations between Self-Esteem, Problematic Social Media Use, Problematic Smartphone Use, Body-Self Appearance, and Psychological Distress among Young Ghanaian Adults.Healthcare (Basel). 2022 Dec 10;10(12):2500. doi: 10.3390/healthcare10122500. Healthcare (Basel). 2022. PMID: 36554024 Free PMC article.
-
Digital depression: a new disease of the millennium?Acta Psychiatr Scand. 2020 Apr;141(4):356-361. doi: 10.1111/acps.13151. Epub 2020 Feb 3. Acta Psychiatr Scand. 2020. PMID: 31955405 Review.
-
Loneliness unlocked: Associations with smartphone use and personality.Acta Psychol (Amst). 2021 Nov;221:103454. doi: 10.1016/j.actpsy.2021.103454. Epub 2021 Nov 26. Acta Psychol (Amst). 2021. PMID: 34844066
-
Telephone interventions for symptom management in adults with cancer.Cochrane Database Syst Rev. 2020 Jun 2;6(6):CD007568. doi: 10.1002/14651858.CD007568.pub2. Cochrane Database Syst Rev. 2020. PMID: 32483832 Free PMC article.
-
Loneliness Shapes the Relationship between Information and Communications Technology Use and Psychological Adjustment among Older Adults.Gerontology. 2019;65(2):198-206. doi: 10.1159/000495461. Epub 2019 Feb 27. Gerontology. 2019. PMID: 30814472
Cited by
-
Emerging adults' digital technology engagement and mental health during the COVID-19 pandemic.Front Psychol. 2022 Nov 17;13:1023514. doi: 10.3389/fpsyg.2022.1023514. eCollection 2022. Front Psychol. 2022. PMID: 36467177 Free PMC article.
-
Stress and Mood Associations With Smartphone Use in University Students: A 12-Week Longitudinal Study.Clin Psychol Sci. 2023 Sep;11(5):921-941. doi: 10.1177/21677026221116889. Epub 2023 Jan 10. Clin Psychol Sci. 2023. PMID: 37694230 Free PMC article.
-
Enjoyment or Indulgence? Social Media Service Usage, Social Gratification, Self-Control Failure and Emotional Health.Int J Environ Res Public Health. 2023 Jan 5;20(2):1002. doi: 10.3390/ijerph20021002. Int J Environ Res Public Health. 2023. PMID: 36673758 Free PMC article.
-
Social media behaviors and symptoms of anxiety and depression. A four-wave cohort study from age 10-16 years.Comput Human Behav. 2023 Oct;147:107859. doi: 10.1016/j.chb.2023.107859. Epub 2023 Jul 1. Comput Human Behav. 2023. PMID: 39474430 Free PMC article.
-
Social networking smartphone applications and emotional health among college students: The moderating role of social support.Sci Prog. 2022 Oct-Dec;105(4):368504221144439. doi: 10.1177/00368504221144439. Sci Prog. 2022. PMID: 36529902 Free PMC article.
References
-
- Boase J, & Ling R (2013). Measuring Mobile Phone Use: Self-Report Versus Log Data. Journal of Computer-Mediated Communication, 18(4), 508–519. 10.1111/jcc4.12021 - DOI
-
- Chuck E (2017). Is Social Media Contributing to Rising Teen Suicide Rate? NBCnews.Com. https://www.nbcnews.com/news/us-news/social-media-contributing-rising-te...
Grants and funding
LinkOut - more resources
Full Text Sources