

Supplementation with honeysuckle extract improves growth performance, immune performance, gut morphology, and cecal microbes in geese
- PMID: 36406074
- PMCID: PMC9669450
- DOI: 10.3389/fvets.2022.1006318
Supplementation with honeysuckle extract improves growth performance, immune performance, gut morphology, and cecal microbes in geese
Abstract
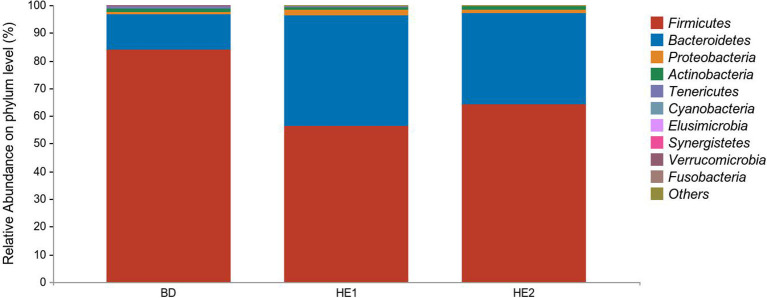
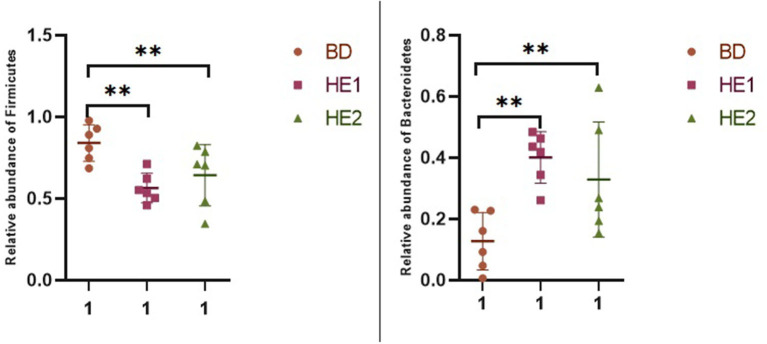
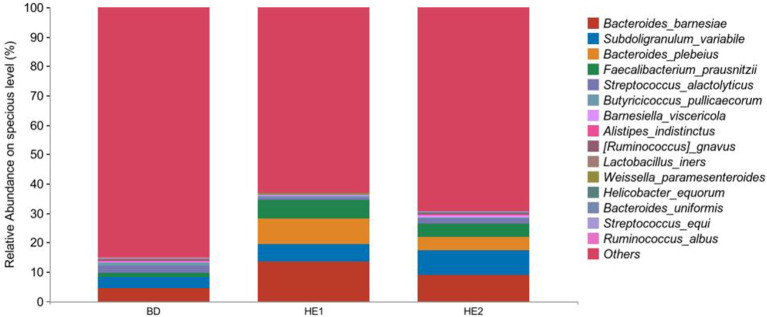
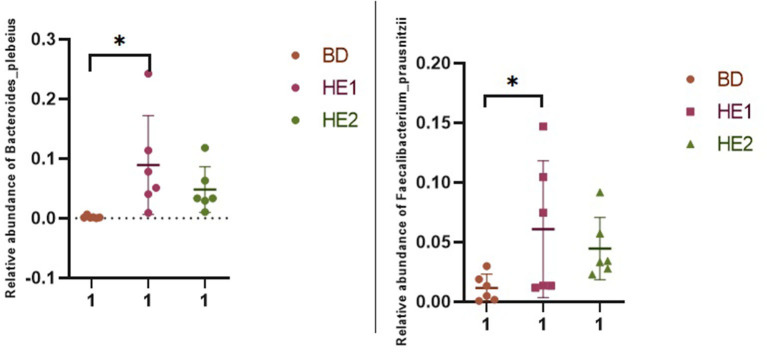
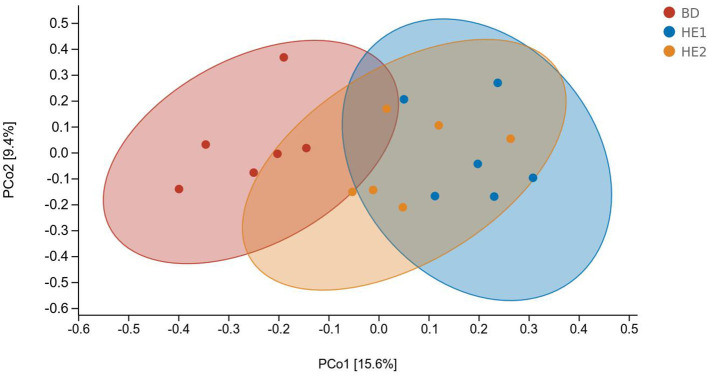
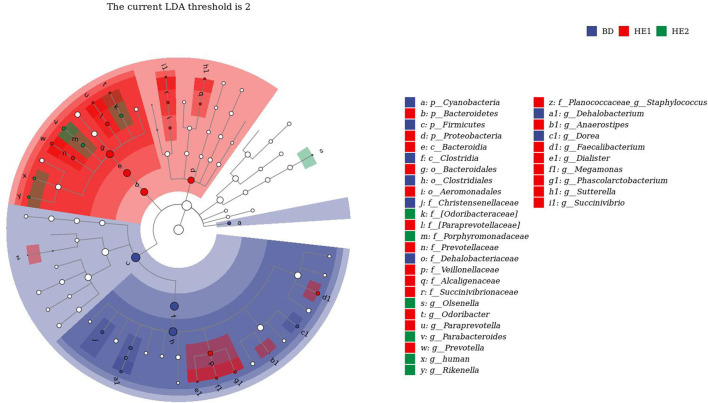
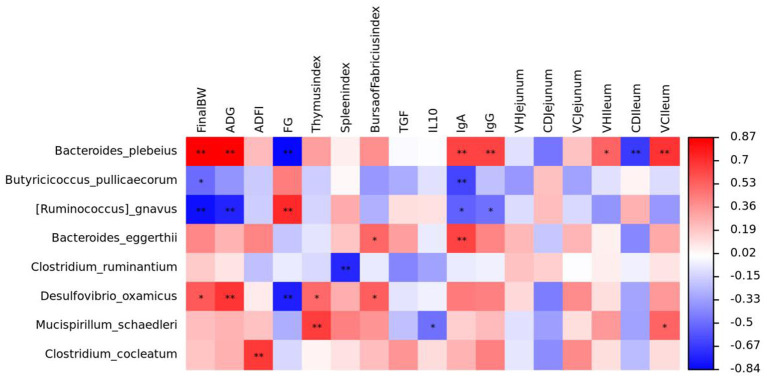
The study aimed to investigate the effects of honeysuckle extract (HE) on growth performance, serum biochemical indexes, immune organ indexes, gut morphology, and gut microbes in geese. A total of 180 28-day-old Holdobaki geese were randomly divided into three groups. Each group contained 6 replicates (10 geese, with 5 males and 5 females). The BD group was fed the basal diet, the HE1 group was fed the basal diet supplemented with 1 g/kg of HE, and the HE2 group was fed the basal diet supplemented with 2 g/kg of HE. The experiment lasted for 42 days. The results showed that, compared with the BD group, the average daily gain (ADG) of the HE1 and HE2 groups tended to increase (0.05 < P < 0.10), but the average daily feed intake (ADFI) and final body weight (BW) did not differ significantly, and the feed/gain ratio (F/G) was significantly lower (P < 0.01). The bursa index and the thymus index tended to increase (0.05 < P < 0.10), and serum immunoglobulin A (IgA) and immunoglobulin G (IgG) levels increased significantly (P < 0.05). In the HE1 and HE2 groups, the crypt depth (CD) in the jejunum tended to decrease (0.05 < P < 0.10), and the villus height/crypt depth ratio (V/C) increased significantly in the jejunum and the ileum (P < 0.05). According to 16sRNA microbial community diversity analysis, Firmicutes, Bacteroidetes, Proteobacteria, and Actinobacteria were the dominant phyla. The abundance of Firmicutes was significantly decreased (P < 0.01), while that of Bacteroidetes was significantly increased (P < 0.01), in the HE1 and HE2 groups compared with the BD group. Bacteroides barnesiae, Subdoligranulum variabile, Bacteroides plebeius, and Faecalibacterium prausnitzii were the dominant species, and the abundance of B. plebeius and F. prausnitzii was significantly increased (P < 0.05). According to the LEfSe analysis, BD enriched g_Dorea and g_Dehalobacterium; HE1 enriched g_Faecalibacterium, g_Dialister, g_Prevotella, g_Megamonas, g_Phascolarctobacterium, g_Paraprevotella, g_Anaerostipes, g_Staphylococcus, g_Odoribacter, g_Succinivibrio, and g_Sutterella; and HE2 enriched g_Parabacteroides, g_Olsenella, g_human, and g_Rikenella. According to the Spearman correlation analysis, Bacteroides plebeius was positively correlated with final BW, ADG, IgA, IgG, VH (ileum), and V/C (ileum) and was negatively correlated with F/G and CD (ileum); Ruminococcus gnavus was negatively correlated with final BW, ADG, IgA, and IgG. HE supplementation at 1 g/kg improved growth performance, immune performance, gut morphology, and cecal microbes.
Keywords: cecal microbiome; goose; growth performance; immune; intestinal morphology.
Copyright © 2022 Li, Wang, Liu, Wang, Yang, Gong, Zhu, He and Wang.
Conflict of interest statement
The authors declare that the research was conducted in the absence of any commercial or financial relationships that could be construed as a potential conflict of interest.
Figures
Similar articles
-
Polysaccharides derived from Astragalus membranaceus and Glycyrrhiza uralensis improve growth performance of broilers by enhancing intestinal health and modulating gut microbiota.Poult Sci. 2022 Jul;101(7):101905. doi: 10.1016/j.psj.2022.101905. Epub 2022 Apr 6. Poult Sci. 2022. PMID: 35576745 Free PMC article.
-
Bile acids supplementation modulates lipid metabolism, intestinal function, and cecal microbiota in geese.Front Microbiol. 2023 May 26;14:1185218. doi: 10.3389/fmicb.2023.1185218. eCollection 2023. Front Microbiol. 2023. PMID: 37303790 Free PMC article.
-
Effects of dietary Artemisia annua supplementation on growth performance, antioxidant capacity, immune function, and gut microbiota of geese.Poult Sci. 2024 May;103(5):103594. doi: 10.1016/j.psj.2024.103594. Epub 2024 Feb 28. Poult Sci. 2024. PMID: 38479097 Free PMC article.
-
Effects of Achyranthes bidentata Polysaccharides on Intestinal Morphology, Immune Response, and Gut Microbiome in Yellow Broiler Chickens Challenged with Escherichia coli K88.Polymers (Basel). 2018 Nov 7;10(11):1233. doi: 10.3390/polym10111233. Polymers (Basel). 2018. PMID: 30961158 Free PMC article.
-
Organic zinc glycine chelate is better than inorganic zinc in improving growth performance of cherry valley ducks by regulating intestinal morphology, barrier function, and the gut microbiome.J Anim Sci. 2023 Jan 3;101:skad279. doi: 10.1093/jas/skad279. J Anim Sci. 2023. PMID: 37606553 Free PMC article.
Cited by
-
The rumen microbiome and its metabolome together with the host metabolome regulate the growth performance of crossbred cattle.BMC Genomics. 2025 Mar 21;26(1):278. doi: 10.1186/s12864-025-11465-5. BMC Genomics. 2025. PMID: 40119296 Free PMC article.
-
Dietary supplementation with Chinese herbal mixture extracts enhances growth performance, immunity, antioxidant capacity, and intestinal microbiota function in calves.Front Vet Sci. 2025 Apr 8;12:1530124. doi: 10.3389/fvets.2025.1530124. eCollection 2025. Front Vet Sci. 2025. PMID: 40271489 Free PMC article.
-
Effects of plant essential oils on intestinal microflora and growth performance of Lingshan native hens.Poult Sci. 2025 Jul 4;104(10):105539. doi: 10.1016/j.psj.2025.105539. Online ahead of print. Poult Sci. 2025. PMID: 40652765 Free PMC article.
-
Dietary novel alkaline protease from Bacillus licheniformis improves broiler meat nutritional value and modulates intestinal microbiota and metabolites.Anim Microbiome. 2024 Jan 6;6(1):1. doi: 10.1186/s42523-023-00287-z. Anim Microbiome. 2024. PMID: 38184648 Free PMC article.
-
Feeding whole-plant ensiled corn stover affects growth performance, blood parameters, and Cecal microbiota of Holdobagy goose.Front Vet Sci. 2023 Jun 15;10:1210706. doi: 10.3389/fvets.2023.1210706. eCollection 2023. Front Vet Sci. 2023. PMID: 37397002 Free PMC article.
References
-
- Muniyappan M, Jeon SY, Choi M-K, Kim IH. Dietary inclusion of Achyranthes japonica extract to corn-soybean meal-wheat-based diet on the growth performance, nutrient digestibility, cecal microflora, excreta noxious gas emission, and meat quality of broiler chickens. Poult Sci. (2022) 101:101852. 10.1016/j.psj.2022.101852 - DOI - PMC - PubMed
-
- Kim KC, Sin S-I, Ri M-R, Jo CH, Mun S-H. Effect of dietary Pinus densiflora bark extract on activity and mRNA expression of antioxidant enzyme in weaning piglets. Lives Sci. (2022) 260:104931. 10.1016/j.livsci.2022.104931 - DOI
-
- Pan DB, Wang J, Cheng J, Sun X, Zhou L, Yuan Y, et al. . Effects of Radix Bupleuri extract supplementation on lactation performance and rumen fermentation in heat-stressed lactating Holstein cows. Anim Feed Sci Technol. (2014) 187:1–8. 10.1016/j.anifeedsci.2013.09.008 - DOI
LinkOut - more resources
Full Text Sources
Miscellaneous