. 2022 Nov 3:9:1009402.
doi: 10.3389/fmolb.2022.1009402. eCollection 2022.

Glis1 and oxaloacetate in nucleus pulposus stromal cell somatic reprogramming and survival

Affiliations

Glis1 and oxaloacetate in nucleus pulposus stromal cell somatic reprogramming and survival

Leon Lufkin et al. Front Mol Biosci. .

Abstract

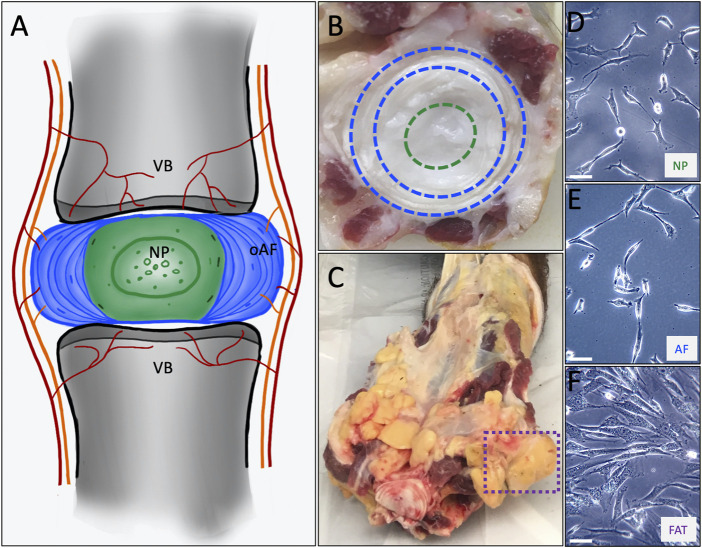
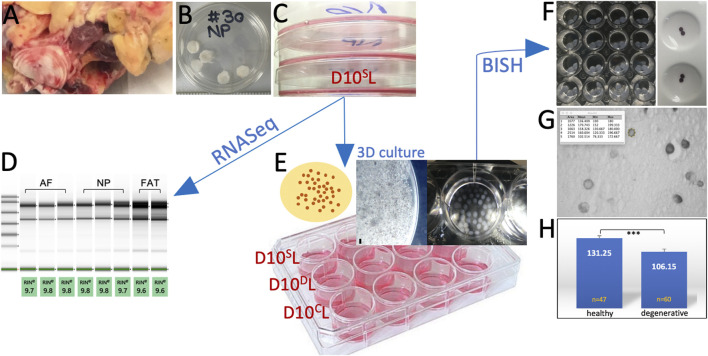
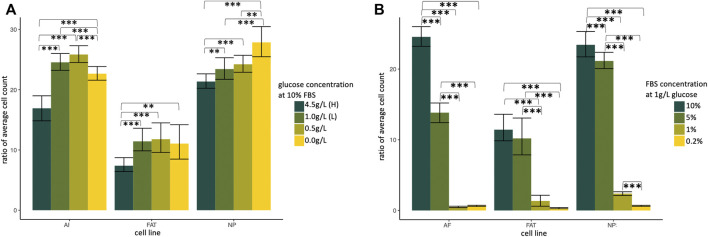
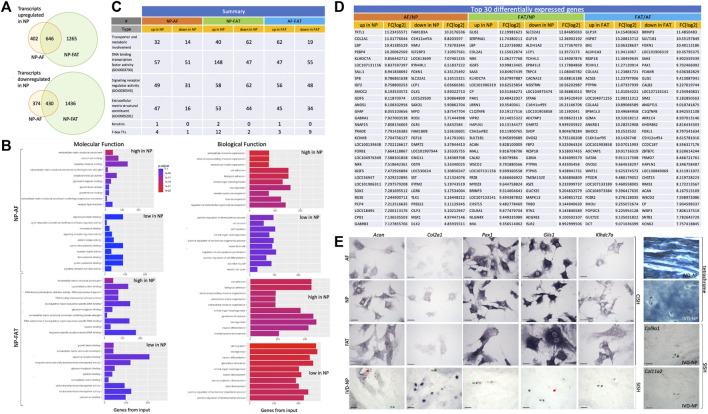
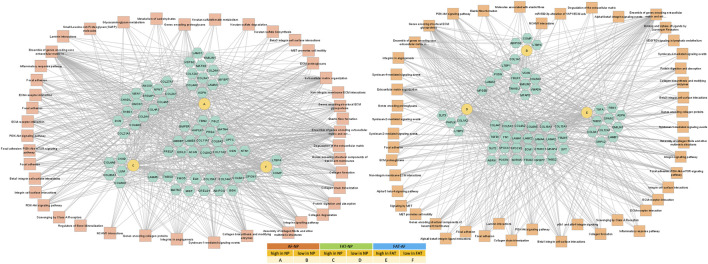
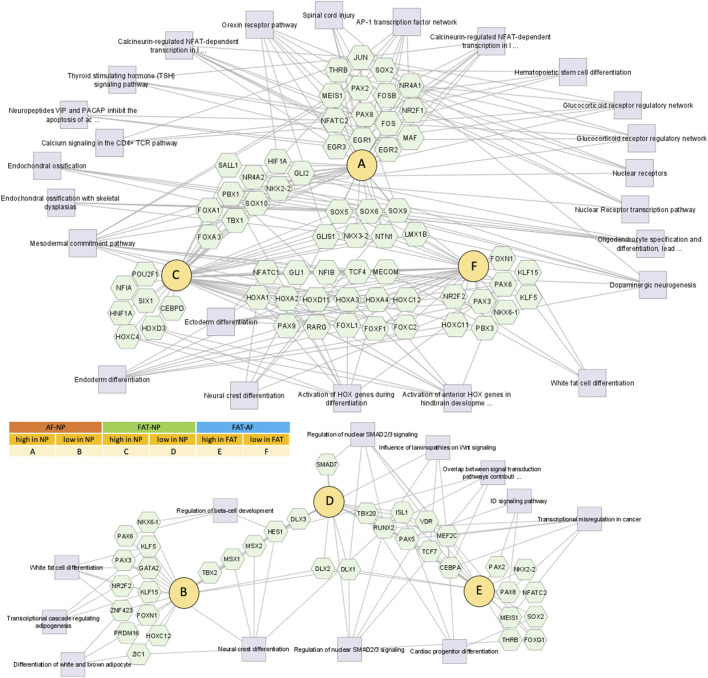
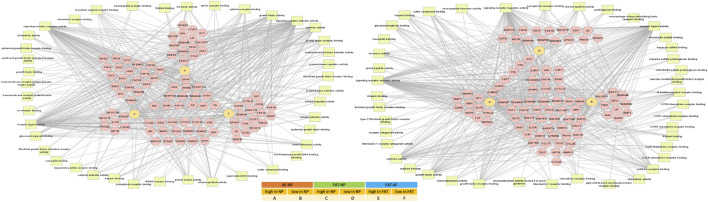
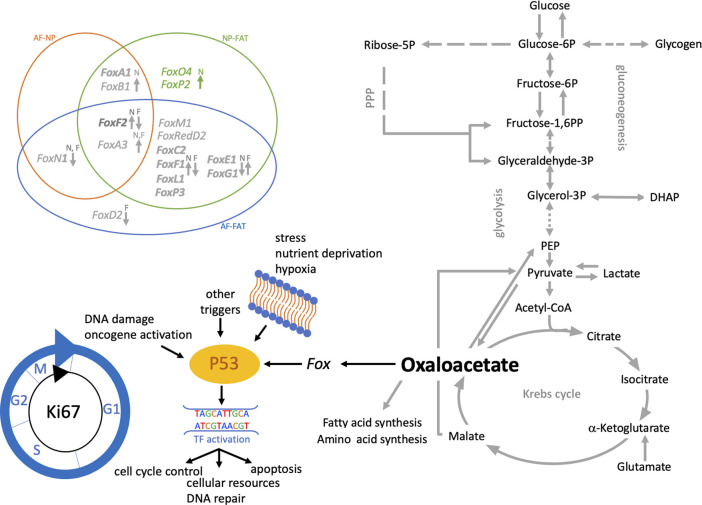
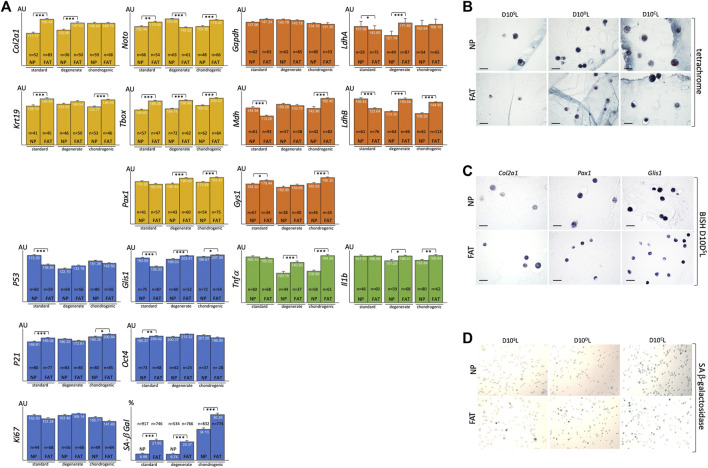
Regenerative medicine aims to repair degenerate tissue through cell refurbishment with minimally invasive procedures. Adipose tissue (FAT)-derived stem or stromal cells are a convenient autologous choice for many regenerative cell therapy approaches. The intervertebral disc (IVD) is a suitable target. Comprised of an inner nucleus pulposus (NP) and an outer annulus fibrosus (AF), the degeneration of the IVD through trauma or aging presents a substantial socio-economic burden worldwide. The avascular nature of the mature NP forces cells to reside in a unique environment with increased lactate levels, conditions that pose a challenge to cell-based therapies. We assessed adipose and IVD tissue-derived stromal cells through in vitro transcriptome analysis in 2D and 3D culture and suggested that the transcription factor Glis1 and metabolite oxaloacetic acid (OAA) could provide NP cells with survival tools for the harsh niche conditions in the IVD.

Keywords: 3D culture; adipose; annulus fibrosus; intervertebral disc; nucleus pulposus; regenerative medicine; stromal cell; transcriptome analysis.


Figures

FIGURE 1
FIGURE 1
(A) Schematic representing the intervertebral disc consisting of an outer annulus fibrosus (oAF) and inner nucleus pulposus (NP) sandwiched between the cartilaginous endplates of the adjacent vertebral bodies (VB). (B) A cut through a bovine tail showing a coccygeal IVD. The outer AF as seen between the blue dashed lines and the NP within the green dashed circle served as tissue source to derive AF and NP cell lines. (C) The box with the dashed purple line shows coccygeal, subcutaneous adipose tissue used as source to derive FAT cells. The primary cell lines are shown at p0 as they attach to a plastic surface for NP (D), AF (E) and FAT (F) cells. The scale bar represents 50 μM.
FIGURE 2
FIGURE 2
Experimental workflow showing the bovine tail as cell source (A). Nucleus pulposus (NP) explants in 1X PBS prior to cell isolation (B). Initial primary cell expansion in monolayer culture (C). Transcriptome analysis through RNASeq after RNA quality assessment (D). Cells were embedded in alginate for 3D culture as shown in the schematic. A high-magnification image of such a bead is shown next to beads collected in a 24-well plate (E) under standard (D10SL), degenerate (D10DL), and chondrogenic (D10CL) conditions. Phenotyping was carried out by RNA in situ hybridization on beads (BISH) (F). Beads were sectioned (G) and submitted to ImageJ analysis (H).
FIGURE 3
FIGURE 3
Normalized ratio of average cell count indicating cell proliferation of primary cells isolated from annulus fibrosus (AF), nucleus pulposus (NP), and subcutaneous adipose tissue (FAT). Cells were cultured in supplemented DMEM and subjected to a glucose (A) and growth factor (B) challenge. H, high; L, low; FBS, fetal bovine serum. Cells were isolated from two different donors and plated as three technical replicates for each cell line and condition.
FIGURE 4
FIGURE 4
Overview of differentially expressed transcripts from annulus fibrosus (AF), nucleus pulposus (NP), and subcutaneous adipose (FAT)-derived primary cells (A). Bar graphs indicate the 10 top categories after functional enrichment for molecular or biological functions. Colors indicate the Benjamini–Yekutieli adjusted p-values. (B). Summary of RNASeq results (C). Top 30 differentially expressed transcripts (D) and validation of selected targets through RNA in situ hybridization and alkaline phosphatase reporter gene expression on cultured cells (CISH) and sections through the nucleus pulposus of the IVD (SISH) where green arrows point to positive and red arrows to negative cells. Tetrachrome staining of IVD sections provides ECM histology for reference (E). Scale bar represents 50 μm. Cells were isolated from a single donor to avoid the genotype effect. Cells were analyzed as three replicates for AF and NP and two replicates for FAT cells.
FIGURE 5
FIGURE 5
Network of differentially expressed transcripts between annulus fibrosus (AF) and nucleus pulposus (NP) cells of the IVD and adipose (FAT) stromal cells associated with the functional enrichment term extracellular matrix structural constituent (GO:0005201). Networks were generated with ToppCluster and analyzed in Cytoscape. Cells were isolated from a single donor to avoid the genotype effect. Cells were analyzed as three replicates for AF and NP and two replicates for FAT cells. Nodes are identified in the legend.
FIGURE 6
FIGURE 6
Network of differentially expressed transcripts between annulus fibrosus (AF) and nucleus pulposus (NP) cells of the IVD and adipose (FAT) stromal cells associated with the functional enrichment term DNA binding transcription factor activity (GO:0003700). Networks were generated with ToppCluster and analyzed in Cytoscape. Cells were isolated from a single donor to avoid the genotype effect. Cells were analyzed as three replicates for AF and NP and two replicates for FAT cells. Nodes are identified in the legend.
FIGURE 7
FIGURE 7
Network of differentially expressed transcripts between annulus fibrosus (AF) and nucleus pulposus (NP) cells of the IVD and adipose (FAT) stromal cells associated with the functional enrichment term signaling receptor regulator activity (GO:0030545). Networks were generated with ToppCluster and analyzed in Cytoscape. Cells were isolated from a single donor to avoid the genotype effect. Cells were analyzed as three replicates for AF and NP and two replicates for FAT cells. Nodes are identified in the legend.
FIGURE 8
FIGURE 8
Schematic of pathways involving glucose and lactate metabolism. (A) Arrows indicate differentially expressed transcripts encoding for an enzyme or transporter in cells derived from the nucleus pulposus (N), annulus fibrosus (A), or adipose (F) tissue. (B) Illustrates NP niche conditions, metabolic pathways and gradients of crucial contributors to the NP niche condition alongside their transporters. Cells were isolated from a single donor to avoid the genotype effect. Cells were analyzed as three replicates for AF and NP and two replicates for FAT cells. P, phosphate; PPP, pentose phosphate pathway; TCA, tricarboxylic acid cycle.
FIGURE 9
FIGURE 9
Schematic of pathways involving glucose and lactate metabolism leading to oxalacetate production, which modulates cell function through Fox transcription factors. Venn diagram shows the differentially expressed Fox genes between IVD (AF, NP) and adipose (FAT) derived cells. Those with a fold change of 3 or higher in NP over FAT. Arrows indicate up- or downregulation. The color scheme follows Table 3. Cells were isolated from a single donor to avoid the genotype effect. Cells were analyzed as three replicates for AF and NP and two replicates for FAT cells.
FIGURE 10
FIGURE 10
Bar graphs indicate RNA levels after BISH and ImageJ analysis of NP and FAT cells after 10 days of 3D alginate bead culture under different culture conditions for genes related to the nucleus pulposus (NP) (yellow), glucose and lactate metabolism (orange), inflammatory markers (green), cell proliferation and senescence markers, and SA-beta galactosidase staining (blue). Cells were isolated from a single donor to avoid genotype effects. A minimum of 25 cells were analyzed after subjecting three beads per probe, cell line, and condition to BISH (A). Tetrachrome-based histology of 7 μm paraffin sections of NP and FAT cells in alginate beads after 10 days of 3D alginate bead culture under different culture conditions shows the round cell morphology (B). Examples of 7 μm paraffin sections of NP and FAT cells after 10 days of 3D alginate bead culture under different culture conditions and BISH show AP-reporter gene activity for Col2a1, Pax1, and Glis1 expression (C). Example of images used for a cell count of NP and FAT cells after 10 days of 3D alginate bead culture under different culture conditions and subjection to SA-β-galactosidase stain (D). AU, arbitrary units; S, standard media D10SL. D, Media D10DL mimicking degenerate conditions. C, chondrogenic D10CL media. Significance is indicated as *** (p < 0.001); **(p < 0.01); *(p < 0.05); n indicates the number of individual cells analyzed for BISH. Scale bar represents 50 μm.

Similar articles

Cited by

References

    1. Amirdelfan K., Bae H., McJunkin T., DePalma M., Kim K., Beckworth W. J., et al. (2021). Allogeneic mesenchymal precursor cells treatment for chronic low back pain associated with degenerative disc disease: A prospective randomized, placebo-controlled 36-month study of safety and efficacy. Spine J. 21 (2), 212–230. 10.1016/j.spinee.2020.10.004 - DOI - PubMed
    1. Andriamanalijaona R., Duval E., Raoudi M., Lecourt S., Vilquin J. T., Marolleau J. P., et al. (2008). Differentiation potential of human muscle-derived cells towards chondrogenic phenotype in alginate beads culture. Osteoarthr. Cartil. 16 (12), 1509–1518. 10.1016/j.joca.2008.04.018 - DOI - PubMed
    1. Bartels E. M., Fairbank J. C., Winlove C. P., Urban J. P. (1998). Oxygen and lactate concentrations measured in vivo in the intervertebral discs of patients with scoliosis and back pain. Spine 23 (1), 1–7. 10.1097/00007632-199801010-00001 - DOI - PubMed
    1. Bastian D., Wu Y., Betts B. C., Yu X. Z. (2019). The IL-12 cytokine and receptor family in graft-vs.-host disease. Front. Immunol. 10, 988. 10.3389/fimmu.2019.00988 - DOI - PMC - PubMed
    1. Bayliss M. T., Johnstone B., O'Brien J. P. (1988). 1988 Volvo award in basic science. Proteoglycan synthesis in the human intervertebral disc. Variation with age, region and pathology. Spine 13 (9), 972–981. 10.1097/00007632-198809000-00003 - DOI - PubMed