. 2022 Nov 8;8(11):e11468.
doi: 10.1016/j.heliyon.2022.e11468. eCollection 2022 Nov.

In-process monitoring of a tissue-engineered oral mucosa fabricated on a micropatterned collagen scaffold: use of optical coherence tomography for quality control

Affiliations

In-process monitoring of a tissue-engineered oral mucosa fabricated on a micropatterned collagen scaffold: use of optical coherence tomography for quality control

O Suebsamarn et al. Heliyon. .

Abstract

Background: We previously reported a novel technique for fabricating dermo-epidermal junction (DEJ)-like micropatterned collagen scaffolds to manufacture an ex vivo produced oral mucosa equivalent (EVPOME) for clinical translation; however, more biomimetic micropatterns are required to promote oral keratinocyte-based tissue engineering/regenerative medicine. In addition, in-process monitoring for quality control of tissue-engineered products is key to successful clinical outcomes. However, evaluating three-dimensional tissue-engineered constructs such as EVPOME is challenging. This study aimed to update our technique to fabricate a more biomimetic DEJ structure of oral mucosa and to investigate the efficacy of optical coherence tomography (OCT) in combination with deep learning for non-invasive EVPOME monitoring.

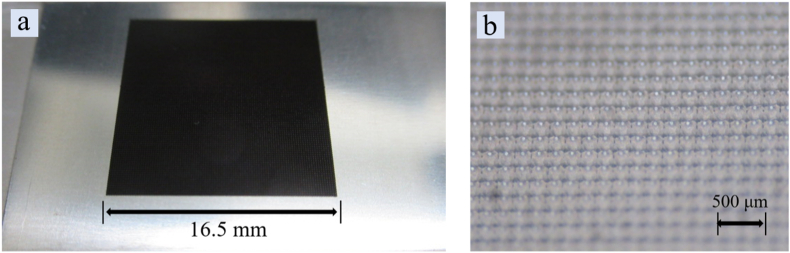
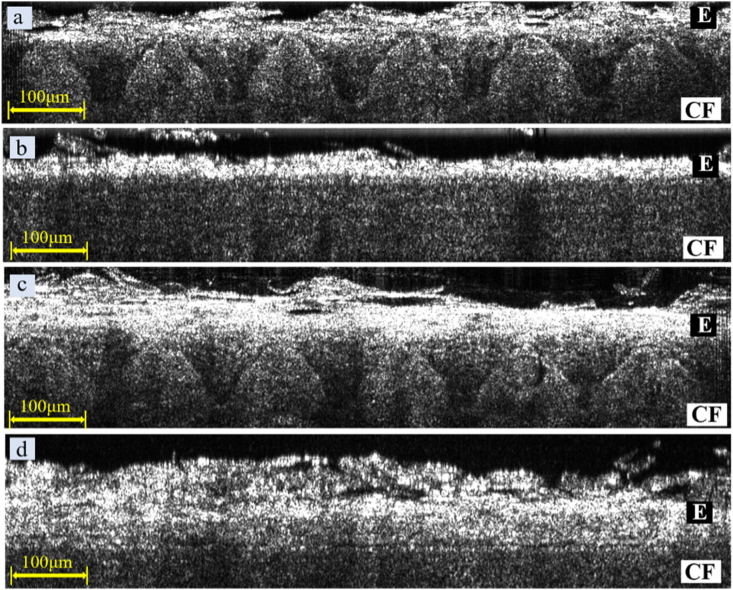
Methods: A picosecond laser-textured microstructure mimicking DEJ on stainless steel was used as a negative mould to fabricate the micropatterned collagen scaffold. During EVPOME manufacturing, OCT was applied twice to monitor the EVPOME and evaluate its epithelial thickness.

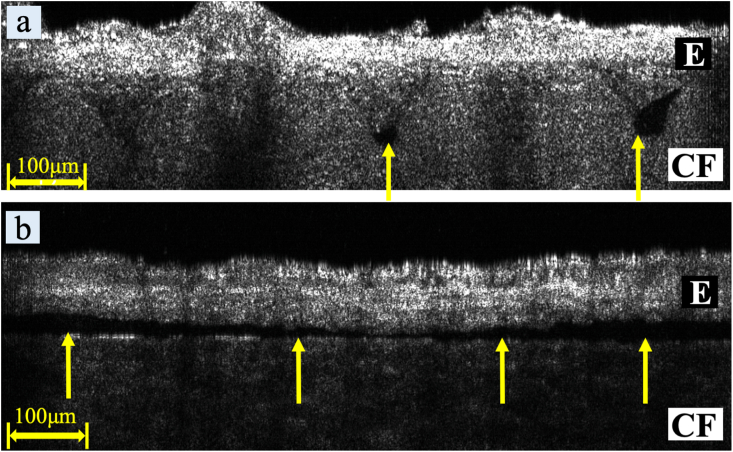
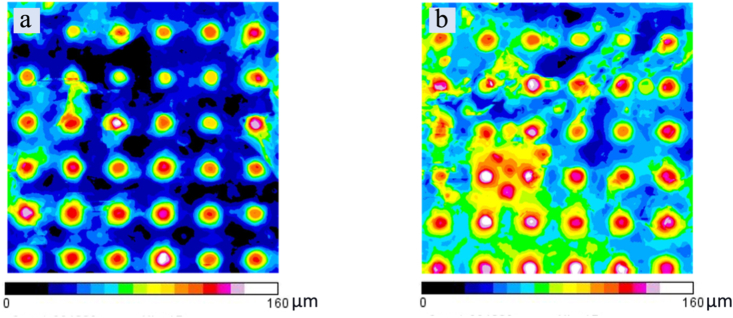
Findings: Our moulding system resulted in successful micropattern replication on the curved collagen scaffold. OCT imaging visualised the epithelial layer and the underlying micropatterned scaffold in EVPOME, enabling to non-invasively detect specific defects not found before the histological examination. Additionally, a gradual increase in epithelial thickness was observed over time.

Conclusion: These findings demonstrate the feasibility of using a stainless-steel negative mould to create a more biomimetic micropattern on collagen scaffolds and the potential of OCT imaging for quality control in oral keratinocyte-based tissue engineering/regenerative medicine.

Keywords: Biomimetics; Micropattern; Optical coherence tomography; Picosecond laser machining; Quality control; Tissue-engineered oral mucosa.


Conflict of interest statement

The authors declare no conflict of interest.

Figures

Figure 1
Figure 1
Macroscopic and microscopic views of the microstructure on a stainless-steel master negative mould fabricated by a picosecond laser machining (a) Macroscopic view of the laser-textured surface on the centre of a 50 mm × 50 mm square in size stainless-steel plate. The microstructure, a 16.5 mm × 16.5 mm square in size, was fabricated as a master negative mould. The machined area appears black due to light reflection. (b) Stereomicroscopic image of the laser-textured surface on the master negative mould.
Figure 2
Figure 2
Metrology of microstructure fabricated using a picosecond laser on a stainless-steel master negative mould (a) A representative three-dimensional heatmap showing the surface morphology of the microstructure on a stainless-steel negative mould as originally designed. Areas coloured in an orange or purple show the top and bottom of the microstructure, respectively. The colour bar indicates the depth of microstructure processed on the stainless-steel negative mould. (b) Side view of the microstructure on the line from A1 to B1 in a representative heatmap. ➀ and ➁ show the average width between the top of the square lattice and a representative point for measuring the average depth from the top of the bottom of the periodic lattice, respectively. (c) Side view of the microstructure on the line from C1 to D1 in a representative heatmap. ➂ shows a representative point for measuring the average depth of the diagonal direction of a square lattice.
Figure 3
Figure 3
Scanning electron microscopic (SEM) images of the picosecond laser-textured microstructure on stainless-steel master negative mould (a) A representative image of a top view at low (c) and (b) high magnification. (c) A representative image of a tilt (30°) view with low (a) and (d) high magnification. Scale bars indicate 500 μm in (a) and (c) and 100 μm in (b) and (d), respectively.
Figure 4
Figure 4
Macroscopic view and SEM images of micropatterned fish-scale collagen scaffolds (a) Macroscopic view of micropatterned collagen scaffold fabricated from the stainless-steel master negative mould. Compared with the non-patterned collagen scaffold, the D-PBS on the micropatterned surface is well-drained. The scale bar indicates 5 mm. (b) A representative SEM image of a micropattern fabricated on the collagen scaffold at low magnification. The scale bar indicates 500 μm. (c) A representative SEM image of a micropattern fabricated on the collagen scaffold at high magnification. The scale bar indicates 100 μm.
Figure 5
Figure 5
Representative cross-sectional images (X-Z slice) obtained from OCT scanning at an identical ROI on day 8 and 11 EVPOMEs manufactured on micropatterned and non-patterned collagen scaffolds (a) OCT image of day 8 EVPOME manufactured on a micropatterned collagen scaffold, (b) OCT image of day 8 EVPOME manufactured on a non-patterned collagen scaffold, (c) OCT image of day 11 EVPOME manufactured on a micropatterned collagen scaffold, (d) OCT image of day 11 EVPOME manufactured on a non-patterned collagen scaffold E, epithelial layer, CF, collagen scaffold. Scales bar = 100 μm.
Figure 6
Figure 6
OCT images showing a weak signal between the epithelial layer and the underlying scaffold (a) OCT image of day 11 EVPOME manufactured on a micropatterned collagen scaffold (b) OCT image of day 11 EVPOME manufactured on a non-patterned collagen scaffold. Small spots (a) and the linear gap (b) show a weak light-scattered signal beneath the epithelial layer (yellow arrows). During manufacturing, these specific EVPOME infrastructures could not be detected until completing the histological examination, indicating possible EVPOME defectives. E, epithelial layer, CF, collagen scaffold. Scale bars = 100 μm.
Figure 7
Figure 7
Heatmap images of ROI in day 8 and day 11 EVPOMEs depicting the epithelial layer thickness formed on a micropatterned collagen scaffold. (a) A representative heatmap depicting epithelial thickness of ROI at day 8 EVPOME (b) A representative heatmap depicting epithelial thickness of ROI at day 11 EVPOME. Warm-coloured circular areas periodically arranged with square lattice indicate the structure of the epithelial rete ridge corresponding to the micropattern trough on the scaffold. The colouration changes from day 8 to day 11 of EVPOME implies an increase in epithelial thickness over time. Epithelial thickness was indicated by a colour bar.
Figure 8
Figure 8
Quantitative analysis of average epithelial thickness and a representative histogram showing distribution of epithelial thickness between day 8 and day 11 EVPOMEs generated on a micropatterned collagen scaffold (a) A dot plot showing the average epithelial thickness of ROI on days 8 and 11 EVPOMEs generated on a micropatterned collagen scaffold (N = 9). The red line indicates the average of a total of nine specimens. There was a significant difference in the average epithelial thickness between day 8 and day 11 EVPOMEs, demonstrating the increase in epithelial thickness over time. (b) A representative histogram showing epithelial thickness of day 8 EVPOME. (c) A representative histogram showing epithelial thickness of day 11 EVPOME. Compared with day 8 EVPOME, the peak of the histogram shifts to the right, indicating a gradual increase in epithelial thickness. Those data were non-invasively acquired from OCT imaging.
Figure 9
Figure 9
Macroscopic and microscopic appearance of day 11 EVPOME fabricated on a micropatterned and a non-patterned collagen scaffold (a) Representative macroscopic image of day 11 EVPOME generated on a micropatterned collagen scaffold before fixation (Scale bar = 5 mm). (b) Representative macroscopic image of day 11 EVPOME generated on a non-patterned collagen scaffold before fixation (Scale bar = 5 mm) The epithelial layer (∗) was shrunk by day 11 in six out of nine specimens. Consequently, the scaffold’s flat surface was partially exposed (black arrows), suggesting epithelial layer detachment from the underlying scaffold. (c) Representative microscopic image of day 11 EVPOME generated on a micropatterned collagen scaffold. A continuous, well-differentiated epithelial layer was formed with rete-ridge structures corresponding to the scaffold micropattern. The micropattern shape resembles that of the stainless-steel master negative mould. The entire morphological architecture was similar to that of the native oral mucosa. At the bottom of the collagen scaffold, the Indian ink used to mark the ROI area was seen before fixation on day 11. Original magnification × 20 (Scale bar = 100 μm). (d) Representative microscopic image of day 11 EVPOME generated on a nonpatterned collagen scaffold. A linear space is observed between the epithelial layer and the underlying flat collagen scaffold, suggesting epithelial detachment, consistent with the OCT image in Figure 6 (b). At the bottom of the collagen scaffold, the Indian ink used to mark the ROI area was seen before fixation on day 11. Original magnification × 20 (Scale bar = 100 μm).

Similar articles

Cited by

References

    1. Almansoori A.A., Kim B., Lee J.H., Tran S.D. Tissue engineering of oral mucosa and salivary gland: disease modeling and clinical applications. Micromachines. 2020;11(12) - PMC - PubMed
    1. Cao L., Su H., Si M., Xu J., Chang X., Lv J., et al. Tissue engineering in stomatology: a review of potential approaches for oral disease treatments. Front. Bioeng. Biotechnol. 2021;9 - PMC - PubMed
    1. O'Brien F.J. Biomaterials & scaffolds for tissue engineering. Mater. Today. 2011;14(3):88–95.
    1. Grayson W.L., Martens T.P., Eng G.M., Radisic M., Vunjak-Novakovic G. Biomimetic approach to tissue engineering. Semin. Cell Dev. Biol. 2009;20(6):665–673. - PMC - PubMed
    1. Cheung A. Biomimetic scaffolds for skin and skeletal tissue engineering. J. Biotechnol. Biomater. 2015;5

LinkOut - more resources