

A Method to Explore Variations of Ventilator-Associated Event Surveillance Definitions in Large Critical Care Databases in the United States
- PMID: 36406886
- PMCID: PMC9668560
- DOI: 10.1097/CCE.0000000000000790
A Method to Explore Variations of Ventilator-Associated Event Surveillance Definitions in Large Critical Care Databases in the United States
Abstract
The Centers for Disease Control has well-established surveillance programs to monitor preventable conditions in patients supported by mechanical ventilation (MV). The aim of the study was to develop a data-driven methodology to examine variations in the first tier of the ventilator-associated event surveillance definition, described as a ventilator-associated condition (VAC). Further, an interactive tool was designed to illustrate the effect of changes to the VAC surveillance definition, by applying different ventilator settings, time-intervals, demographics, and selected clinical criteria.
Design: Retrospective, multicenter, cross-sectional analysis.
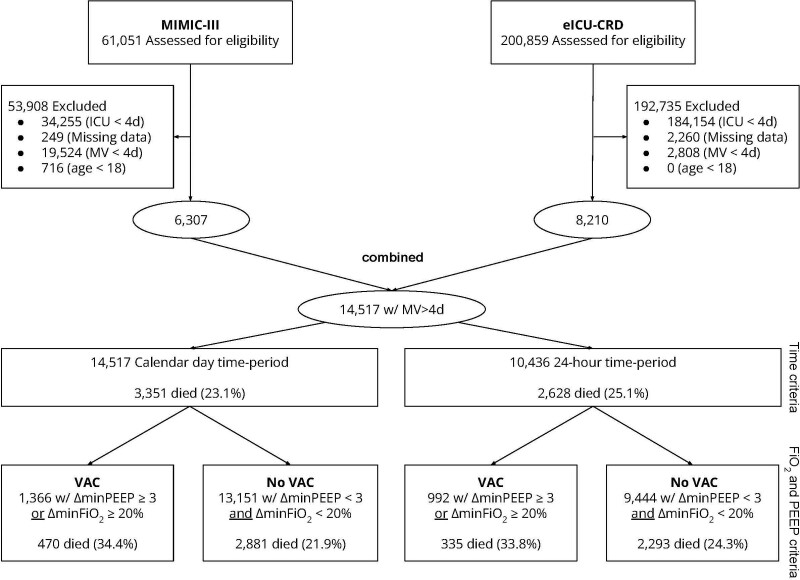
Setting: Three hundred forty critical care units across 209 hospitals, comprising 261,910 patients in both the electronic Intensive Care Unit Clinical Research Database and Medical Information Mart for Intensive Care III databases.
Patients: A total of 14,517 patients undergoing MV for 4 or more days.
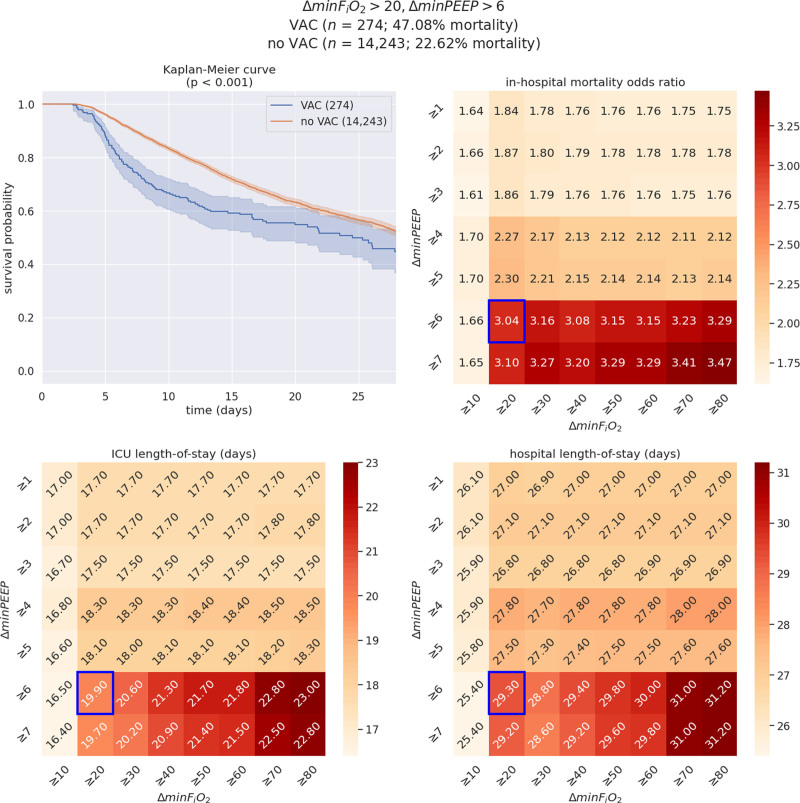
Measurements and main results: We designed a statistical analysis framework, complemented by a custom interactive data visualization tool to depict how changes to the VAC surveillance definition alter its prognostic performance, comparing patients with and without VAC. This methodology and tool enable comparison of three clinical outcomes (hospital mortality, hospital length-of-stay, and ICU length-of-stay) and provide the option to stratify patients by six criteria in two categories: patient population (dataset and ICU type) and clinical features (minimum Fio2, minimum positive end-expiratory pressure, early/late VAC, and worst first-day respiratory Sequential Organ Failure Assessment score). Patient population outcomes were depicted by heatmaps with mortality odds ratios. In parallel, outcomes from ventilation setting variations and clinical features were depicted with Kaplan-Meier survival curves.
Conclusions: We developed a method to examine VAC using information extracted from large electronic health record databases. Building upon this framework, we developed an interactive tool to visualize and quantify the implications of variations in the VAC surveillance definition in different populations, across time and critical care settings. Data for patients with and without VAC was used to illustrate the effect of the application of this method and visualization tool.
Keywords: data science; mechanical; pneumonia; surveillance; ventilator-associated; ventilator-associated condition; ventilator-associated event; ventilators.
Copyright © 2022 The Authors. Published by Wolters Kluwer Health, Inc. on behalf of the Society of Critical Care Medicine.
Figures

References
-
- Tablan OC, Anderson LJ, Arden NH, et al. : Guideline for prevention of nosocomial pneumonia. Infect Control Hosp Epidemiol 1994; 15:587588–587627 - PubMed
-
- Klompas M: Ventilator-associated events: What they are and what they are not. Respir Care 2019; 64:953–961 - PubMed
-
- ACH Surveillance for VAE. NHSN | CDC. 2020. Available at: https://www.cdc.gov/nhsn/acute-care-hospital/vae/index.html. Accessed June 8, 2020
-
- Ventilator-associated Events (VAE) [Internet]. 2021. Available at: https://www.cdc.gov/nhsn/psc/vae/index.html. Accessed February 15, 2022
LinkOut - more resources
Full Text Sources
