. 2022 Nov 3:13:1032447.
doi: 10.3389/fphys.2022.1032447. eCollection 2022.

Elevated Ca2+ at the triad junction underlies dysregulation of Ca2+ signaling in dysferlin-null skeletal muscle

Affiliations

Elevated Ca2+ at the triad junction underlies dysregulation of Ca2+ signaling in dysferlin-null skeletal muscle

Valeriy Lukyanenko et al. Front Physiol. .

Abstract

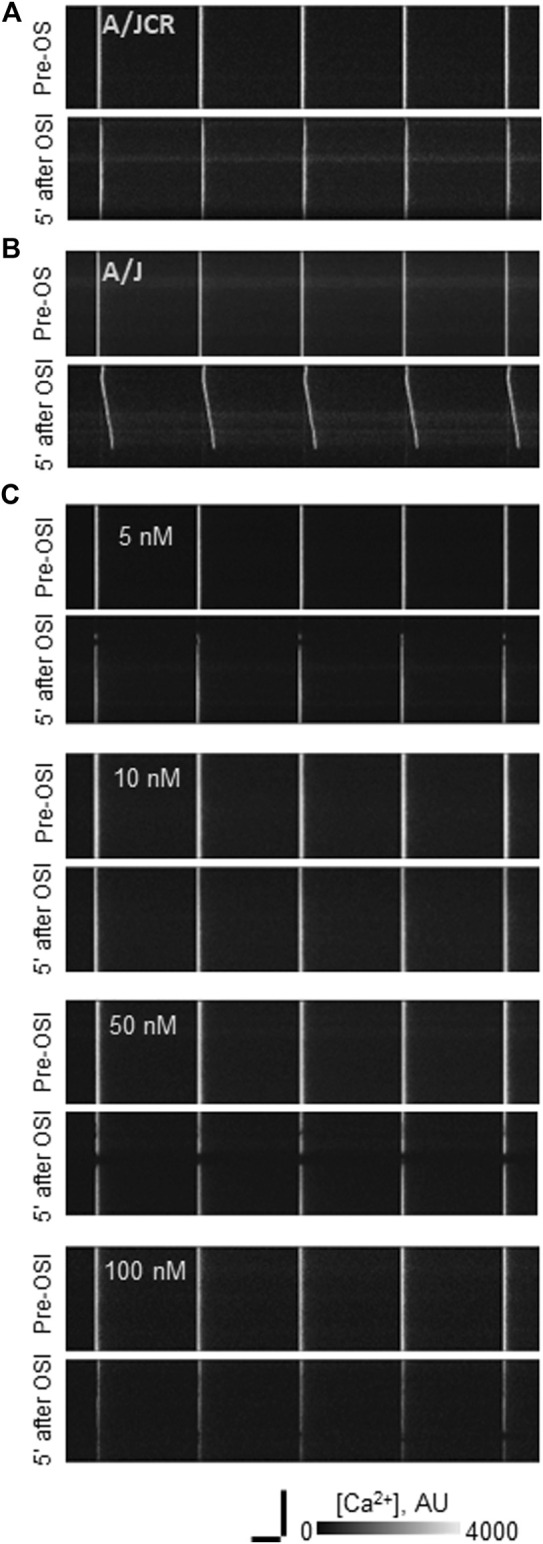
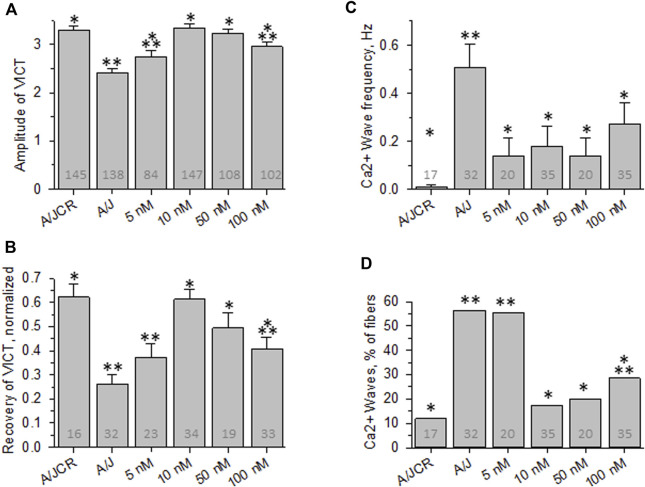
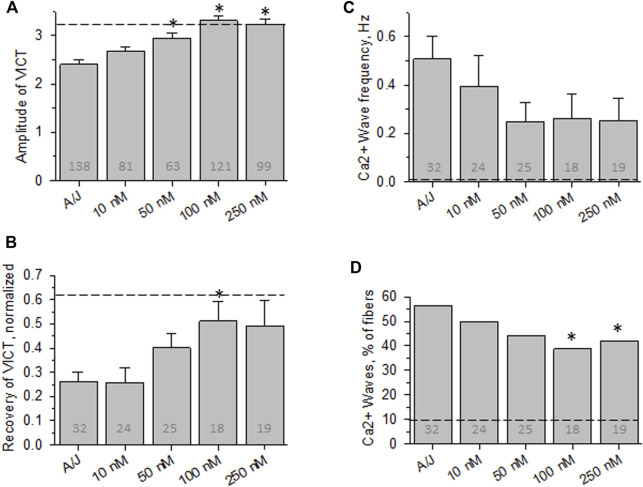
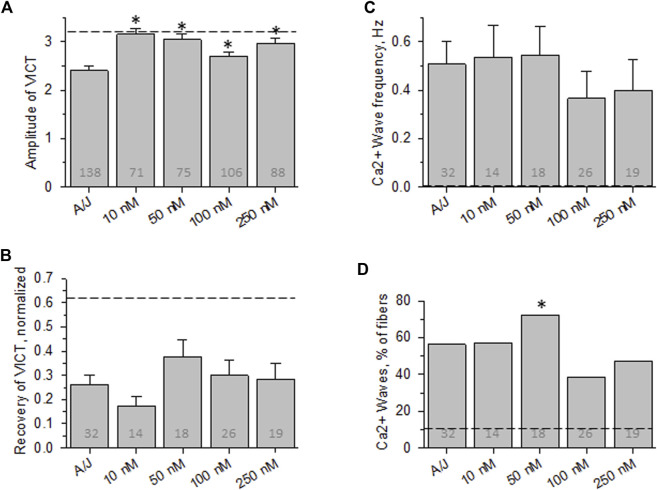
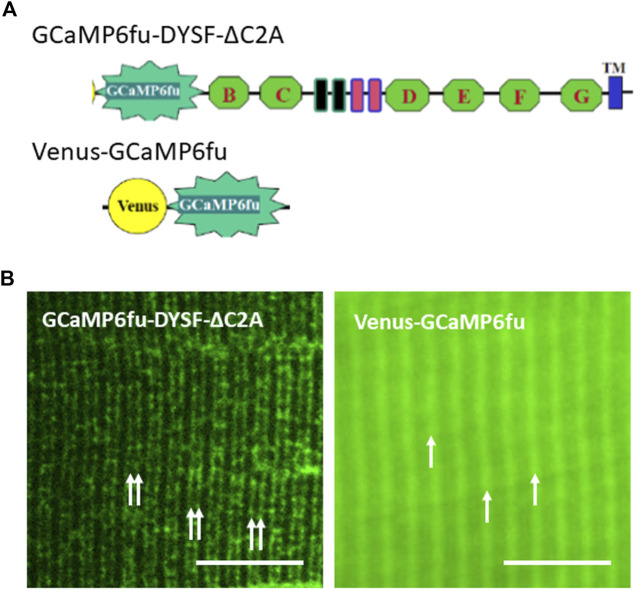
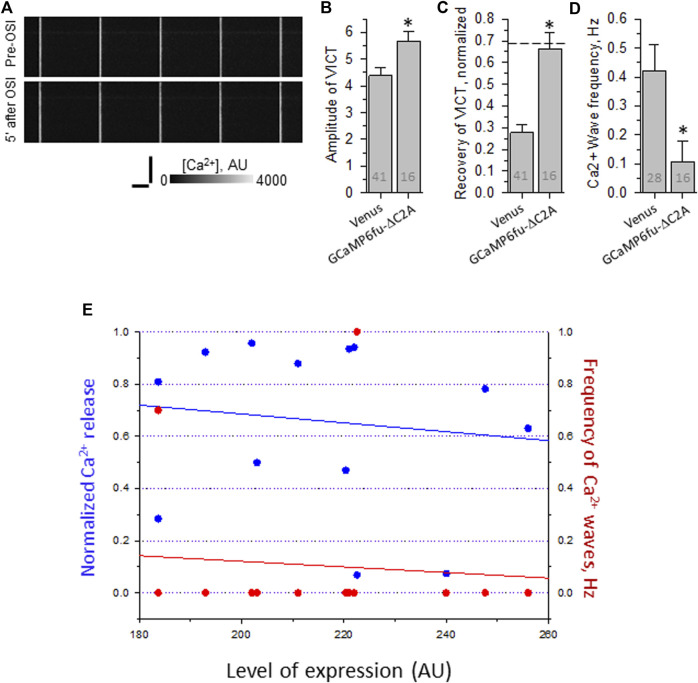
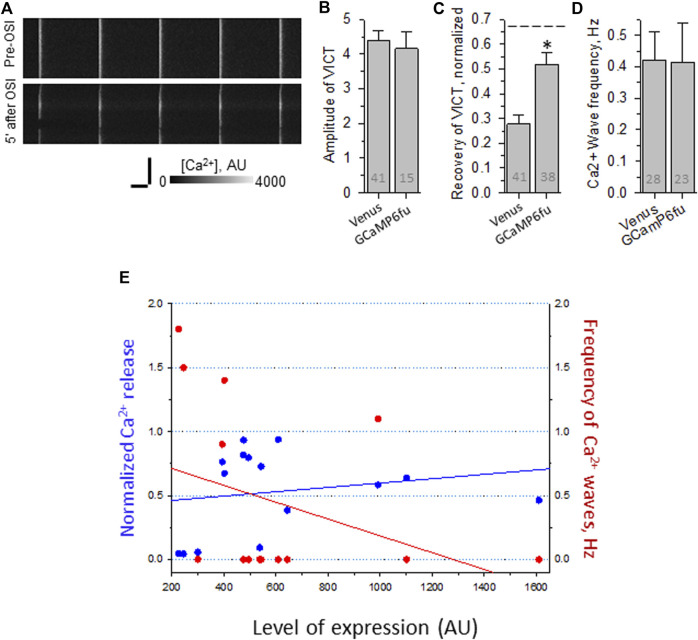
Dysferlin-null A/J myofibers generate abnormal Ca2+ transients that are slightly reduced in amplitude compared to controls. These are further reduced in amplitude by hypoosmotic shock and often appear as Ca2+ waves (Lukyanenko et al., J. Physiol., 2017). Ca2+ waves are typically associated with Ca2+-induced Ca2+ release, or CICR, which can be myopathic. We tested the ability of a permeable Ca2+ chelator, BAPTA-AM, to inhibit CICR in injured dysferlin-null fibers and found that 10-50 nM BAPTA-AM suppressed all Ca2+ waves. The same concentrations of BAPTA-AM increased the amplitude of the Ca2+ transient in A/J fibers to wild type levels and protected transients against the loss of amplitude after hypoosmotic shock, as also seen in wild type fibers. Incubation with 10 nM BAPTA-AM led to intracellular BAPTA concentrations of ∼60 nM, as estimated with its fluorescent analog, Fluo-4AM. This should be sufficient to restore intracellular Ca2+ to levels seen in wild type muscle. Fluo-4AM was ∼10-fold less effective than BAPTA-AM, however, consistent with its lower affinity for Ca2+. EGTA, which has an affinity for Ca2+ similar to BAPTA, but with much slower kinetics of binding, was even less potent when introduced as the -AM derivative. By contrast, a dysferlin variant with GCaMP6fu in place of its C2A domain accumulated at triad junctions, like wild type dysferlin, and suppressed all abnormal Ca2+ signaling. GCaMP6fu introduced as a Venus chimera did not accumulate at junctions and failed to suppress abnormal Ca2+ signaling. Our results suggest that leak of Ca2+ into the triad junctional cleft underlies dysregulation of Ca2+ signaling in dysferlin-null myofibers, and that dysferlin's C2A domain suppresses abnormal Ca2+ signaling and protects muscle against injury by binding Ca2+ in the cleft.

Keywords: BAPTA; CICR; Ca-induced Ca release; GCaMP; dysferlinopathy; injury; osmotic shock.


Conflict of interest statement

LB is employed by Regeneron Pharmaceuticals. The remaining authors declare that the research was conducted in the absence of any commercial or financial relationships that could be construed as a potential conflict of interest.

Figures

FIGURE 1
FIGURE 1
Effect of osmotic shock injury on Ca2+ transients in FDB fibers preloaded with different concentrations of BAPTA-AM. A/J or A/JCr myofibers were loaded with Rhod-2AM, with or without additional BAPTA-AM, subjected to 1 Hz stimulation, and imaged in line-scan mode under confocal optics (see Methods). Representative line-scan confocal images of voltage-induced Ca2+ transients in A/JCr (A) and sham (vehicle only) A/J [(B): A/J] fibers and in A/J fibers preloaded with BAPTA-AM at 5, 10, 50 and 100 nM (C). All examples in (B,C) were exposed to equal amounts of DMSO (1.5% by volume). All examples are shown before osmotic shock injury (OSI) and 5 min after OSI. Bars, 100 µm (vertical) and 250 ms (horizontal).
FIGURE 2
FIGURE 2
Effect of osmotic shock injury on Ca2+ transients in FDB fibers preloaded with different concentrations of BAPTA-AM. Data from experiments like those shown in Figure 1 were analyzed. (A), averaged amplitudes of Ca2+ transients before OSI presented as (Fmax-F0)/F0. (B), averaged data for recovery of Ca2+ transients at 5 min after OSI. (C), averaged data for frequency of Ca2+ waves at 5 min after OSI. (D), % fibers that produced Ca2+ waves at 5 min after OSI. N is indicated in each bar. *. p < 0.05 compared to A/J (sham). **, p < 0.05 compared to A/JCr control. Student’s t test was used for A-C; Χ 2 was used for (D). VICT = Voltage-induced Ca2+ transient.
FIGURE 3
FIGURE 3
Effect of osmotic shock injury on Ca2+ transients in A/J FDB fibers preloaded with different concentrations of Fluo-4AM. As in Figure 2, but with myofibers loaded with Fluo-4AM. (A), averaged amplitudes of Ca2+ release before OSI presented as (Fmax-F0)/F0. (B), averaged data for recovery of Ca2+ transients at 5 min after OSI. (C), averaged data for frequency of Ca2+ waves at 5 min after OSI. (D), % fibers that produced Ca2+ waves at 5 min after OSI. Dashed lines represent values obtained with A/JCr fibers. *, p < 0.05 compared to A/J. N is indicated in each bar. Student’s t test was used for (A–C); Χ 2 was used for (D). VICT = Voltage-induced Ca2+ transient.
FIGURE 4
FIGURE 4
Effect of osmotic shock injury on Ca2+ transients in A/J FDB fibers preloaded with different concentrations of EGTA-AM. As in Figure 2, but with myofibers loaded with EGTA-AM. (A), averaged amplitudes of Ca2+ release before OSI presented as (Fmax-F0)/F0. (B), averaged data for recovery of Ca2+ transients at 5 min after OSI. (C), averaged data for frequency of Ca2+ waves at 5 min after OSI. (D), % fibers that produced Ca2+ waves at 5 min after OSI. Dashed lines represent values obtained with A/JCr fibers. *, p < 0.05 compared to A/J. N is indicated in each bar. Student’s t test was used for (A–C); Χ 2 was used for (D)
FIGURE 5
FIGURE 5
Distributions of GCaMP6fu and GCaMP6fu-DYSF-ΔC2A in sarcoplasm. (A). Cartoon diagrams of chimeric structures, which include the CMV promoter, the GCaMP6fu reporter, and, for GCaMP6fu-DYSF-ΔC2A, the dysferlin ORF excluding most of the C2A domain (i.e., residues 108–2080) but including the remaining C2 domains B thought G (green hexagons), the Fer and DysF domains in the middle of the molecule (blue and pink outlined rectangles) and the transmembrane domain (blue rectangle near the C terminus; see Methods). (B). Subcellular distribution of Venus-GCaMP6fu and GCaMP6fu-DYSF-ΔC2A in transfected A/J myofibers. Plasmids were electroporated into A/J myofibers and imaged under confocal optics 2 weeks later. Double arrows: transverse tubules at level of triad junctions, as reported (Kerr et al., 2013; Muriel et al., 2022); single arrows: Z-disks, as reported (Muriel et al., 2022). Bars, 10 µm.
FIGURE 6
FIGURE 6
Effect of osmotic shock injury on Ca2+ transients in A/J FDB fibers transfected with GCaMP6fu-Dysf-ΔC2A. Myofibers were transfected by electroporation. Two weeks later, they were loaded with Rhod-2AM and assayed as in Figure 2. (A), representative line-scan images of Ca2+ transients before and 5 min after OSI, as in Figure 1. (B), averaged amplitudes of Ca2+ release before OSI for A/J fibers transfected with Venus or with GCaMP6fu-Dysf-ΔC2A. (C), averaged data for recovery of Ca2+ transients from OSI for A/J fibers transfected with Venus or with GCaMP6fu-Dysf-ΔC2A at 5 min after OSI. Dashed line represents recovery in A/J fibers transfected with WT dysferlin. (D), averaged data for frequency of Ca2+ waves at 5 min after OSI. N is indicated in each bar. Student’s t test was used for (A–C); Χ 2 was used for (D) *, p < 0.05 compared to A/J fibers transfected with Venus. (E). Recovery from OSI and frequency of Ca2+ waves as a function of GCaMP6fu-DYSF-ΔC2A expression. GCaMP6fu-DYSF-ΔC2A levels were determined in AU by measuring the intensity of the GCaMP6fu fluorescence, after setting the background autofluorescence to 180 AU. For earlier data for A/J fibers expressing Venus- Dysf-ΔC2A, see Muriel et al., 2022.
FIGURE 7
FIGURE 7
Effect of OSI on Ca2+ transients in A/J FDB fibers transfected with Venus-GCaMP6fu. Myofibers were transfected by electroporation. Two weeks later, they were loaded with Rhod-2AM and assayed as in Figure 2. (A), representative line-scan images of Ca2+ transients before and 5 min after OSI. (B), averaged amplitudes of Ca2+ release before OSI for A/J fibers transfected with Venus or with Venus-GCaMP6fu. (C), averaged data for recovery of Ca2+ transients from OSI for A/J fibers transfected with Venus or with Venus-GCaMP6fu at 5 min after OSI. The dashed line represents recovery in A/J fibers transfected with WT dysferlin. (D), averaged data for frequency of Ca2+ waves at 5 min after OSI. N is indicated in each bar. Student’s t test was used for (A–C); Χ 2 was used for (D) *, p < 0.05 compared to A/J fibers transfected with Venus. (E). Recovery from OSI and frequency of Ca2+ waves as a function of Venus-GCaMP6fu expression. Panels B–D show results obtained by imaging either Rhod-2 or GCaMP6fu fluorescence. Panel E shows results obtained only with Rhod-2. Venus-GCaMP6fu levels were determined in AU by measuring the intensity of the Venus fluorescence, after setting the background autofluorescence to 200 AU. For earlier data with A/J fibers expressing Venus alone, see Lukyanenko et al., 2017).
FIGURE 8
FIGURE 8
RyR1 but not RyR2 or RyR3 are expressed in fast twitch skeletal muscle. Immunoblots of extracts of Tibialis anterior muscles with antibodies to RyR1, RyR2, and RyR3. Only anti-RyR1 shows a strong band at ∼550 kDa.

Similar articles

Cited by

References

    1. Abdullah N., Padmanarayana M., Marty N. J., ohnson C J. (2014). Quantitation of the calcium and membrane binding properties of the C2 domains of dysferlin. Biophys. J. 106, 382–389. 10.1016/j.bpj.2013.11.4492 - DOI - PMC - PubMed
    1. Ainbinder A., Boncompagni S., Protasi F., Dirksen R. T. (2015). Role of mitofusin-2 in mitochondrial localization and calcium uptake in skeletal muscle. Cell Calcium 57, 14–24. 10.1016/j.ceca.2014.11.002 - DOI - PMC - PubMed
    1. Allen D. G., Gervasio O. L., Yeung E. W., Whitehead N. P. (2010). Calcium and the damage pathways in muscular dystrophy. Can. J. Physiol. Pharmacol. 88, 83–91. 10.1139/Y09-058 - DOI - PubMed
    1. Amato A. A., Brown R. H., (2011). Handb. Clin. Neurol. 101, 111–118. 10.1016/B978-0-08-045031-5.00007-4 - DOI - PubMed
    1. Anderson K., Meissner G. (1995). T-tubule depolarization-induced SR Ca2+ release is controlled by dihydropyridine receptor- and Ca2+-dependent mechanisms in cell homogenates from rabbit skeletal muscle. J. Gen. Physiol. 105, 363–383. 10.1085/jgp.105.3.363 - DOI - PMC - PubMed