. 2022 Nov 4:5:1016606.
doi: 10.3389/fdata.2022.1016606. eCollection 2022.

WINNER: A network biology tool for biomolecular characterization and prioritization

Affiliations

WINNER: A network biology tool for biomolecular characterization and prioritization

Thanh Nguyen et al. Front Big Data. .

Abstract

Background and contribution: In network biology, molecular functions can be characterized by network-based inference, or "guilt-by-associations." PageRank-like tools have been applied in the study of biomolecular interaction networks to obtain further the relative significance of all molecules in the network. However, there is a great deal of inherent noise in widely accessible data sets for gene-to-gene associations or protein-protein interactions. How to develop robust tests to expand, filter, and rank molecular entities in disease-specific networks remains an ad hoc data analysis process.

Results: We describe a new biomolecular characterization and prioritization tool called Weighted In-Network Node Expansion and Ranking (WINNER). It takes the input of any molecular interaction network data and generates an optionally expanded network with all the nodes ranked according to their relevance to one another in the network. To help users assess the robustness of results, WINNER provides two different types of statistics. The first type is a node-expansion p-value, which helps evaluate the statistical significance of adding "non-seed" molecules to the original biomolecular interaction network consisting of "seed" molecules and molecular interactions. The second type is a node-ranking p-value, which helps evaluate the relative statistical significance of the contribution of each node to the overall network architecture. We validated the robustness of WINNER in ranking top molecules by spiking noises in several network permutation experiments. We have found that node degree-preservation randomization of the gene network produced normally distributed ranking scores, which outperform those made with other gene network randomization techniques. Furthermore, we validated that a more significant proportion of the WINNER-ranked genes was associated with disease biology than existing methods such as PageRank. We demonstrated the performance of WINNER with a few case studies, including Alzheimer's disease, breast cancer, myocardial infarctions, and Triple negative breast cancer (TNBC). In all these case studies, the expanded and top-ranked genes identified by WINNER reveal disease biology more significantly than those identified by other gene prioritizing software tools, including Ingenuity Pathway Analysis (IPA) and DiAMOND.

Conclusion: WINNER ranking strongly correlates to other ranking methods when the network covers sufficient node and edge information, indicating a high network quality. WINNER users can use this new tool to robustly evaluate a list of candidate genes, proteins, or metabolites produced from high-throughput biology experiments, as long as there is available gene/protein/metabolic network information.

Keywords: gene prioritization; network biology; network expansion; network statistical analysis; pathway analysis.


Conflict of interest statement

The authors declare that the research was conducted in the absence of any commercial or financial relationships that could be construed as a potential conflict of interest.

Figures

Figure 1
Figure 1
WINNER gene prioritization is well-correlated with other ranking techniques and most network topological metrics. Genes in the KEGG AD pathway were ranked via WINNER (WN), PageRank (PG), Dual Node-edge Rank (DR), Betweenness Centrality (BC), clustering coefficient (CC), eigenvector centrality (EV), and node degree (ND); then, the correlation coefficients for all pairwise comparisons between ranking methods were calculated via Pearson's correlation.
Figure 2
Figure 2
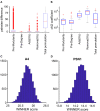
With WINNER, Node-degree–preservation and modularity preservation yields more normally distributed randomized networks. Genes in the KEGG AD pathway were ranked via WINNER; then, the ranked networks were randomized via: preserving node degree (Pre-Degree), preserving modularity (Pre-Modularity), adding 5% interactions [Add (5%)], removing 5% of the interactions [Remove (5%)], and total network permutation. (A) The (pairwise) difference between the original network ranking score and the random network ranking score; smaller difference implies the random network approach is more likely to preserve the original network topology. (B) Chi-square (chi2coef) coefficient in chi2gof test (https://www.mathworks.com/help/stats/chi2gof.html). Smaller chi2coef implies that the random ranking is more normally distributed. The (+) signs in the boxplots imply outliners (outside 2 and 98% percentiles). Under random network by preserving node degree, WINNER ranking distributions are in bell-shape for two important AD-related genes: A4 (C) and PSN1 (D).
Figure 3
Figure 3
The WINNER ranking p-value (pr) is robust to the addition of noise (STATS?). Genes in all KEGG pathways were ranked via WINNER, and WINNER ranking p-values (pr) were calculated, after varying degrees of noise were added to the network; then, noise robustness was compared for genes with pr < 0.05 and pr ≥ 0.05 by determining the likelihood that the gene's ranking changed by 10 or more upon the addition of noise.
Figure 4
Figure 4
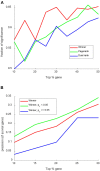
WINNER gene prioritization more accurately identifies the relationship between breast-cancer genes and patient survival. Genes in the KEGG breast-cancer pathway were ranked via WINNER, PageRank, and Dual Rank, and the significance of each gene's relationship to patient survival was determined with an online Kaplan-Meier plotting tool. (A) The proportion of genes that were significantly (p < 0.05) related to breast-cancer survival was determined for the top 0-50% of ranked genes. (B) The precision of the WINNER ranking of genes for breast-cancer survival (Bland and Altman, 1998) was compared for the top 0–30% of ranked genes with pr < 0.05 and pr ≥ 0.05.
Figure 5
Figure 5
WINNER upstream prioritization more accurately identifies the relative position of genes in a pathway. Gene-gene regulatory relationships from STRING v.10.5 were used to distribute genes from all KEGG cancer pathways into 7 layers via WINNER (customized for upstream ranking), PageRank, and Dual Rank; genes coding for proteins that function further upstream in the pathways were assigned to the lower-numbered layers. Layers 1–3 are the most upstream layers, usually correspond to the kineases, grow factors, and receptors. Layers 4–7 are downstream, usually correspond to signaling hubs, phospholization, transcription factors, and inside-nucleus genes. The y axis indicates the ranking scores, which were converted into percentile so that the rankings across different pathways could be combined into one boxplot. The red cross implies boxplot outliners (beyond 2 and 98% percentiles). (A) WINNER upstream rank. (B) PageRank. (C) Dual node-edge rank.
Figure 6
Figure 6
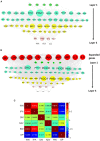
WINNER upstream ranking and expansion can identify genes that are missing from established chronic myeloid leukemia (CML) networks. Genes in the KEGG CML pathways were distributed into layers via WINNER upstream, and genes that were missing from the networks were identified via WINNER expansion. Genes in the same layer are displayed in the same color, and the size of the node represents the WINNER score. (A) WINNER ranking without expansion. (B) WINNER ranking with expanded genes. (C) Correlation among WINNER (WN), Igenunity Pathway Analysis (IPA), DIAMOnD (DM), Node2Vec (ND), Random Walk (RW), and GenePANDA (GP) ranking.
Figure 7
Figure 7
WINNER upstream ranking and expansion can identify genes that are missing from established hepatocellular carcinoma networks. Genes in the KEGG hepatocellular carcinoma pathways were distributed into layers via WINNER upstream, and genes that were missing from the networks were identified via WINNER expansion. Genes in the same layer are displayed in the same color, and the size of the node represents the WINNER score. (A) WINNER ranking without expansion. (B) WINNER ranking with expanded genes.
Figure 8
Figure 8
Benchmark: WINNER expansion more accurately identifies the addition of new genes to established networks. The pathway networks in KEGG (https://www.genome.jp/kegg/network.html) release 50 was expanded via WINNER (i.e., calculation of the WINNER expansion p-value), Ingenuity Pathway Analysis (IPA), DIAMoND, Random Walk, Node2Vec, and GenePANDA. Then, the expanded networks were compared to the updated network in KEGG release 85 to determine the precision, recall, and F1 scores for each expansion technique.
Figure 9
Figure 9
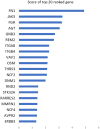
WINNER can identify genes that contribute to cardiac regeneration from a list of differentially expressed genes. RNA-sequencing analyses of gene expression in the hearts of piglets that had or had not undergone surgically induced myocardial infarction on the 1st day after birth for a previous report (Zhu et al., 2018) were compared to generate a list of differentially expressed genes; then their gene-gene interactions were queried from HAPPI v2 database; then, the list was ranked via WINNER gene prioritization to determine which genes likely contributed to myocardial regeneration. The 20 top-ranked genes are displayed with their corresponding WINNER scores.
Figure 10
Figure 10
The literature validation of triple negative breast cancer genes using co-citations from PubMed. The co-citations of gene and TNBC are grouped by the WINNER reported p-values. The non-significant gene p-values are larger than 0.05 in WINNER, and the significant gene p-values are ≤ 0.05 in WINNER. The Kruskal Wallis test p-value is 0.027.
Figure 11
Figure 11
The correlation between the add-on pathways enriched in the top 2x bins and the bin size. The violin plot shows the pathway level distribution. The red points connected by solid red lines are the means of pathway levels.

Similar articles

Cited by

References

    1. Aerts S., Lambrechts D., Maity S., Van Loo P., Coessens B., De Smet F., et al. . (2006). Gene prioritization through genomic data fusion. Nat. Biotechnol. 24, 537–544. 10.1038/nbt1203 - DOI - PubMed
    1. Alvarez-Ponce D., Lopez P., Bapteste E., McInerney J. O. (2013). Gene similarity networks provide tools for understanding eukaryote origins and evolution. Proc. Natl. Acad. Sci. U. S. A. 110, E1594–1603. 10.1073/pnas.1211371110 - DOI - PMC - PubMed
    1. Anders S., Pyl P. T., Huber W. (2015). HTSeq–a Python framework to work with high-throughput sequencing data. Bioinformatics 31, 166–169. 10.1093/bioinformatics/btu638 - DOI - PMC - PubMed
    1. Antanaviciute A., Daly C., Crinnion L. A., Markham A. F., Watson C. M., Bonthron D. T., et al. . (2015). GeneTIER: prioritization of candidate disease genes using tissue-specific gene expression profiles. Bioinformatics 31, 2728–2735. 10.1093/bioinformatics/btv196 - DOI - PMC - PubMed
    1. Beissbarth T., Speed T. P. (2004). GOstat: find statistically overrepresented Gene Ontologies within a group of genes. Bioinformatics 20, 1464–1465. 10.1093/bioinformatics/bth088 - DOI - PubMed