

Prediction of major adverse cardiovascular events in patients with acute coronary syndrome: Development and validation of a non-invasive nomogram model based on autonomic nervous system assessment
- PMID: 36407419
- PMCID: PMC9670131
- DOI: 10.3389/fcvm.2022.1053470
Prediction of major adverse cardiovascular events in patients with acute coronary syndrome: Development and validation of a non-invasive nomogram model based on autonomic nervous system assessment
Abstract
Background: Disruption of the autonomic nervous system (ANS) can lead to acute coronary syndrome (ACS). We developed a nomogram model using heart rate variability (HRV) and other data to predict major adverse cardiovascular events (MACEs) following emergency coronary angiography in patients with ACS.
Methods: ACS patients admitted from January 2018 to June 2020 were examined. Holter monitors were used to collect HRV data for 24 h. Coronary angiograms, clinical data, and MACEs were recorded. A nomogram was developed using the results of Cox regression analysis.
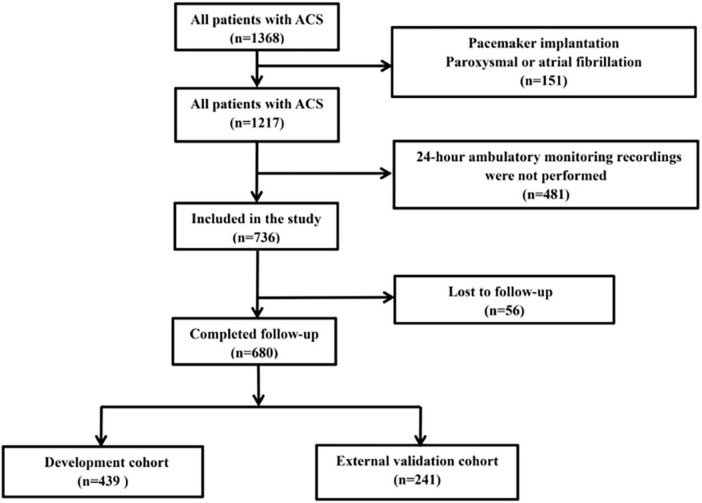
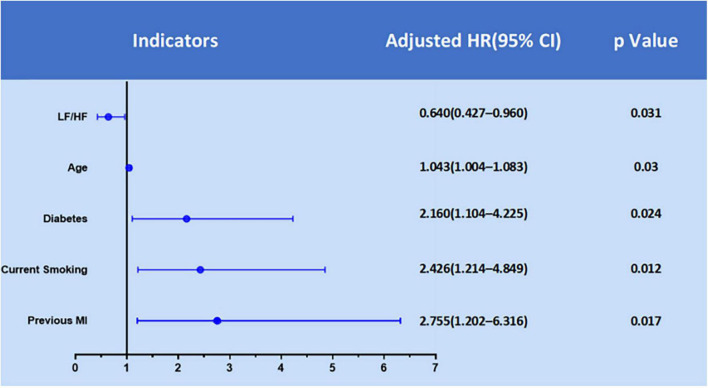
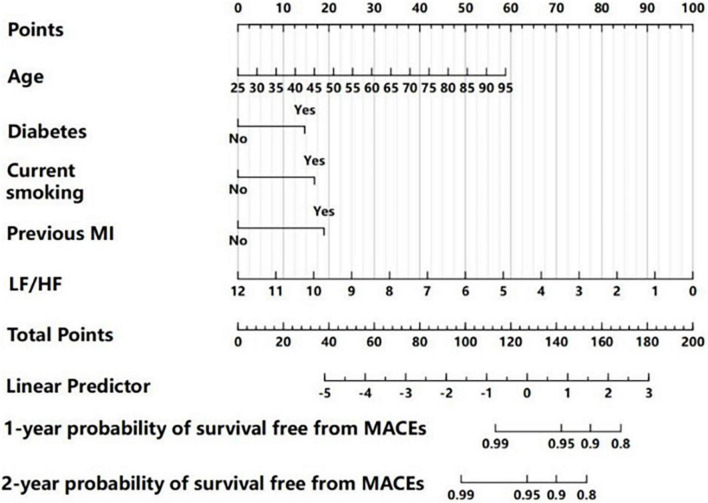
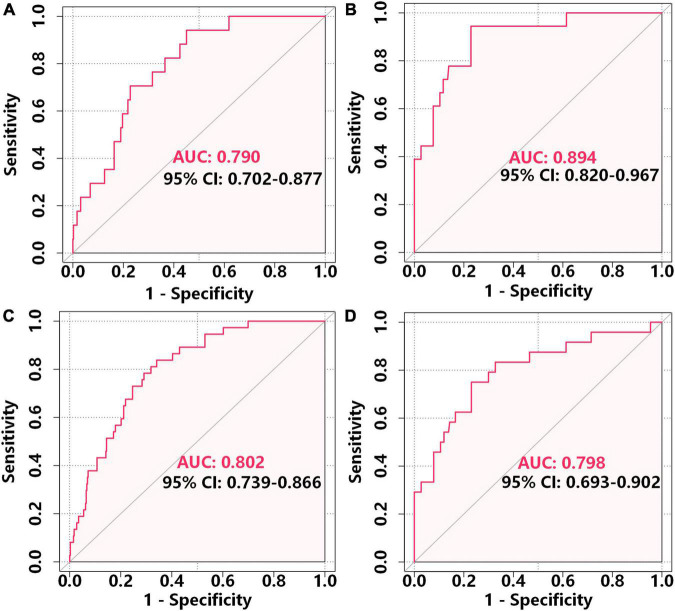
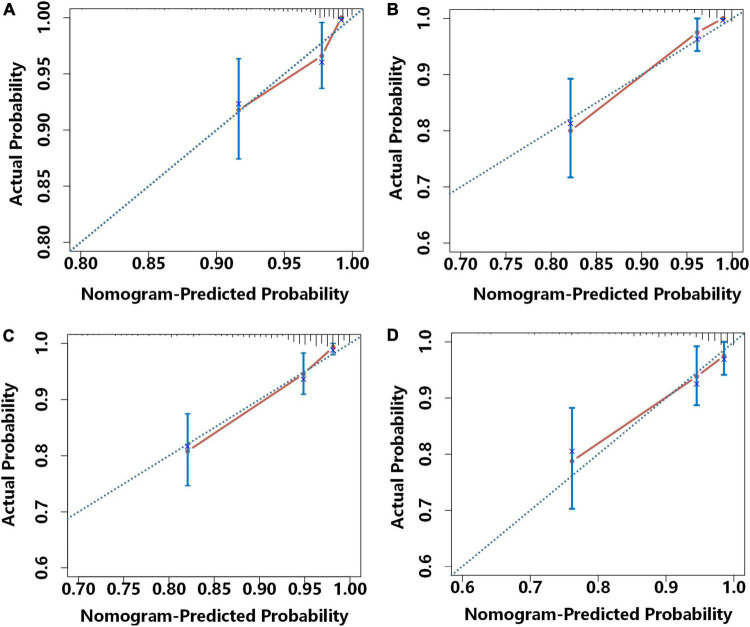
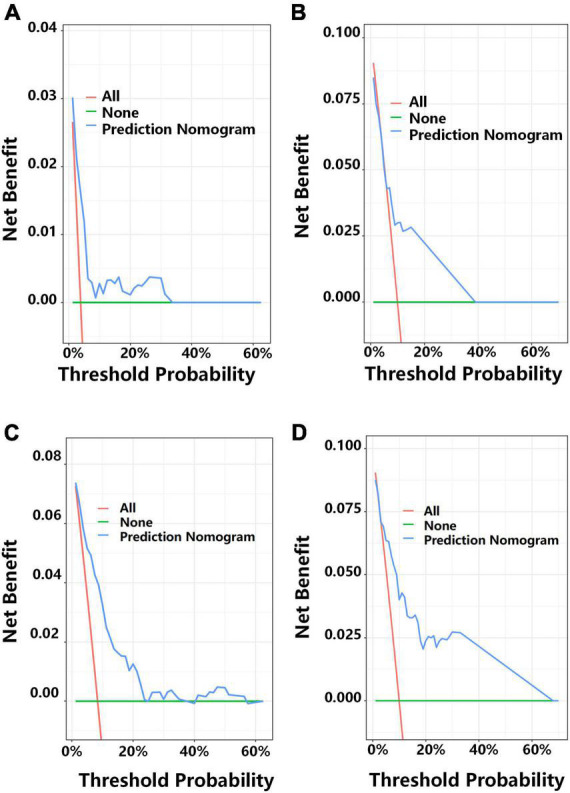
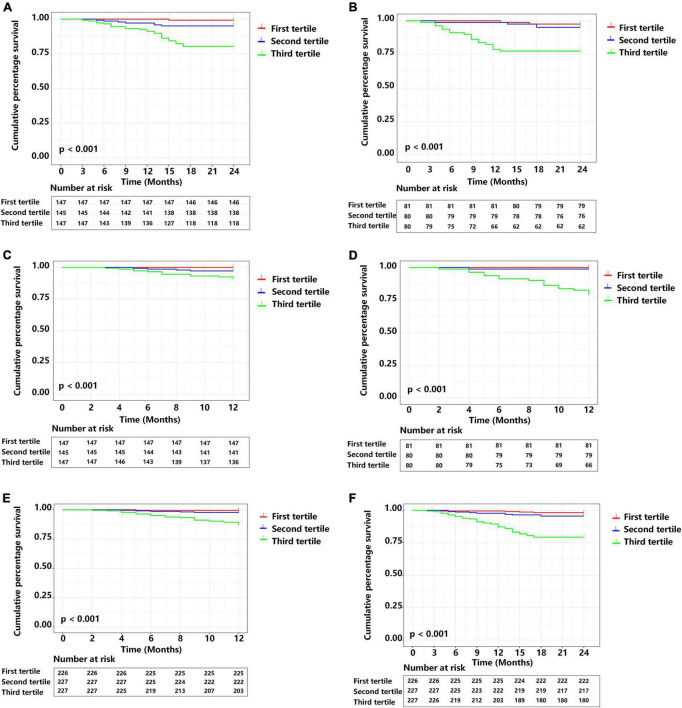
Results: There were 439 patients in a development cohort and 241 in a validation cohort, and the mean follow-up time was 22.80 months. The nomogram considered low-frequency/high-frequency ratio, age, diabetes, previous myocardial infarction, and current smoking. The area-under-the-curve (AUC) values for 1-year MACE-free survival were 0.790 (95% CI: 0.702-0.877) in the development cohort and 0.894 (95% CI: 0.820-0.967) in the external validation cohort. The AUCs for 2-year MACE-free survival were 0.802 (95% CI: 0.739-0.866) in the development cohort and 0.798 (95% CI: 0.693-0.902) in the external validation cohort. Development and validation were adequately calibrated and their predictions correlated with the observed outcome. Decision curve analysis (DCA) showed the model had good discriminative ability in predicting MACEs.
Conclusion: Our validated nomogram was based on non-invasive ANS assessment and traditional risk factors, and indicated reliable prediction of MACEs in patients with ACS. This approach has potential for use as a method for non-invasive monitoring of health that enables provision of individualized treatment strategies.
Keywords: acute coronary syndrome; autonomic nervous system; major adverse cardiovascular events; nomogram; outcomes; prediction nomogram.
Copyright © 2022 Wang, Wu, Sun, Xu, Zhu, Yu, Duan, Deng, Liu, Guo, Li, Wang, Song, Feng, Zhou and Jiang.
Conflict of interest statement
The authors declare that the research was conducted in the absence of any commercial or financial relationships that could be construed as a potential conflict of interest.
Figures
Similar articles
-
An Easy-to-Use Risk Stratification System for NSTE-ACS Patients Combining Autonomic Nervous System and Coronary Physiology.Int J Med Sci. 2025 Apr 28;22(10):2342-2353. doi: 10.7150/ijms.111214. eCollection 2025. Int J Med Sci. 2025. PMID: 40386048 Free PMC article.
-
Development and Validation of a Nomogram of In-hospital Major Adverse Cardiovascular and Cerebrovascular Events in Patients With Acute Coronary Syndrome.Front Cardiovasc Med. 2021 Aug 9;8:699023. doi: 10.3389/fcvm.2021.699023. eCollection 2021. Front Cardiovasc Med. 2021. PMID: 34434977 Free PMC article.
-
Daily exercise improves the long-term prognosis of patients with acute coronary syndrome.Front Public Health. 2023 Mar 15;11:1126413. doi: 10.3389/fpubh.2023.1126413. eCollection 2023. Front Public Health. 2023. PMID: 37006550 Free PMC article.
-
Development and validation of a prediction model to predict major adverse cardiovascular events in elderly patients undergoing noncardiac surgery: A retrospective cohort study.Atherosclerosis. 2023 Jul;376:71-79. doi: 10.1016/j.atherosclerosis.2023.06.008. Epub 2023 Jun 8. Atherosclerosis. 2023. PMID: 37315395
-
Predicting long-term prognosis after percutaneous coronary intervention in patients with acute coronary syndromes: a prospective nested case-control analysis for county-level health services.Front Cardiovasc Med. 2023 Dec 4;10:1297527. doi: 10.3389/fcvm.2023.1297527. eCollection 2023. Front Cardiovasc Med. 2023. PMID: 38111892 Free PMC article.
Cited by
-
Predicting long-term prognosis after percutaneous coronary intervention in patients with new onset ST-elevation myocardial infarction: development and external validation of a nomogram model.Cardiovasc Diabetol. 2023 Apr 13;22(1):87. doi: 10.1186/s12933-023-01820-9. Cardiovasc Diabetol. 2023. PMID: 37055777 Free PMC article.
-
Multimodal Data-Driven Prognostic Model for Predicting Long-Term Prognosis in Patients With Ischemic Cardiomyopathy and Heart Failure With Preserved Ejection Fraction After Coronary Artery Bypass Grafting: A Multicenter Cohort Study.J Am Heart Assoc. 2024 Dec 3;13(23):e036970. doi: 10.1161/JAHA.124.036970. Epub 2024 Nov 27. J Am Heart Assoc. 2024. PMID: 39604036 Free PMC article.
-
Multimodal Data Integration Enhance Longitudinal Prediction of New-Onset Systemic Arterial Hypertension Patients with Suspected Obstructive Sleep Apnea.Rev Cardiovasc Med. 2024 Jul 10;25(7):258. doi: 10.31083/j.rcm2507258. eCollection 2024 Jul. Rev Cardiovasc Med. 2024. PMID: 39139418 Free PMC article.
-
Developing a novel diagnostic model for identifying high-risk plaques in new onset unstable angina pectoris using coronary CT angiography.Front Endocrinol (Lausanne). 2025 Jul 31;16:1632355. doi: 10.3389/fendo.2025.1632355. eCollection 2025. Front Endocrinol (Lausanne). 2025. PMID: 40822960 Free PMC article.
-
Inflammation Biomarker-Driven Vertical Visualization Model for Predicting Long-Term Prognosis in Unstable Angina Pectoris Patients with Angiographically Intermediate Coronary Lesions.J Inflamm Res. 2024 Dec 6;17:10571-10584. doi: 10.2147/JIR.S497546. eCollection 2024. J Inflamm Res. 2024. PMID: 39659751 Free PMC article.
References
-
- Askin L, Duman H, Ozyıldız A, Tanriverdi O. Association of serum chemerin levels with coronary artery disease: pathogenesis and clinical research. Cardiovasc Innov Appl. (2019) 4:251–6. 10.15212/CVIA.2019.0572 - DOI
-
- Han Z, Lai L, Pu Z, Yang L. A nomogram to predict patients with obstructive coronary artery disease: development and validation. Cardiovasc Innov Appl. (2021) 5:245–55. 10.15212/CVIA.2021.0001 - DOI
LinkOut - more resources
Full Text Sources