Review
. 2022;218(8):66.
doi: 10.1007/s11214-022-00919-x. Epub 2022 Nov 16.

Science of the Van Allen Probes Science Operations Centers

Affiliations
Review

Science of the Van Allen Probes Science Operations Centers

Jerry W Manweiler et al. Space Sci Rev. 2022.

Abstract

The Van Allen Probes mission operations materialized through a distributed model in which operational responsibility was divided between the Mission Operations Center (MOC) and separate instrument specific SOCs. The sole MOC handled all aspects of telemetering and receiving tasks as well as certain scientifically relevant ancillary tasks. Each instrument science team developed individual instrument specific SOCs proficient in unique capabilities in support of science data acquisition, data processing, instrument performance, and tools for the instrument team scientists. In parallel activities, project scientists took on the task of providing a significant modeling tool base usable by the instrument science teams and the larger scientific community. With a mission as complex as Van Allen Probes, scientific inquiry occurred due to constant and significant collaboration between the SOCs and in concert with the project science team. Planned cross-instrument coordinated observations resulted in critical discoveries during the seven-year mission. Instrument cross-calibration activities elucidated a more seamless set of data products. Specific topics include post-launch changes and enhancements to the SOCs, discussion of coordination activities between the SOCs, SOC specific analysis software, modeling software provided by the Van Allen Probes project, and a section on lessons learned. One of the most significant lessons learned was the importance of the original decision to implement individual team SOCs providing timely and well-documented instrument data for the NASA Van Allen Probes Mission scientists and the larger magnetospheric and radiation belt scientific community.

Keywords: Data analysis; ECT; EFW; EMFISIS; Magnetosphere; NASA; RBPICE; Ring current; Science operations centers; Space physics; Van Allen probes; Van Allen probes gateway.


Figures

Fig. 1
Fig. 1
RBSPICE Data Flow Schematic. Figure derived from Mitchell et al. (2013) and updated with final implemented information
Fig. 2
Fig. 2
Diagram showing the calculation of timing factors for RBSPICE telemetry
Fig. 3
Fig. 3
Sector and subsector scheme used by RBSPICE also showing inter-sector and intra-sector dead times
Fig. 4
Fig. 4
Activity Diagram showing the algorithmic steps in the production of the Level 0 files
Fig. 5
Fig. 5
Shows the false (red) and correct (green) midpoint calculations of the midpoint time for the current multi-spin accumulation period over a few sectors
Fig. 6
Fig. 6
Algorithmic diagram displaying the conversion of basic counters into basic rates
Fig. 7
Fig. 7
Algorithmic diagram displaying the conversion of Energy Mode counters into Energy rates
Fig. 8
Fig. 8
Algorithmic diagram displaying the conversion of TOFxPH Species Mode counters into TOFxPH rates
Fig. 9
Fig. 9
Algorithmic diagram displaying the conversion of TOFxE Species Mode counters into TOFxE rates
Fig. 10
Fig. 10
Error propagation algorithm used in later data production especially for the Level 3 PAP and PAPAP files where flux is binned and the errors for any particular bin must be carefully calculated
Fig. 11
Fig. 11
Geometry of the calculation of the RBSPICE Pitch Angles based upon the particle flow velocities for each telescope in the spacecraft UVW reference frame
Fig. 12
Fig. 12
Algorithmic description of the calculation of the RBSPICE Pitch Angles
Fig. 13
Fig. 13
Diagram of the calculation of the phase angle in the SM reference frame. Note that to reduce the complexity of the diagram, the rotation of the spacecraft is shown around the xˆSM axis but the actual rotation of the spacecraft is around the wˆ axis of the spacecraft which points approximately along the xˆSM axis
Fig. 14
Fig. 14
Algorithmic description of the calculation of the RBSPICE Phase Angles
Fig. 15
Fig. 15
Algorithm for the binning of RBSPICE differential flux and the calculation of moments for the L3 PAP products. With minor modifications this is the same algorithm used in the binning of RBSPICE differential flux and the calculation of moments for the L3
Fig. 16
Fig. 16
Plot of Phase Space Density (PSD) for two different times using ECT/HOPE, RBSPICE/TOFxPH, and RBSPICE/TOFxE proton data from Spacecraft B during the St. Patrick’s Day Storm in 2015
Fig. 17
Fig. 17
Woodger15 all BARREL/VAP conjunctions 2013–2014
Fig. 18
Fig. 18
Observations of the RBSP-B and ARASE magnetic field instruments while the spacecraft are on the same magnetic field line and are separated by 20deg in magnetic latitude. Figure taken from Colpitts et al. (2020)
Fig. 19
Fig. 19
Comparison of ECT/HOPE, RBSPICE/TOFxPH, and RBSPICE/TOFxE spectra at 2017-02-02T02:09:36 UTC using the OMNI data variables from each data product. The left panel shows the raw spectra from each instruments data product with HOPE in red, TOFxPH in blue, and TOFxE in green. There is a clear discrepancy between the RBSPICE TOFxPH/TOFxE OMNI differential flux and that of HOPE as shown by the orange oval. The right panel shows the same data except that the HOPE data has been increased by a factor of RHR1.98 referenced in the figure as the HOPEMOD factor which is used to shift the measurements such that they now form a continuous spectra excluding the lowest TOFxPH energy channels as shown by the green oval. The black circled TOFxPH energy channels lifted above the merger of the HOPE and TOFxPH/TOFxE spectra are due to lower energy oxygen ions in the TOFxPH system being interpreted as protons. The specific factor, RHR, used was calculated using a simple algorithm as described in this section
Fig. 20
Fig. 20
Distribution of the correction factor, RHR, for each spacecraft (A-left, B-right) accumulated over the entire mission. Each black curve includes all data and the rest of the curves provide the breakout by LDipole segments between 3.0 and 7.0 in 0.5RE increments. The consistency across LDipole is reflective of the significant work to cross calibrate the ECT-HOPE and RBSPICE observations throughout the mission
Fig. 21
Fig. 21
Plot of the LDipole dependency of RHR for different periods throughout the mission. The dependency on LDipole is fairly constant throughout the mission except for 1) the initial quarter period (2013-031 through 2013-166) where both instruments are adjusting HV gain to stabilize rates and 2) the final precession period (or so) where the RBSPICE instrument performance has degraded especially for L<5
Fig. 22
Fig. 22
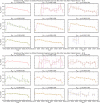
Plot of the RHR for SC-A (top) and SC-B (bottom) for individual segments of LDipole as a function of Mission time. After the last RBSPICE calibration adjustment in January 2015 there is a slow degradation of the RBSPICE instrument that is captured very clearly in these plots comparing the RBSPICE and HOPE proton flux over time
Fig. 23
Fig. 23
Front page of the Van Allen Probes Science Gateway showing the capabilities available for users
Fig. 24
Fig. 24
Plotting main user interface for the Van Allen Probes Science Gateway
Fig. 25
Fig. 25
Data selection user interface
Fig. 26
Fig. 26
Dialog boxes to create new plots, select input data sets, and data product levels
Fig. 27
Fig. 27
Example dialogue boxes for a Line plot and a Spectrogram
Fig. 28
Fig. 28
L-shell plot examples for line plots and spectrograms
Fig. 29
Fig. 29
Orbit context plot example showing the value of the Dst index along with the position of the SC in the orbit for the user chosen reference frame
Fig. 30
Fig. 30
Data slider and associated dialogue boxes
Fig. 31
Fig. 31
Example QR Code for use to share saved plots and figures with collaborators
Fig. 32
Fig. 32
Multi mission orbit plotter example plot showing orbits of the Van Allen Probes A/B, MMS, and ERG spacecraft allowing for visual identification of near conjunctions for coordinated science analysis
Fig. 33
Fig. 33
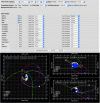
User interface for the conjunction finder tool showing example conjunctions between the RBSP A and ARASE (ERG) spacecraft
Fig. 34
Fig. 34
Example set of conjunctions for the RBSP A and ARASE spacecraft shown in an orbit context plot
Fig. 35
Fig. 35
Example generated ephemeris for RBSP A
Fig. 36
Fig. 36
Generation of the orbit number for the RBSP A spacecraft
Fig. 37
Fig. 37
Example plot generated of the magnetic field line footprints for both Van Allen Probes spacecraft as calculated using the Olsen-Pfitzer 1997 Quiet magnetic field model
Fig. 38
Fig. 38
Example search screen from the Gateway Bibliography search page looking for articles written by the author with the last name of “Spence” as a reference to Prof. Harlan Spence the PI of the Van Allen Probes EFW Instrument
Fig. 39
Fig. 39
Example returned bibliography entry showing the detail provided with each entry
Fig. 40
Fig. 40
The TS07D reconstruction of magnetospheric current systems during the March 2015 Saint Patrick’s Day geomagnetic storm. (a) The solar wind electric field parameter vBzIMF (black line) and dynamic pressure (orange line). (b) The geomagnetic indices: pressure corrected storm index Sym-H* (black line) and substorm index AL (orange line). The dashed and dotted lines indicate the smoothed values. The purple vertical bars show the 3 moments of interest, corresponding to (c and d) the quiet time prior to the start of the storm, (e and f) the main phase of the storm, and (g and h) the early recovery phase of the storm. (c, e, and g) Equatorial slices (with no dipole tilt deformation effects) of the current density with the color representing the magnitude and the arrows showing the direction of the current density field. Inset in the upper left of this panel is the current density showing FACs flowing into (blue) and out of (red) the ionosphere. (d, f, and h) The meridional slices of the Y-component of the current density with the color indicating current flowing out of (green) and into (purple) the page. Magnetic field lines are overplotted in black starting from a magnetic latitude of 60 with a 2 step size, with three of the field lines being highlighted
Fig. 41
Fig. 41
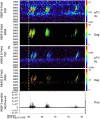
Burst 1 and 2 timelines. Panel a shows the average monthly data rate in samples/sec for both burst 1 (blue) and burst 2 (red), and, for comparison, the inverted DST index (black). Panel b shows the accumulated data volume. The last panel is a zoomed-in view of the average monthly rate showing the significant increase in data volume following the adoption of the sprint methodology and the burst 1 visual memory management software
Fig. 42
Fig. 42
Example of the timeline output of the EFW burst memory manager software for RBSPa. (a) Red lines show the future prediction of the memory pointer location, thick black lines show currently recorded data, and thick blue lines show locations of potentially interesting data that have been designated as protected from overwrite. Spacecraft contacts are shown as the orange ticks, while the vertical line indicates the last time the code was run. (b) The thick black lines are a flattened version of those in panel (a), and the area under the green lines indicates data that has been telemetered
Fig. 43
Fig. 43
RBSPICE software defined virtual spin (dark blue) is shown in the left pane displaying the variation of the virtual spin before an eclipse period (white background) and during an eclipse period (cyan background) where the out of nominal virtual spin values increased dramatically during the eclipse period so that some data collected during this period has pointing that is no longer valid for lack of understanding of the pointing of the instrument during these times. The right pane presents the distribution of spin periods over the time frame of the left pane. This plot shows that the hard-coded 12 second spin period occurs fairly frequently but also that much lower and higher spin periods occur when the virtual spin software is either slowing down or catching up to the real spin period post-eclipse

Similar articles

  • Radiation Belt Storm Probes Ion Composition Experiment (RBSPICE) Revisited: In-Flight Calibrations, Lessons Learned and Scientific Advances.
    Gkioulidou M, Mitchell DG, Manweiler JW, Lanzerotti LJ, Gerrard AJ, Ukhorskiy AY, Keika K, Mouikis CG, Kistler LM. Gkioulidou M, et al. Space Sci Rev. 2023;219(8):80. doi: 10.1007/s11214-023-00991-x. Epub 2023 Nov 28. Space Sci Rev. 2023. PMID: 38037569 Free PMC article. Review.
  • The Relativistic Proton Spectrometer: A Review of Sensor Performance, Applications, and Science.
    Mazur JE, O'Brien TP, Looper MD. Mazur JE, et al. Space Sci Rev. 2023;219(3):26. doi: 10.1007/s11214-023-00962-2. Epub 2023 Apr 5. Space Sci Rev. 2023. PMID: 37034006 Free PMC article. Review.
  • The Electric and Magnetic Fields Instrument Suite and Integrated Science (EMFISIS): Science, Data, and Usage Best Practices.
    Kletzing CA, Bortnik J, Hospodarsky G, Kurth WS, Santolik O, Smitth CW, Christopher IW, Hartley DP, Kolmasova I, Sen Gupta A. Kletzing CA, et al. Space Sci Rev. 2023;219(4):28. doi: 10.1007/s11214-023-00973-z. Epub 2023 Apr 25. Space Sci Rev. 2023. PMID: 37123883 Free PMC article. Review.
  • Collaborative Research Activities of the Arase and Van Allen Probes.
    Miyoshi Y, Shinohara I, Ukhorskiy S, Claudepierre SG, Mitani T, Takashima T, Hori T, Santolik O, Kolmasova I, Matsuda S, Kasahara Y, Teramoto M, Katoh Y, Hikishima M, Kojima H, Kurita S, Imajo S, Higashio N, Kasahara S, Yokota S, Asamura K, Kazama Y, Wang SY, Jun CW, Kasaba Y, Kumamoto A, Tsuchiya F, Shoji M, Nakamura S, Kitahara M, Matsuoka A, Shiokawa K, Seki K, Nosé M, Takahashi K, Martinez-Calderon C, Hospodarsky G, Colpitts C, Kletzing C, Wygant J, Spence H, Baker DN, Reeves GD, Blake JB, Lanzerotti L. Miyoshi Y, et al. Space Sci Rev. 2022;218(5):38. doi: 10.1007/s11214-022-00885-4. Epub 2022 Jun 21. Space Sci Rev. 2022. PMID: 35757012 Free PMC article. Review.
  • The ELFIN Mission.
    Angelopoulos V, Tsai E, Bingley L, Shaffer C, Turner DL, Runov A, Li W, Liu J, Artemyev AV, Zhang XJ, Strangeway RJ, Wirz RE, Shprits YY, Sergeev VA, Caron RP, Chung M, Cruce P, Greer W, Grimes E, Hector K, Lawson MJ, Leneman D, Masongsong EV, Russell CL, Wilkins C, Hinkley D, Blake JB, Adair N, Allen M, Anderson M, Arreola-Zamora M, Artinger J, Asher J, Branchevsky D, Capitelli MR, Castro R, Chao G, Chung N, Cliffe M, Colton K, Costello C, Depe D, Domae BW, Eldin S, Fitzgibbon L, Flemming A, Fox I, Frederick DM, Gilbert A, Gildemeister A, Gonzalez A, Hesford B, Jha S, Kang N, King J, Krieger R, Lian K, Mao J, McKinney E, Miller JP, Norris A, Nuesca M, Palla A, Park ESY, Pedersen CE, Qu Z, Rozario R, Rye E, Seaton R, Subramanian A, Sundin SR, Tan A, Turner W, Villegas AJ, Wasden M, Wing G, Wong C, Xie E, Yamamoto S, Yap R, Zarifian A, Zhang GY. Angelopoulos V, et al. Space Sci Rev. 2020;216(5):103. doi: 10.1007/s11214-020-00721-7. Epub 2020 Jul 30. Space Sci Rev. 2020. PMID: 32831412 Free PMC article.

Cited by

References

    1. Acton CH. Ancillary data services of NASA’s navigation and ancillary information facility. Planet Space Sci. 1996;44(1):65–70. doi: 10.1016/0032-0633(95)00107-7. - DOI
    1. Acton CH, Bachman N, Semenov B, Wright E. A look toward the future in the handling of space science mission geometry. Planet Space Sci. 2017;150:9–12. doi: 10.1016/j.pss.2017.02.013. - DOI
    1. Angelopoulos V, Cruce P, Drozdov A. The Space Physics Environment Data Analysis System (SPEDAS) Space Sci Rev. 2019;215:9. doi: 10.1007/s11214-018-0576-4. - DOI - PMC - PubMed
    1. Baker DN, Kanekal SG, Hoxie V, Li X, Jaynes AN, Zhao H, et al. The Relativistic Electron-Proton Telescope (REPT) investigation: design, operational properties, and science highlights. Space Sci Rev. 2021;217:68. doi: 10.1007/s11214-021-00838-3. - DOI
    1. Booch G, Jacobson I, Rumbaugh J. The Unified Modeling Language Reference Manual. Boston: Addison Wesley Longman, Inc.; 1999.

LinkOut - more resources