. 2022 Nov 3:9:1051964.
doi: 10.3389/fnut.2022.1051964. eCollection 2022.

Effect of dietary protein content shift on aging in elderly rats by comprehensive quantitative score and metabolomics analysis

Affiliations

Effect of dietary protein content shift on aging in elderly rats by comprehensive quantitative score and metabolomics analysis

Wenxuan Zheng et al. Front Nutr. .

Abstract

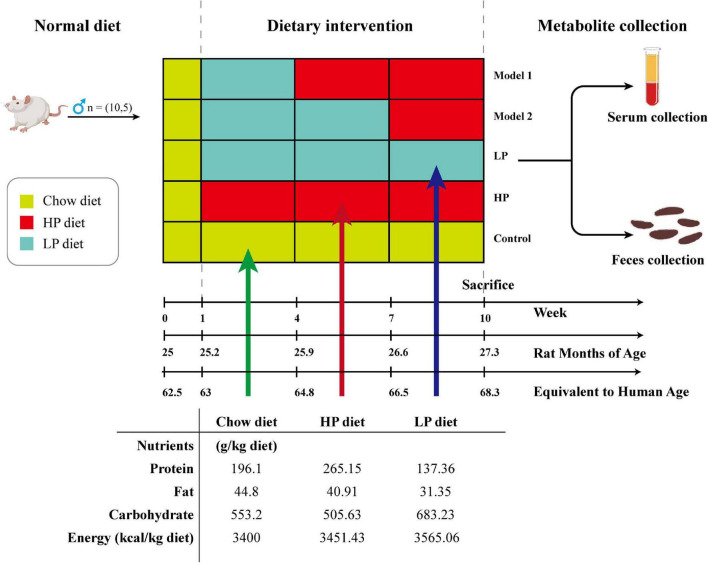
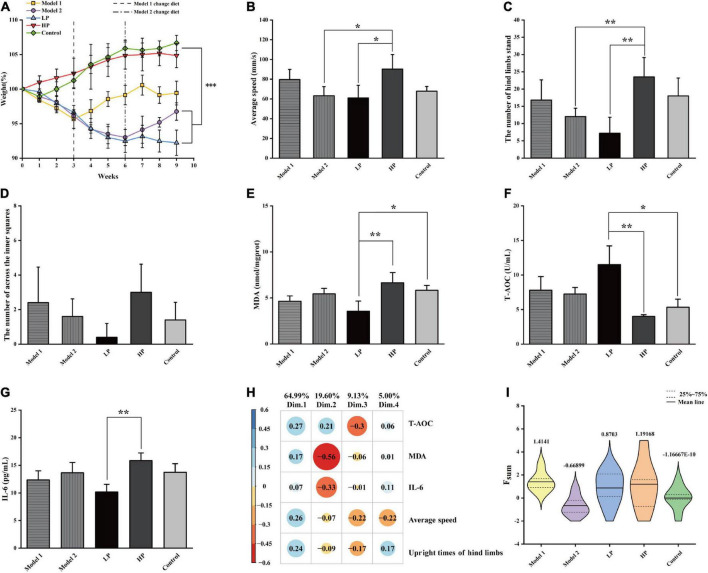
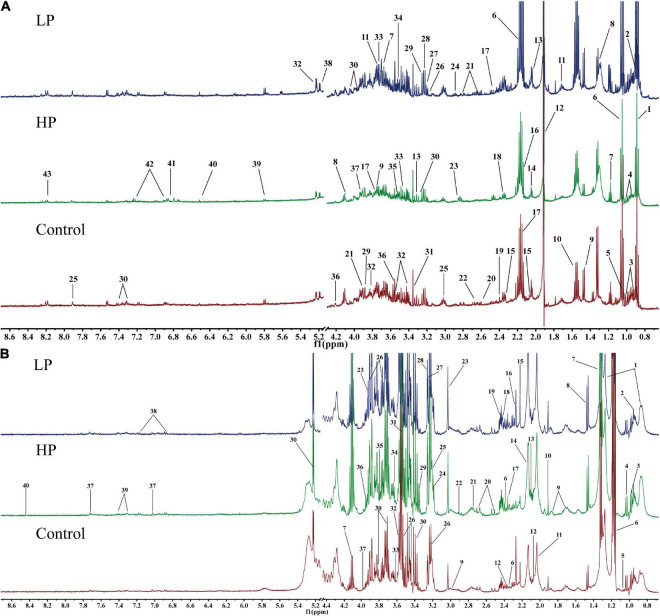
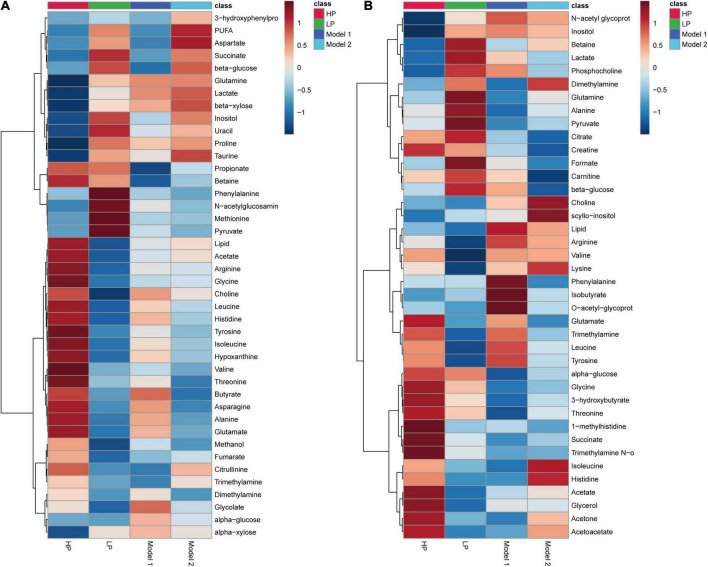
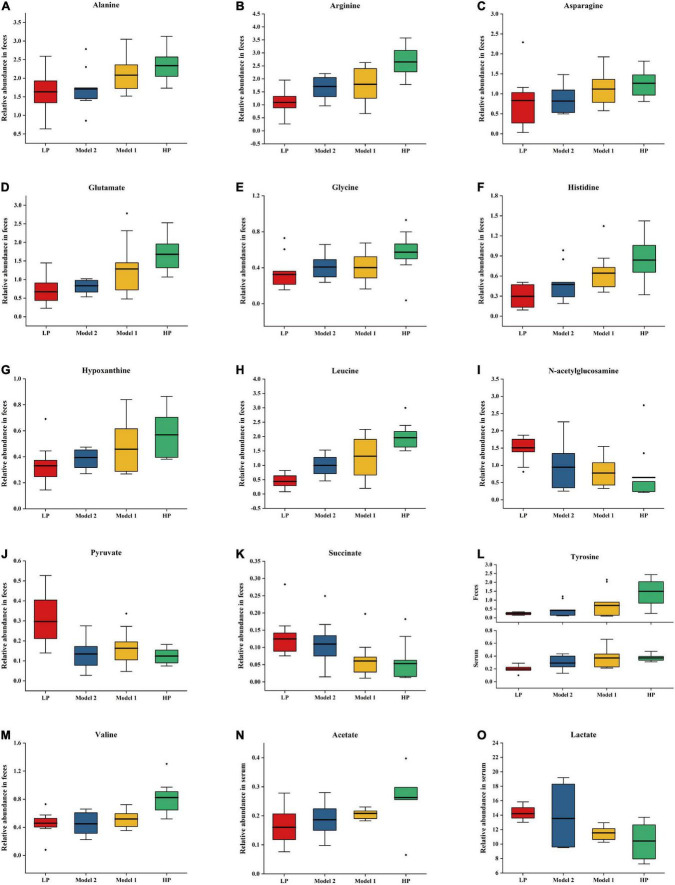
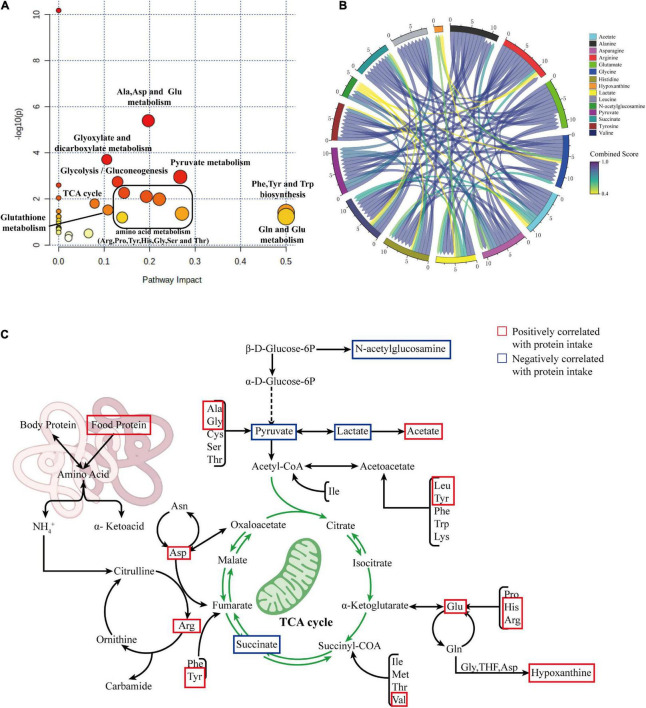
In the protein nutrition strategy of middle-aged and elderly people, some believe that low protein is good for health, while others believe high protein is good for health. Facing the contradictory situation, the following hypothesis is proposed. There is a process of change from lower to higher ratio of protein nutritional requirements that are good for health in the human body after about 50 years of age, and the age at which the switch occurs is around 65 years of age. Hence, in this study, 50, 25-month-old male rats were randomly divided into five groups: Control (basal diet), LP (low-protein diet with a 30% decrease in protein content compared to the basal diet), HP (high-protein diet with a 30% increase in protein content compared to the basal diet), Model 1 (switched from LP to HP feed at week 4), and Model 2 (switched from LP to HP feed at week 7). After a total of 10 weeks intervention, the liver and serum samples were examined for aging-related indicators, and a newly comprehensive quantitative score was generated using principal component analysis (PCA). The effects of the five protein nutritional modalities were quantified in descending order: Model 1 > HP > LP > Control > Model 2. Furthermore, the differential metabolites in serum and feces were determined by orthogonal partial least squares discriminant analysis, and 15 differential metabolites, significantly associated with protein intake, were identified by Spearman's correlation analysis (p < 0.05). Among the fecal metabolites, 10 were positively correlated and 3 were negatively correlated. In the serum, tyrosine and lactate levels were positively correlated, and acetate levels were negatively correlated. MetaboAnalyst analysis identified that the metabolic pathways influenced by protein intake were mainly related to amino acid and carbohydrate metabolism. The results of metabolomic analysis elucidate the mechanisms underlying the preceding effects to some degree. These efforts not only contribute to a unified protein nutrition strategy but also positively impact the building of a wiser approach to protein nutrition, thereby helping middle-aged and older populations achieve healthy aging.

Keywords: aging; comprehensive quantitative score; dietary patterns; metabolomics; nuclear magnetic resonance.


Conflict of interest statement

The authors declare that the research was conducted in the absence of any commercial or financial relationships that could be construed as a potential conflict of interest.

Figures

FIGURE 1
FIGURE 1
Schematic diagram showing the experimental design, animal grouping, and composition of the experimental diet.
FIGURE 2
FIGURE 2
Basic physiological parameters of rats and the comprehensive assessment of aging status. (A) Body weight, (B) mean movement speed of rats in the open field experiment, (C) number of upright hind limbs of rats in the open field experiment, (D) number of central region entries of rats in the open field experiment, (E) liver MDA level, (F) serum T-AOC level, and (G) serum inflammatory factor IL-6 level. All values above are expressed as mean ± SD (n = 10), *p < 0.05, **p < 0.01, ***p < 0.001. (H) Factor loading matrix of the principal components of the health index. (I) Violin plot of Fsum scores of rats in each group.
FIGURE 3
FIGURE 3
Representative 1H-NMR metabolic profiles of rat feces and serum. (A) Representative 1H-NMR metabolic profiles of rat feces. 1, lipid; 2, butyrate; 3, isoleucine; 4, leucine; 5, valine; 6, propionate; 7, ethanol; 8, lactate; 9, alanine; 10, citrulline; 11, arginine; 12, acetate; 13, proline; 14, N-acetylglucosamine; 15, glutamate; 16, methionine; 17, glutamine; 18, pyruvate; 19, succinate; 20 PUFA; 21, aspartate; 22, dimethylamine; 23, trimethylamine; 24, asparagine; 25, histidine; 26, choline; 27, β-xylose; 28, taurine; 29, betaine; 30, phenylalanine; 31, methanol; 32, α-glucose; 33, β-glucose; 34, inositol; 35, glycine; 36, threonine; 37, glycolate; 38, α-xylose; 39, uracil; 40, fumarate; 41, 3-hydroxyphenyl propionic acid; 42, tyrosine; 43, hypoxanthine. (B) Representative 1H-NMR metabolic profiles of rat serum. 1, lipid; 2, isoleucine; 3, leucine; 4, valine; 5, isobutyrate; 6, 3-hydroxybutyrate; 7, lactate; 8, alanine; 9, lysine; 10, acetate; 11, N-acetylglucosamine; 12, glutamate; 13, glutamine; 14, O-acetyl glycoprotein; 15, acetone; 16, acetoacetate; 17, pyruvate; 18, succinate 19, carnitine; 20, citrate; 21, dimethylamine; 22, trimethylamine; 23, creatine; 24, choline; 25, phosphorylcholine; 26, β-glucose; 27, trimethylamine oxide; 28, betaine; 29, scyllo-inositol; 30, α-glucose; 31, glycine; 32, threonine; 33, propanetriol; 34, inositol; 35, arginine; 36, 1-methylhistidine; 37, histidine; 38, tyrosine; 39, phenylalanine; 40, formate.
FIGURE 4
FIGURE 4
Hierarchical clustering heatmap of metabolite concentrations. (A) Hierarchical clustering heatmap of metabolite concentrations in rat feces. (B) Hierarchical clustering heatmap of metabolite concentrations in rat serum.
FIGURE 5
FIGURE 5
Correlation difference metabolite normalized peak area box plots for Model 1, Model 2, chronic low protein, and chronic high protein diet model groups. (A) Alanine, (B) arginine, (C) asparagine, (D) glutamate, (E) glycine, (F) histidine, (G) hypoxanthine, (H) leucine, (I) N-acetylglucosamine, (J) pyruvate, (K) succinate, (L) tyrosine, (M) valine, (N) acetate, and (O) lactate. Data are expressed as mean ± SD.
FIGURE 6
FIGURE 6
(A) Summary plot of pathway analysis of correlated differential metabolites using MetPA. (B) Chord diagram showing the relationship between correlated differential metabolites. (C) Summary diagram of metabolic pathways associated with protein intake.

Similar articles

Cited by

References

    1. Wang D, Ye J, Shi R, Zhao B, Liu Z, Lin W, et al. Dietary protein and amino acid restriction: Roles in metabolic health and aging-related diseases. Free Radic Biol Med. (2022) 178:226–42. 10.1016/j.freeradbiomed.2021.12.009 - DOI - PubMed
    1. Bhupathiraju SN, Hu FB. Epidemiology of obesity and diabetes and their cardiovascular complications. Circ Res. (2016) 118:1723–35. 10.1161/CIRCRESAHA.115.306825 - DOI - PMC - PubMed
    1. Elias MF, Elias PK, Sullivan LM, Wolf PA, D’Agostino RB. Obesity, diabetes and cognitive deficit: The Framingham Heart Study. Neurobiol Aging. (2005) 26(Suppl 1):11–6. 10.1016/j.neurobiolaging.2005.08.019 - DOI - PubMed
    1. Wolf PA, Beiser A, Elias MF, Au R, Vasan RS, Seshadri S. Relation of obesity to cognitive function: Importance of central obesity and synergistic influence of concomitant hypertension. The Framingham Heart Study. Curr Alzheimer Res. (2007) 4:111–6. 10.2174/156720507780362263 - DOI - PubMed
    1. Grandison RC, Piper MD, Partridge L. Amino-acid imbalance explains extension of lifespan by dietary restriction in Drosophila. Nature. (2009) 462:1061–4. 10.1038/nature08619 - DOI - PMC - PubMed