. 2022 Nov 14:12:100326.
doi: 10.1016/j.resplu.2022.100326. eCollection 2022 Dec.

Left ventricle chest compression improves ETCO2, blood pressure, and cerebral blood velocity in a swine model of cardiac arrest and cardiopulmonary resuscitation

Affiliations

Left ventricle chest compression improves ETCO2, blood pressure, and cerebral blood velocity in a swine model of cardiac arrest and cardiopulmonary resuscitation

Rory A Marshall et al. Resusc Plus. .

Abstract

Introduction: During cardiopulmonary resuscitation (CPR), high quality chest compressions are critical to organ perfusion, especially the brain. Yet, the optimal location for chest compressions is unclear. It was hypothesized that compared with the standard chest compression (SCC) location, left ventricle chest compressions (LVCCs) would result in greater ETCO2, blood pressure (BP), and cerebral blood velocity (CBV) during CPR in swine.

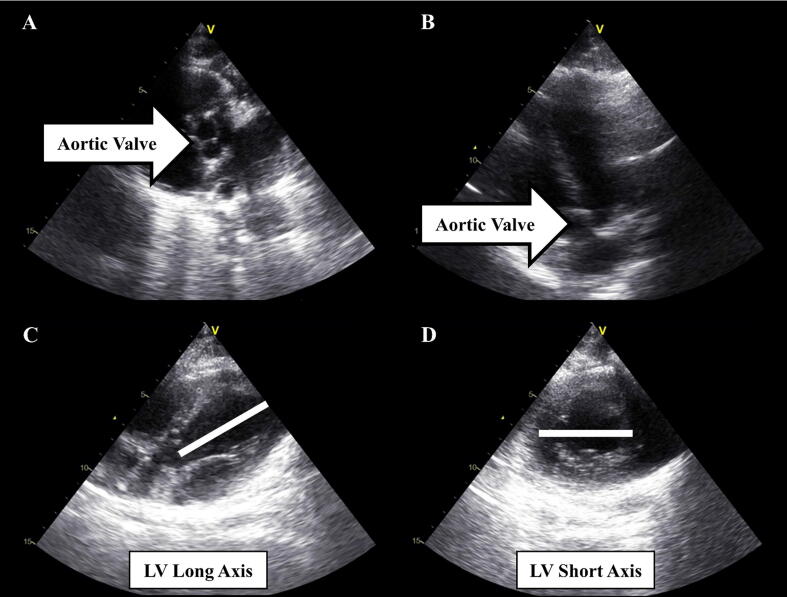
Methods: Female Landrace swine (N = 32; 35 ± 2 kg) underwent two mins of untreated asphyxiated cardiac arrest (CA). Thereafter, swine were treated with three 2-min cycles of either SCC or LVCC mechanical basic life support CPR (LUCAS 3). ETCO2 (in-line sampling), BP (arterial catheter line), and CBV (transcranial Doppler) were measured during the pre-CA, untreated-CA, and CPR-treated phases.

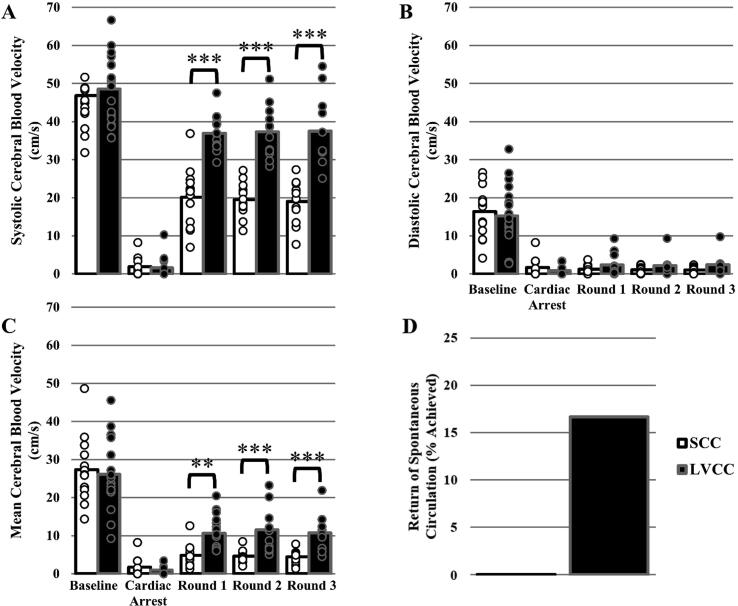
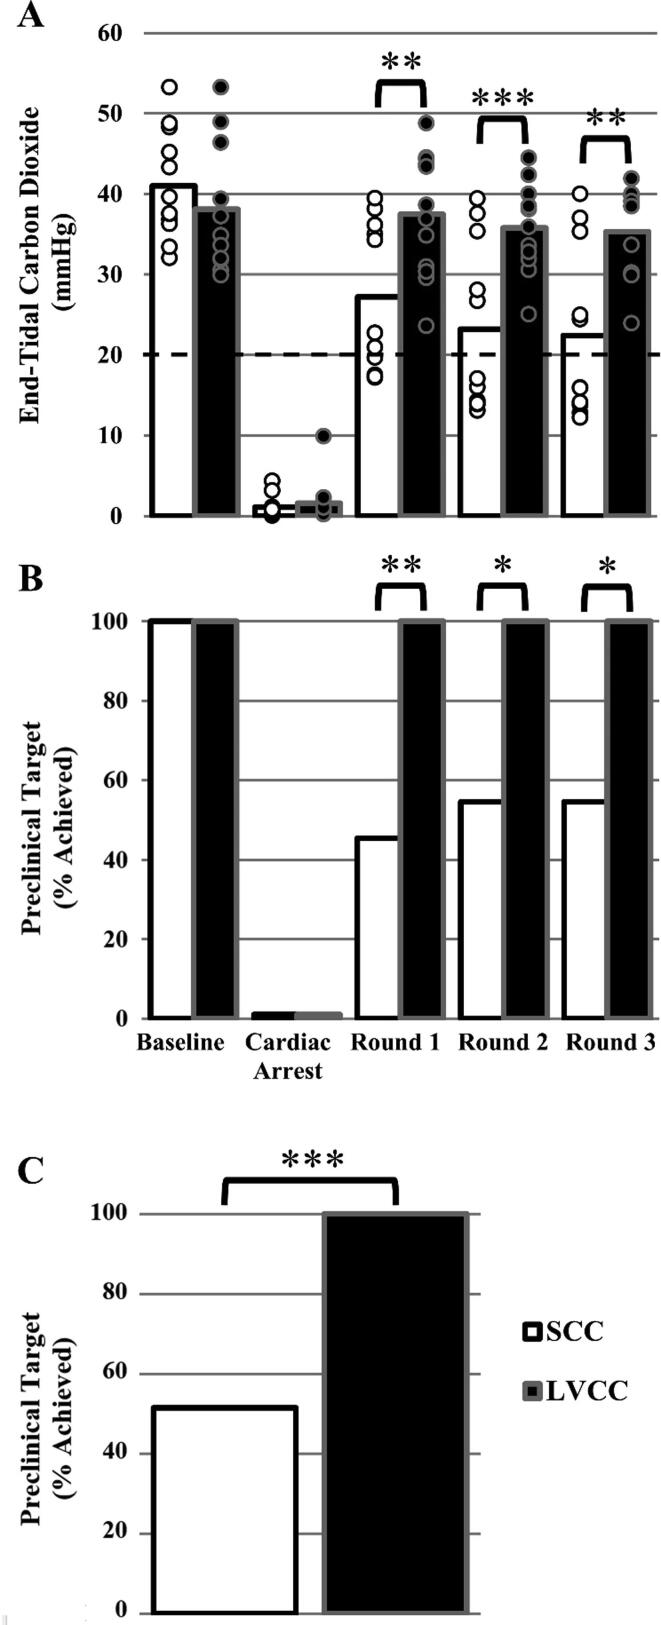
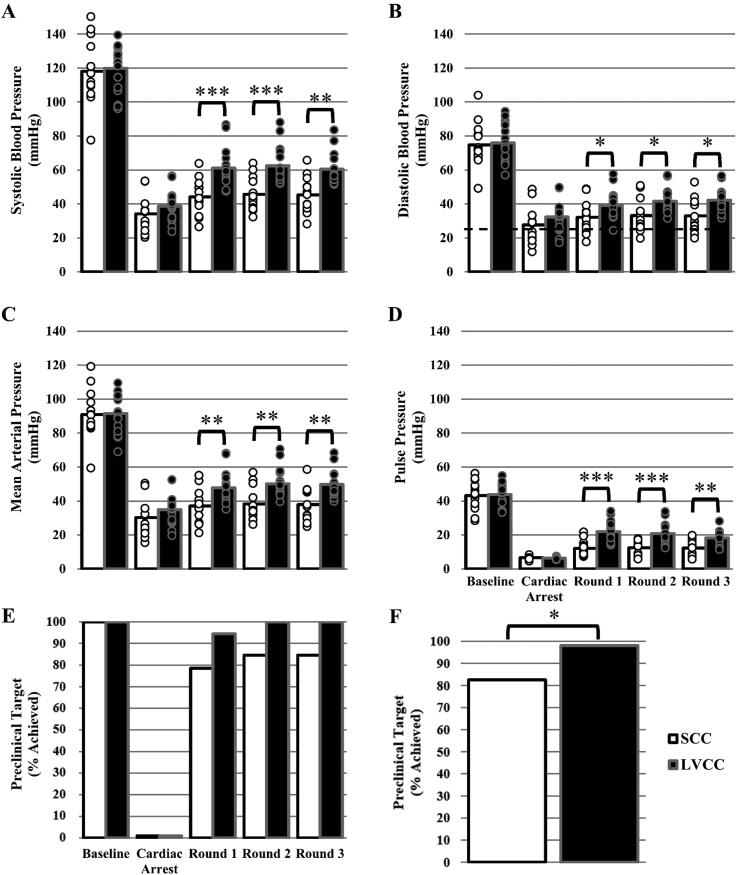
Results: ETCO2, BP, and CBV were similar between groups at pre- and during untreated-CA (P ≥ 0.188). During CPR, ETCO2 (36 ± 6 versus 24 ± 10 mmHg, P < 0.001), mean arterial BP (MAP; 49 ± 9 versus 37 ± 9 mmHg, P = 0.002), and CBV (11 ± 5 versus 5 ± 2 cm/s, P < 0.001) were significantly greater in the LVCC versus SCC group. Moreover, a greater proportion of animals obtained targets for ETCO2 (ETCO2 ≥ 20 mmHg; 52 % (17/33) versus 100 % (32/32), P < 0.001) and diastolic BP (DBP ≥ 25 mmHg; 82 % (33/40) versus 97 % (48/49), P = 0.020) in the LVCC versus SCC group.

Conclusion: Indicators of cardiac output, BP, and cerebral perfusion during CPR were greatest in the LVCC group, suggesting the quality of chest compressions during BLS CPR may be improved by performing compressions over the left ventricle compared to the centre of the chest.

Keywords: Basic Life Support; CPR; Cardiac Arrest; Cerebral Blood Flow; Chest Compressions; Left Ventricle Chest Compressions.


Figures

Fig. 1
Fig. 1
Transthoracic echocardiography 2-dimensional images of the aortic valve (A & B) to guide surface markings for the standard chest compression (SCC) location. Left ventricular long (C) and short (D) axes used to guide surface markings for the left ventricle chest compression (LVCC) location. The white lines in C and D indicate the corresponding axes.
Fig. 2
Fig. 2
Average systolic cerebral blood velocity (SCBV; Panel A), diastolic cerebral blood velocity (DCBV; Panel B) and mean cerebral blood velocity (MCBV; Panel C) values for standard chest compression (SCC; white fill bars) and left ventricle chest compression (LVCC; black fill bars) groups during baseline, cardiac arrest (CA), basic life support (BLS) cardiopulmonary resuscitation (CPR) round 1 (SCC n = 12, LVCC n = 16), CPR round 2 (SCC n = 12, LVCC n = 12), and CPR round 3 (SCC n = 12, LVCC n = 11). Data were analyzed using a mixed model ANOVA. A priori between group comparisons at baseline, CA, aand round 1, round 2 and round 3 of BLS CPR were completed using a post hoc Tukey’s test. Significantly greater than SCC **(P < 0.01), ***(P < 0.001). Bars represent mean. Individual data points reflect individual animals. Some individual datapoints may overlap, thus obscuring visualization. The sample sizes listed herein are accurate. Percent of animals that achieved return of spontaneous circulation (ROSC) in the SCC and LVCC groups during CPR (Panel D). Panel D data were analyzed using a Fisher’s exact test.
Fig. 3
Fig. 3
Average end-tidal carbon dioxide (ETCO2; Panel A) values for standard chest compression (SCC; white fill bars) and left ventricle chest compression (LVCC; black fill bars) groups during baseline, cardiac arrest (CA), basic life support (BLS) cardiopulmonary resuscitation (CPR) round 1 (SCC n = 11, LVCC n = 12), CPR round 2 (SCC n = 11, LVCC n = 11), and CPR round 3 (SCC n = 11, LVCC n = 9). Data were analyzed using a mixed model ANOVA. A priori between group comparisons at baseline, CA, and round 1, round 2 and round 3 of BLS CPR were completed using a post hoc Tukey’s test. Significantly greater than SCC **(P < 0.01), ***(P < 0.001). Bars represent mean. Individual data points reflect individual animals. Some individual datapoints may overlap, thus obscuring visualization. The sample sizes listed herein are accurate. Dashed black line represents preclinical target for ETCO2 (≥20 mmHg). Percent of animals that achieved the preclinical target for ETCO2 in the SCC and LVCC groups during baseline, CA, and round 1, round 2 and round 3 of CPR (B), and across all three CPR rounds cumulatively (C). Panel B and C data were analyzed using Fisher’s exact tests. Significant dependencies between chest compression location and achieving the preclinical target by round *(P < 0.05), **(P < 0.01), ***(P < 0.001).
Fig. 4
Fig. 4
Average systolic blood pressure (SBP; Panel A), diastolic blood pressure (DBP; Panel B), mean arterial blood pressure (MAP; Panel C) and pulse pressure (PP; Panel D) values for standard chest compression (SCC; white fill bars) and left ventricle chest compression (LVCC; black fill bars) groups during baseline, cardiac arrest (CA), basic life support (BLS) cardiopulmonary resuscitation (CPR) round 1 (SCC n = 14, LVCC n = 18), CPR round 2 (SCC n = 13, LVCC n = 16), and CPR round 3 (SCC n = 13, LVCC n = 15). Data were analyzed using a mixed model ANOVA. A priori between group comparisons at baseline, CA, and round 1, round 2 and round 3 of BLS CPR were completed using a post hoc Tukey’s test. Significantly greater than SCC *(P < 0.05), **(P < 0.01), ***(P < 0.001). Bars represent mean. Individual data points reflect individual animals. Some individual datapoints may overlap, thus obscuring visualization. The sample sizes listed herein are accurate. Dashed black line represent preclinical target for DBP (≥25 mmHg). Percent of animals that achieved the preclinical target for DBP in the SCC and LVCC groups during baseline, CA, and round 1, round 2 and round 3 of BLS CPR (Panel E), and across all three CPR rounds cumulatively (Panel F). Panel E and F data were analyzed using Fisher’s exact tests. Significant dependency between chest compression location and achieving the preclinical target *(P < 0.05).

Similar articles

Cited by

References

    1. Meaney P.A., Bobrow B.J., Mancini M.E., et al. Cardiopulmonary resuscitation quality: Improving cardiac resuscitation outcomes both inside and outside the hospital: A consensus statement from the American heart association. Circulation. 2013;128:417–435. doi: 10.1161/CIR.0b013e31829d8654. - DOI - PubMed
    1. Vaillancourt C., Stiell I.G. Cardiac arrest care and emergency medical services in Canada. Can J Cardiol. 2004;20:1081–1090. doi: 10.1093/europace/eur092. - DOI - PubMed
    1. Nichol G., Thomas E., Callaway C.W., et al. Regional variation in out-of-hospital cardiac arrest incidence and outcome. JAMA - J Am Med Assoc. 2008;300:1423–1431. doi: 10.1001/jama.300.12.1423. - DOI - PMC - PubMed
    1. Berdowski J., Berg R.A., Tijssen J.G.P., Koster R.W. Global incidences of out-of-hospital cardiac arrest and survival rates: Systematic review of 67 prospective studies. Resuscitation. 2010;81:1479–1487. doi: 10.1016/j.resuscitation.2010.08.006. - DOI - PubMed
    1. Girotra S., Van Diepen S., Nallamothu B.K., et al. Regional variation in out-of-hospital cardiac arrest survival in the United States. Circulation. 2016;133:2159–2168. doi: 10.1161/CIRCULATIONAHA.115.018175. - DOI - PMC - PubMed