

Multi-omics analysis reveals the molecular changes accompanying heavy-grazing-induced dwarfing of Stipa grandis
- PMID: 36407579
- PMCID: PMC9673880
- DOI: 10.3389/fpls.2022.995074
Multi-omics analysis reveals the molecular changes accompanying heavy-grazing-induced dwarfing of Stipa grandis
Abstract
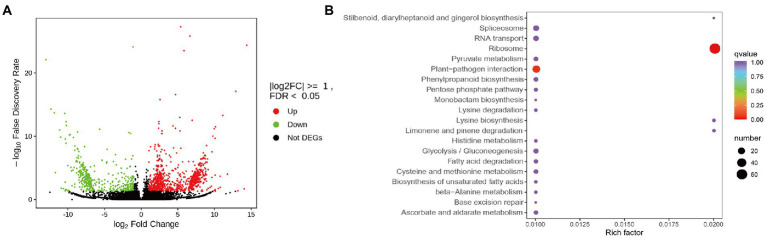
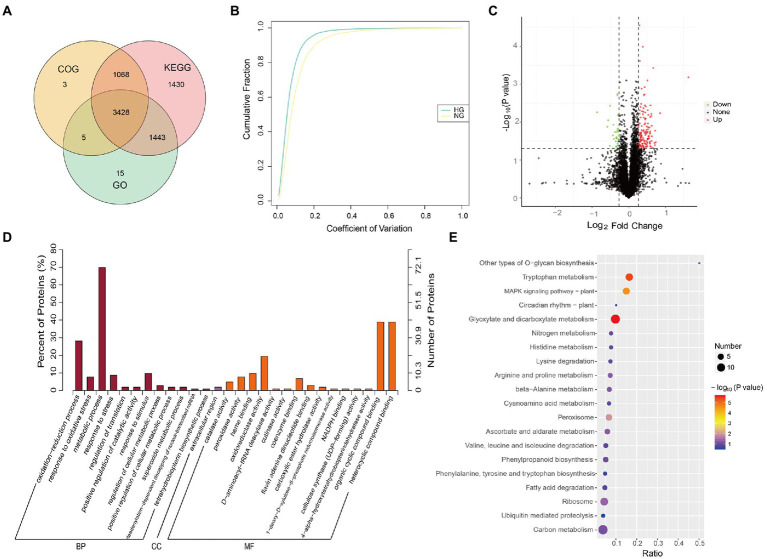
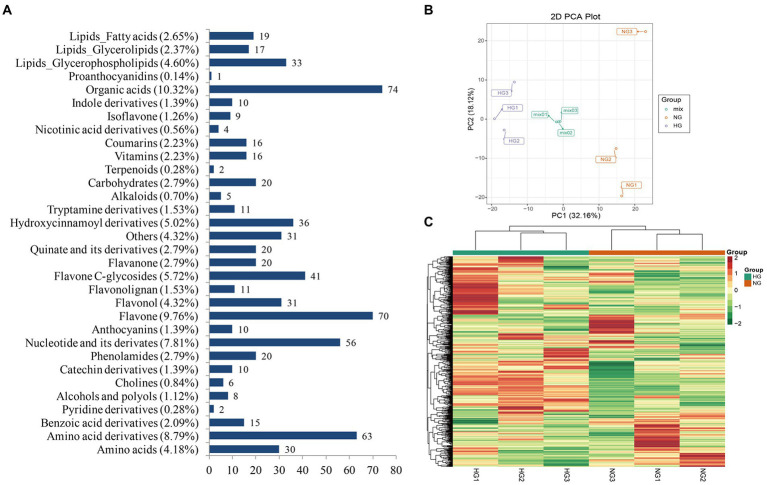
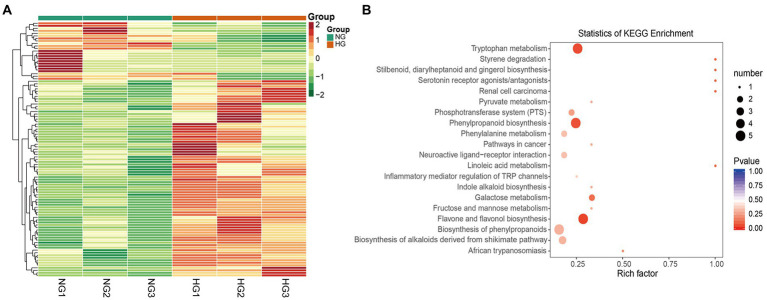
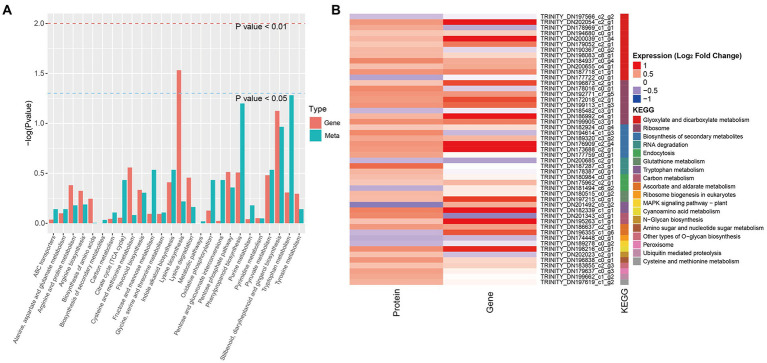
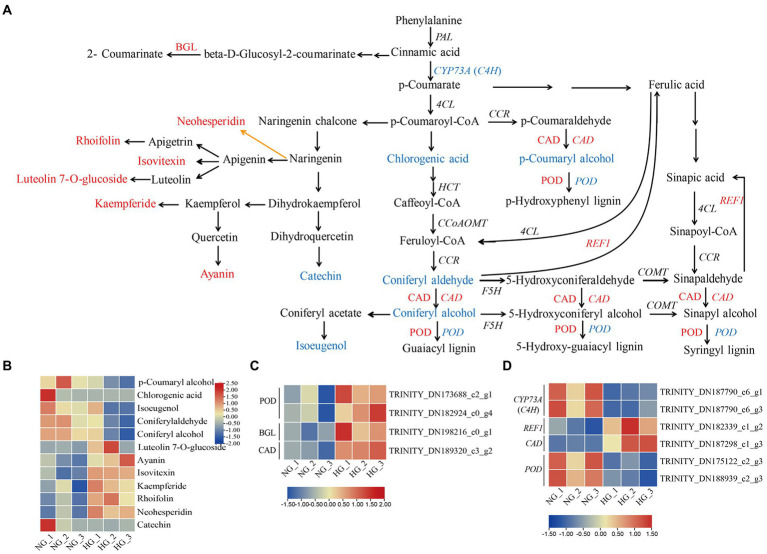
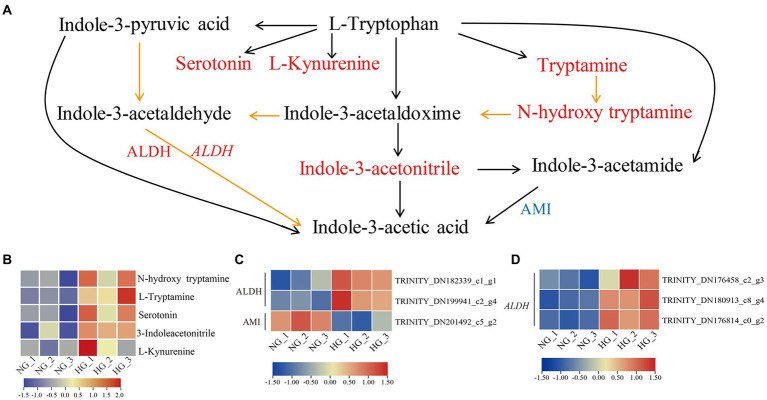
Heavy grazing significantly reduces Stipa grandis growth. To enhance our understanding of plant responses to heavy grazing, we conducted transcriptomic, proteomic, and metabolic analyses of the leaves of non-grazed plants (NG) and heavy-grazing-induced dwarf plants (HG) of S. grandis. A total of 101 metabolites, 167 proteins, and 1,268 genes differed in abundance between the HG and NG groups. Analysis of Kyoto Encyclopedia of Genes and Genomes pathways among differentially accumulated metabolites (DAMs) revealed that the most enriched pathways were flavone and flavonol biosynthesis, tryptophan metabolism, and phenylpropanoid biosynthesis. An integrative analysis of differentially expressed genes (DEGs) and proteins, and DAMs in these three pathways was performed. Heavy-grazing-induced dwarfism decreased the accumulation of DAMs enriched in phenylpropanoid biosynthesis, among which four DAMs were associated with lignin biosynthesis. In contrast, all DAMs enriched in flavone and flavonol biosynthesis and tryptophan metabolism showed increased accumulation in HG compared with NG plants. Among the DAMs enriched in tryptophan metabolism, three were involved in tryptophan-dependent IAA biosynthesis. Some of the DEGs and proteins enriched in these pathways showed different expression trends. The results indicated that these pathways play important roles in the regulation of growth and grazing-associated stress adaptions of S. grandis. This study enriches the knowledge of the mechanism of heavy-grazing-induced growth inhibition of S. grandis and provides valuable information for restoration of the productivity in degraded grassland.
Keywords: Stipa grandis; heavy grazing; metabolic; proteomic; transcriptomic.
Copyright © 2022 Wan, Wan, Zhang, Wang and Ding.
Conflict of interest statement
The authors declare that the research was conducted in the absence of any commercial or financial relationships that could be construed as a potential conflict of interest.
Figures
Similar articles
-
Transcriptome-Wide Gene Expression Plasticity in Stipa grandis in Response to Grazing Intensity Differences.Int J Mol Sci. 2021 Nov 2;22(21):11882. doi: 10.3390/ijms222111882. Int J Mol Sci. 2021. PMID: 34769324 Free PMC article.
-
De novo assembly and transcriptomic profiling of the grazing response in Stipa grandis.PLoS One. 2015 Apr 13;10(4):e0122641. doi: 10.1371/journal.pone.0122641. eCollection 2015. PLoS One. 2015. PMID: 25875617 Free PMC article.
-
Transcriptome and metabolome analyses of Shatian pomelo (Citrus grandis var. Shatinyu Hort) leaves provide insights into the overexpression of the gibberellin-induced gene CcGASA4.Front Plant Sci. 2022 Nov 3;13:1022961. doi: 10.3389/fpls.2022.1022961. eCollection 2022. Front Plant Sci. 2022. PMID: 36407630 Free PMC article.
-
Underlying mechanism on source-sink carbon balance of grazed perennial grass during regrowth: Insights into optimal grazing regimes of restoration of degraded grasslands in a temperate steppe.J Environ Manage. 2021 Jan 1;277:111439. doi: 10.1016/j.jenvman.2020.111439. Epub 2020 Oct 6. J Environ Manage. 2021. PMID: 33035939
-
Integrated metabolomic and transcriptomic analyses of regulatory mechanisms associated with uniconazole-induced dwarfism in banana.BMC Plant Biol. 2022 Dec 28;22(1):614. doi: 10.1186/s12870-022-04005-w. BMC Plant Biol. 2022. PMID: 36575388 Free PMC article.
Cited by
-
Iron-modified biochar modulates root metabolism, mitigates antimony accumulation and enhances growth in rice (Oryza sativa).BMC Plant Biol. 2025 Aug 8;25(1):1037. doi: 10.1186/s12870-025-07071-y. BMC Plant Biol. 2025. PMID: 40781602 Free PMC article.
References
-
- Balcke G. U., Bennewitz S., Bergau N., Athmer B., Henning A., Majovsky P., et al. . (2017). Multi-Omics of tomato glandular Trichomes reveals distinct features of central carbon metabolism supporting high productivity of specialized metabolites. Plant Cell 29, 960–983. doi: 10.1105/tpc.17.00060, PMID: - DOI - PMC - PubMed
LinkOut - more resources
Full Text Sources