. 2022 Nov 3:13:1024239.
doi: 10.3389/fpls.2022.1024239. eCollection 2022.

The gastrodin biosynthetic pathway in Pholidota chinensis Lindl. revealed by transcriptome and metabolome profiling

Affiliations

The gastrodin biosynthetic pathway in Pholidota chinensis Lindl. revealed by transcriptome and metabolome profiling

Baocai Liu et al. Front Plant Sci. .

Abstract

Pholidota chinensis Lindl. is an epiphytic or lithophytic perennial herb of Orchidaceae family used as a garden flower or medicinal plant to treat high blood pressure, dizziness and headache in traditional Chinese medicine. Gastrodin (GAS) is considered as a main bioactive ingredient of this herb but the biosynthetic pathway remains unclear in P. chinensis. To elucidate the GAS biosynthesis and identify the related genes in P. chinensis, a comprehensive analysis of transcriptome and metabolome of roots, rhizomes, pseudobulbs and leaves were performed by using PacBio SMART, Illumina Hiseq and Ultra Performance Liquid Chromatography Tandem Mass Spectrometry (UPLC-MS/MS). A total of 1,156 metabolites were identified by UPLC-MS/MS, of which 345 differential metabolites were mainly enriched in phenylpropanoid/phenylalanine, flavone and flavonol biosynthesis. The pseudobulbs make up nearly half of the fresh weight of the whole plant, and the GAS content in the pseudobulbs was also the highest in four tissues. Up to 23,105 Unigenes were obtained and 22,029 transcripts were annotated in the transcriptome analysis. Compared to roots, 7,787, 8,376 and 9,146 differentially expressed genes (DEGs) were identified in rhizomes, pseudobulbs and leaves, respectively. And in total, 80 Unigenes encoding eight key enzymes for GAS biosynthesis, were identified. Particularly, glycosyltransferase, the key enzyme of the last step in the GAS biosynthetic pathway had 39 Unigenes candidates, of which, transcript28360/f2p0/1592, was putatively identified as the most likely candidate based on analysis of co-expression, phylogenetic analysis, and homologous searching. The metabolomics and transcriptomics of pseudobulbs versus roots showed that 8,376 DEGs and 345 DEMs had a substantial association based on the Pearson's correlation. This study notably enriched the metabolomic and transcriptomic data of P. chinensis, and it provides valuable information for GAS biosynthesis in the plant.

Keywords: Pholidota chinensis; gastrodin; metabolome; molecular mechanism; transcriptome.


Conflict of interest statement

The authors declare that the research was conducted in the absence of any commercial or financial relationships that could be construed as a potential conflict of interest.

Figures

Figure 1
Figure 1
The morphological characteristics and growing environment of P. chinensis. (A), Wild growth environment and plants growing on stone surfaces; (B), the whole plant; (C), Roots (designated as B1 for the rest of the sample analysis); (D), Rhizomes (designated as B2 for the rest of the sample analysis); (E), pseudobulbs (designated as B3 for the rest of the sample analysis); and (F) leaves (designated as B4 for the rest of the sample analysis) were analyzed; (G), Artificially cultivated plants in a garden.
Figure 2
Figure 2
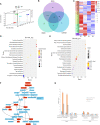
Metabolomes and differential expression of metabolomes (DEMs) of different tissues in P. chinensis by UPLC-MS analysis. (A), PCA analysis of all samples. Scattered dots in different colors represent samples from different experimental groups; (B), Venn diagram of annotations in KEGG, HMDB and Lipdmaps database; (C), DEMs clustering heatmap of roots, rhizomes, pseudobulbs and leaves, and divided into five clusters in different color on the left heatmap and marked 1, 2, 3, 4, 5 on the right heatmap. Expression value was calculated based on Log2 Fold change. (D), DEMs of B3 vs B1 on negative ion mode in KEGG pathway enrichment; (E), DEMs of B3 vs B1 on positive ion mode in KEGG pathway enrichment; (F), Phenylpropanoid biosynthesis by Metaboanalyst on line analyses. Red boxes were detected and annotated KEGG components; (G), Gastrodin and 4-Hydroxybenzyl alcohol contents of different tissues by HPLC in dry and fresh P. chinensis. PCA, Principal component analysis; KEGG, Kyoto Encyclopedia of Genes and Genomes; Roots (B1), rhizomes (B2), pseudobulbs (B3) and leaves (B4).
Figure 3
Figure 3
Transcripts functional annotation of P. chinensis in NR, NT, Pfam, KOG/COG, Swiss-prot, KEGG, GO databases and analysis. (A): Statistics of the transcripts annotated in different databases. (B): Venn diagram of annotations in NR, GO, KEGG, KOG, and NT databases. (C): Distribution of the top 20 species with matched transcripts in the NR database. 1. Elaeis guineensis, 2. Phoenix dactylifera, 3. Ananas comosus, 4. Musa acuminate, 5. Asparagus officinalis, 6. Anthurium amnicola, 7. Nelumbo nucifera, 8. Dendrobium catenatum, 9. Vitis vinifera, 10. Hordeum vulgare, 11. Zea mays, 12. Oryza sativa, 13. Theobroma cacao, 14. Cajanus cajan, 15. Klebsormidium flaccidum, 16. Erycina pusilla, 17. Glycine max. 18. Ipomoea nil, 19. Prunus persica, 20. Setaria italic. (D): Distribution of GO terms for all annotated transcripts in biological process, cellular component, and molecular function. (E): KEGG pathways annotation by all transcripts. (F): KOG categories of the annotation transcripts. NR, Non-Redundant Protein Sequence Database; NT, Nucleotide Sequence Database; Pfam, database of a large collection of protein families; KOG/COG, EuKaryotic Orthologous Groups of proteins/Clusters Orthologous Groups of proteins; Swiss-prot, annotated protein database and as such an absolute requirement in the toolbox of any protein chemist; KEGG, Kyoto Encyclopedia of Genes and Genomes; GO, gene ontology.
Figure 4
Figure 4
Different expression genes (DEGs) of roots (B1), rhizomes (B2), pseudobulbs (B3) and leaves (B4) in P. chinensis. (A), DEGs statistics of B2 vs B1, B3 vs B1, B4 vs B1. The blue bar represents all DEGs, red bar represents up-regulated DEGs, and green bar represents down-regulated DEGs; (B), Venn diagram of DEGs in different comparison groups. The circle color of pink, orange, green, blue, red and black represents B1 vs B2, B1 vs B3, B1 vs B4, B2 vs B3, B2 vs B4 and B3 vs B4, respectively; (C), Enriched GO terms of DEGs in B3 vs B1. The red bar represents up regulation and the blue bar represents down regulation. (D), Enriched KEGG pathway of DEGs in B3 vs B1. The size of the dots represented the number of DEGs. Red and blue represented high and low expression levels, respectively. GO, gene ontology; DEGs, different expression genes.
Figure 5
Figure 5
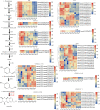
Putative gastrodin biosynthesis pathway in P. chinensis. This pathway was constructed based on the KEGG pathway (map00940, map01061) and literature references. The expression levels deduced from the RMPK of each Unigene that encodes the relevant enzyme, were shown as heat map, whereas roots (triplicates as B11, B12, B13), rhizomes (triplicates as B21, B22, B23), pseudobulbs (triplicates as B31, B32, B33) and leaves (triplicates as B41, B42, B43) were separately analyzed. The expression value was calculated based on the Log2 Fold change. Red and blue represented high and low expression levels, respectively. Non-dashed line arrows represent identified enzymatic reactions, and dashed line arrows represent multiple enzymatic reactions through multiple steps.
Figure 6
Figure 6
Verification of six selected DEGs by qRT-PCR. Comparison of RNA-seq data (Blue line chart) with qRT-PCR data (Yellow bar graph). The relative qRT-PCR expression level of selected DEGs is shown on the y-axis to the left. β-tubulin (TUB) was used as the internal control. Three biological replicates were used. The normalized expression level (FPKM; expected number of Fragments Per Kilobase of transcript sequence per Millions base pairs sequenced) of RNA-seq is indicated on the y-axis to the left.
Figure 7
Figure 7
Phylogenetic tree analysis of glucosyltransferase. The constructed phylogenetic tree includes the amino acid sequences of 80 UGT enzymes of 8 species represented by different shapes on the left legends (Pholidota chinensis, Rhodiola sachalinensis, Arabidopsis thaliana, Zea mays, Dendrobium catenatum, Rauvolfia serpentina serpentine, Apostasia shenzhenica, Phalaenopsis equestris). The 80 UGT enzymes are clustered into 8 types and displayed with different colors on the left legends and chart. The candidate gene clustering positions obtained in this study are in the red box.
Figure 8
Figure 8
The KEGG enrichment bubble chart of co-expression DEMs and DEGs in B2 vs B1, B3 vs B1 and B4 vs B1 group. Dots represent DEMs. Triangles represent DEGs. Dots or triangles size represent enriched in the pathway number of metabolites or genes. “P value” is the p value of the transcription or metabolism pathway enrichment. (A, C, E), negative ion mode, (B, D, F), positive ion mode.

Similar articles

Cited by

References

    1. Acosta-Estrada B. A., Gutierrez-Uribe J. A., Serna-Saldivar S. O. (2014). Bound phenolics in foods, a review. Food Chem. 152, 46–55. doi: 10.1016/j.foodchem.2013.11.093 - DOI - PubMed
    1. Bae E. K., An C., Kang M. J., Lee S. A., Lee S. J., Kim K. T., et al. . (2022). Chromosome-level genome assembly of the fully mycoheterotrophic orchid gastrodia elata. G3 Genes|Genomes|Genetics (Bethesda) 12 (3), 3. doi: 10.1093/g3journal/jkab433 - DOI - PMC - PubMed
    1. Bai Y. F., Yin H., Bi H. P., Zhuang Y. B., Liu T., Ma Y. H. (2016). De novo biosynthesis of gastrodin in escherichia coli. Metab. Eng. 35, 138–147. doi: 10.1016/j.ymben.2016.01.002 - DOI - PubMed
    1. Camp E. F., Kahlke T., Signal B., Oakley C. A., Lutz A., Davy S. K., et al. . (2022). Proteome metabolome and transcriptome data for three symbiodiniaceae under ambient and heat stress conditions. Sci. Data 9, 153. doi: 10.1038/s41597-022-01258-w - DOI - PMC - PubMed
    1. Cheng Q. Q., Ouyang Y., Tang Z. Y., Lao C. C., Zhang Y. Y., Cheng C. S., et al. . (2021). Review on the development and applications of medicinal plant genomes. Front. Plant Sci. 12. doi: 10.3389/fpls.2021.791219 - DOI - PMC - PubMed

LinkOut - more resources