. 2022 Nov 3:13:1030584.
doi: 10.3389/fpls.2022.1030584. eCollection 2022.

PacBio full-length sequencing integrated with RNA-seq reveals the molecular mechanism of waterlogging and its recovery in Paeonia ostii

Affiliations

PacBio full-length sequencing integrated with RNA-seq reveals the molecular mechanism of waterlogging and its recovery in Paeonia ostii

Xiaoxiao Zhang et al. Front Plant Sci. .

Abstract

Paeonia ostii, a widely cultivated tree peony species in China, is a resourceful plant with medicinal, ornamental and oil value. However, fleshy roots lead to a low tolerance to waterlogging in P. ostii. In this study, P. ostii roots were sequenced using a hybrid approach combining single-molecule real-time and next-generation sequencing platforms to understand the molecular mechanism underlying the response to this sequentially waterlogging stress, the normal growth, waterlogging treatment (WT), and waterlogging recovery treatment (WRT). Our results indicated that the strategy of P. ostii, in response to WT, was a hypoxic resting syndrome, wherein the glycolysis and fermentation processes were accelerated to maintain energy levels and the tricarboxylic acid cycle was inhibited. P. ostii enhanced waterlogging tolerance by reducing the uptake of nitrate and water from the soil. Moreover, transcription factors, such as AP2/EREBP, WRKY, MYB, and NAC, played essential roles in response to WT and WRT. They were all induced in response to the WT condition, while the decreasing expression levels were observed under the WRT condition. Our results contribute to understanding the defense mechanisms against waterlogging stress in P. ostii.

Keywords: hypoxia; transcriptome; tree peony; waterlogging; waterlogging recovery.


Conflict of interest statement

The authors declare that the research was conducted in the absence of any commercial or financial relationships that could be construed as a potential conflict of interest.

Figures
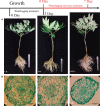
Figure 1
Figure 1
Morphological changes of the control (CK), waterlogging treatment (WT), and waterlogging recovery treatment (WRT) of P. ostii. and anatomic (A), Root morphology; (B), Cell morphology of root tip.
Figure 2
Figure 2
Physiological changes of the control (CK), waterlogging treatment (WT), and waterlogging recovery treatment (WRT) of P. ostii. (A), Root activity; (B), Relative electrical conductivity of root. Values represent mean ± standard deviation (SD), and letters indicate significant differences according to Duncan’s multiple range test (p < 0.05).
Figure 3
Figure 3
The distribution and expression levels of DEGs in P. ostii roots. (A), Volcano plot of waterlogging treatment (CK VS WT); (B), Volcano plot of waterlogging recovery treatment (WT VS WRT); (C), Venn diagram of DEGs under waterlogging and its recovery treatment. The x-axis represents the log2 [Fold Change] values under the mean normalized expression of all isoforms (y-axis).
Figure 4
Figure 4
GO enrichment classification of DEGs in P. ostii roots. (A), Waterlogging treatment (CK VS WT); (B), Waterlogging recovery treatment (WT VS WRT).
Figure 5
Figure 5
KEGG enrichment analysis of DEGs in P. ostii roots. (A), Waterlogging treatment (CK VS WT); (B), Waterlogging recovery treatment (WT VS WRT).
Figure 6
Figure 6
DEGs coding transcription factors based on their assigned protein families in P. ostii roots. (A), Waterlogging treatment (CK VS WT); (B), Waterlogging recovery treatment (WT VS WRT); (C), Heatmap of DEGs coding transcription factors under waterlogging treatment; (D), Heatmap of DEGs coding transcription factors under waterlogging recovery treatment.
Figure 7
Figure 7
Waterlogging and waterlogging recovery caused genes encoding proteins involved in glycolysis, fermentation, citrate cycle (A), ethylene biosynthesis (B), nitrogen metabolism (C). The red character represents DEGs in both CK VS WT and WT VS WRT. INV, invertase; SUS, sucrose synthase; G6PC, glucose-6-phosphatase; PGM, phosphoglucomutase; GPI, glucose-6-phosphate isomerase; PFK, 6-phosphofructokinase; FBA, fructose-bisphosphate aldolase; GAPDH, glyceraldehyde-3-phosphate dehydrogenase; PGAM, phosphoglycerate mutase; PPH, phosphopyruvate hydratase; PK, pyruvate kinase; PDC, pyruvate decarboxylase; ADH, alcohol dehydrogenase; LDH, lactate dehydrogenase; CS, citrate synthase; MDH, malate dehydrogenase; SDH, succinate dehydrogenase; SCS, succinyl-CoA synthetase; OGOR, 2-oxoglutarate/2-oxoacid ferredoxin oxidoreductase; IDH, isocitrate dehydrogenase; GDH, glutamate decarboxylase; ACS, 1-aminocyclopropane-1-carboxylate synthase; ACO, 1-aminocyclopropane-1-carboxylate oxidase; AP2/EREBP, apetala 2/ethylene-responsive element binding protein; NTR, Nitrate transporter; NR, Nitrate reductase; NiR, Nitrite reductase; NOR, Nitric-oxide reductase; NOS, Nitrous-oxide reductase.
Figure 8
Figure 8
Quantitative real-time PCR validation of key genes. Actin was used as the reference gene. Expression values were normalized such that the expression levels of CK were set to 1. GAPDH, glycer-aldehyde-3-phosphate dehydrogenase; PK, pyruvate kinase; PDC, pyruvate decarboxylase; ADH, alcohol dehydrogenase; MDH, malate dehydrogenase; IDH, isocitrate dehydrogenase; GDH, glutamate decarboxylase; ACO, 1-aminocyclopropane-1-carboxylate oxidase; AQP, aquaporin; NRT, nitrate transporter. Values represent mean ± standard deviation (SD), and letters indicate significant differences according to Duncan’s multiple range test (p < 0.05).

Similar articles

Cited by

References

    1. Altschul S. F., Gish W., Miller W., Myers E. W., Lipman D. J. (1990). Basic local alignment search tool. J. Mol. Biol. 215, 403–410. doi: 10.1016/S0022-2836(05)80360-2 - DOI - PubMed
    1. Bailey-Serres J., Fukao T., Gibbs D. J., Holdsworth M. J., Lee S. C., Licausi F., et al. . (2012). Making sense of low oxygen sensing. Trends Plant Sci. 17, 129–138. doi: 10.1016/j.tplants.2011.12.004 - DOI - PubMed
    1. Bailey-Serres J., Voesenek L. A. C. J. (2008). Flooding stress: acclimations and genetic diversity. Annu. Rev. Plant Biol. 59, 313–339. doi: 10.1146/annurev.arplant.59.032607.092752 - DOI - PubMed
    1. Chang Y., Hu T., Zhang W., Zhou L., Wang Y., Jiang Z. (2019). Transcriptome profiling for floral development in reblooming cultivar ‘High noon’ of Paeonia suffruticosa . Sci. Data 6, 217. doi: 10.1038/s41597-019-0240-1 - DOI - PMC - PubMed
    1. Chao Q., Gao Z.-F., Zhang D., Zhao B.-G., Dong F.-Q., Fu C.-X., et al. . (2019). The developmental dynamics of the Populus stem transcriptome. Plant Biotechnol. J. 17, 206–219. doi: 10.1111/pbi.12958 - DOI - PMC - PubMed