. 2022 Nov 4:13:954929.
doi: 10.3389/fpls.2022.954929. eCollection 2022.

Multispecies transcriptomes reveal core fruit development genes

Affiliations

Multispecies transcriptomes reveal core fruit development genes

Alex Rajewski et al. Front Plant Sci. .

Abstract

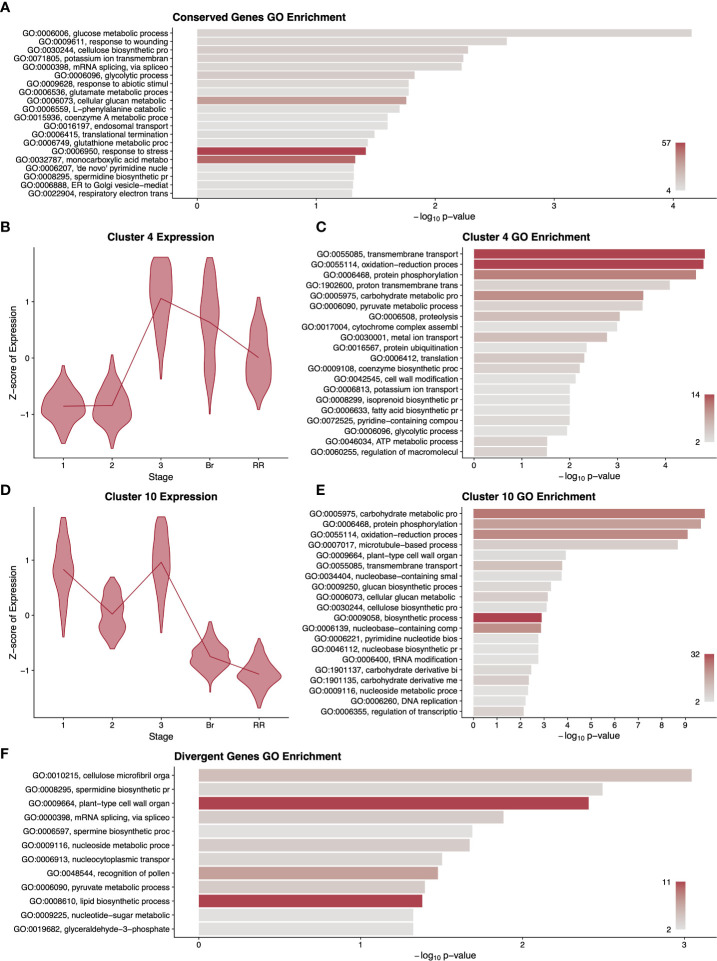
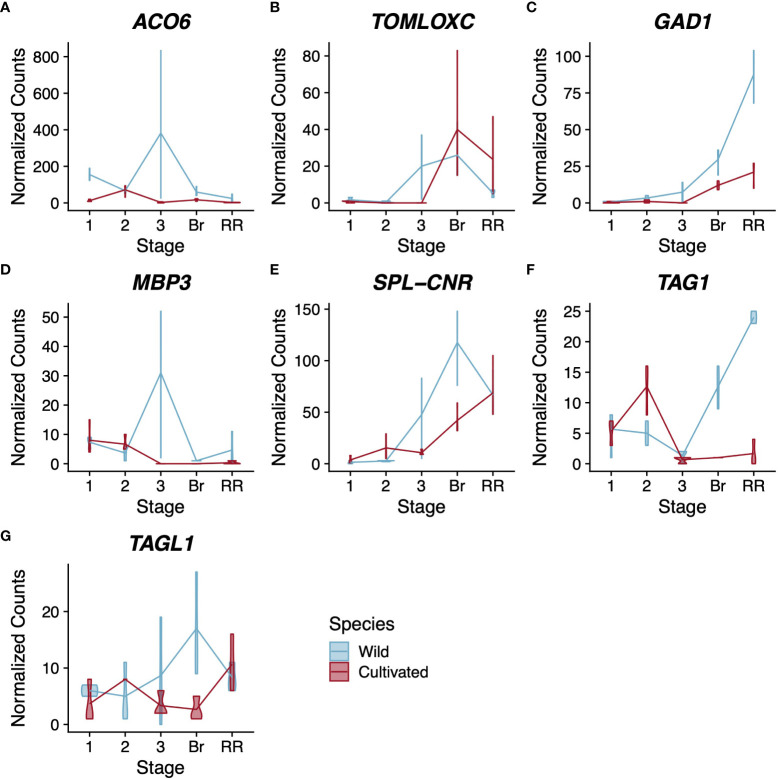
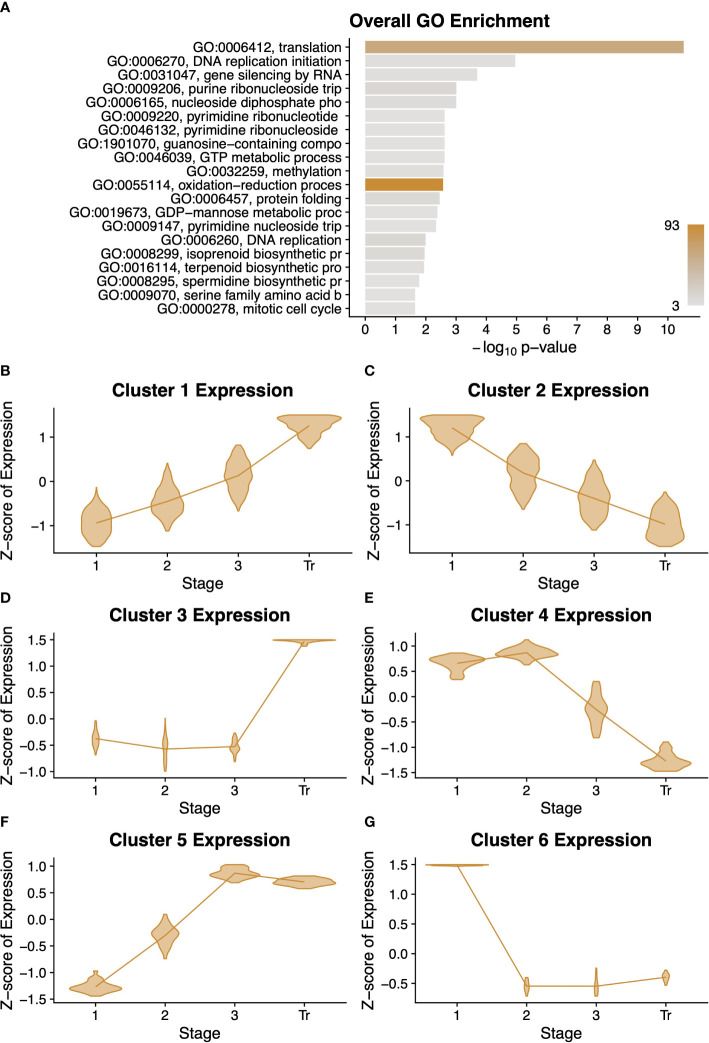
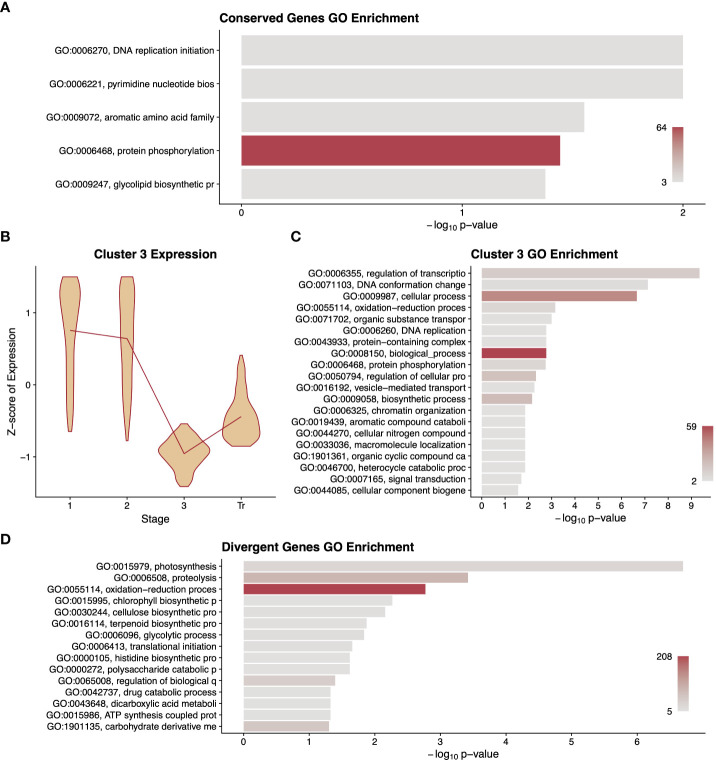
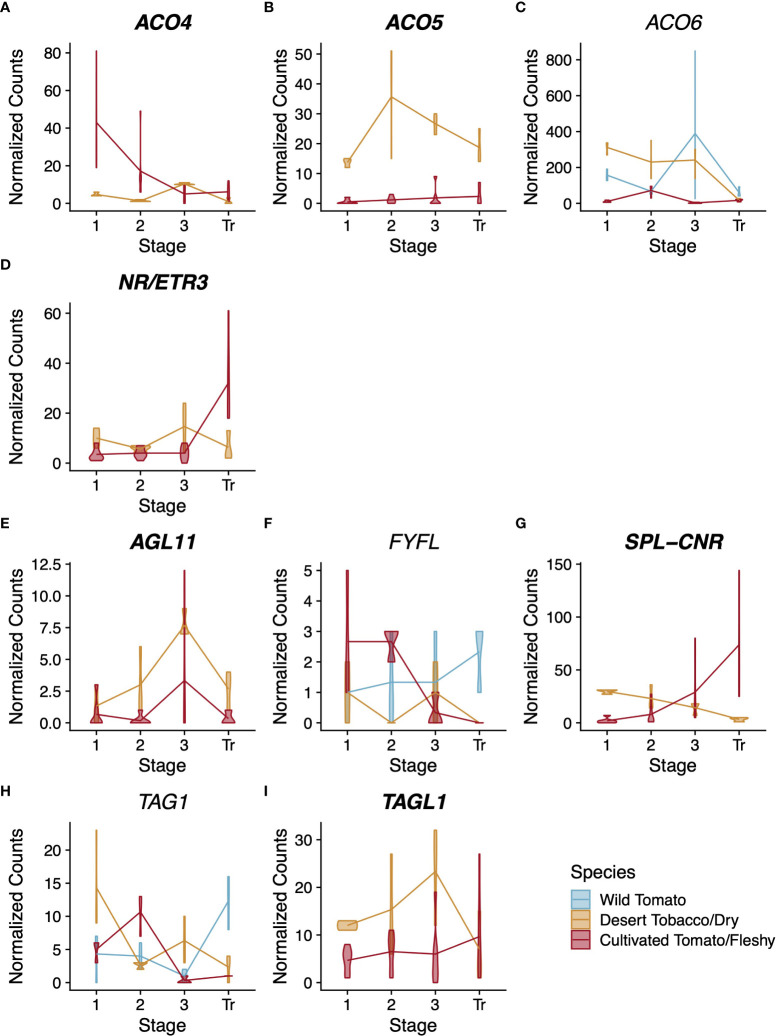
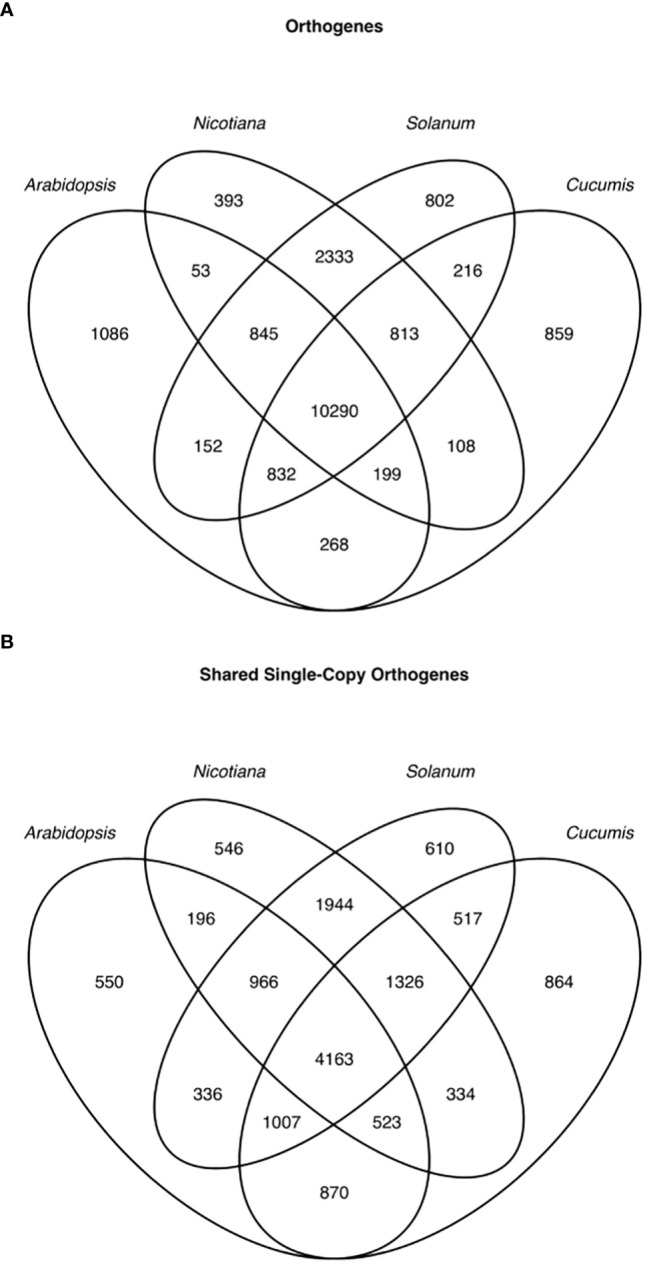
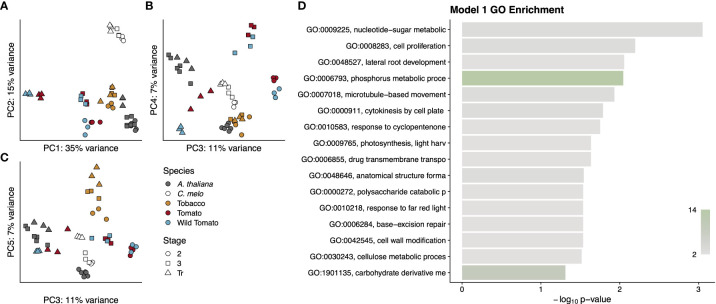
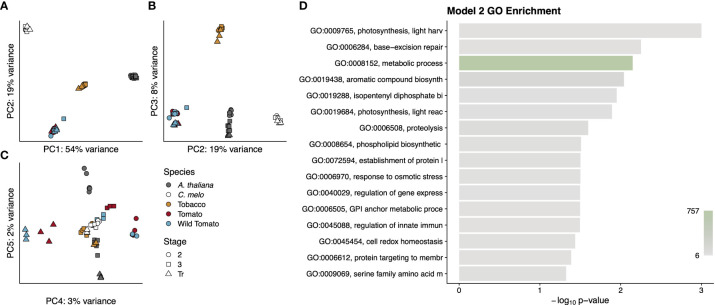
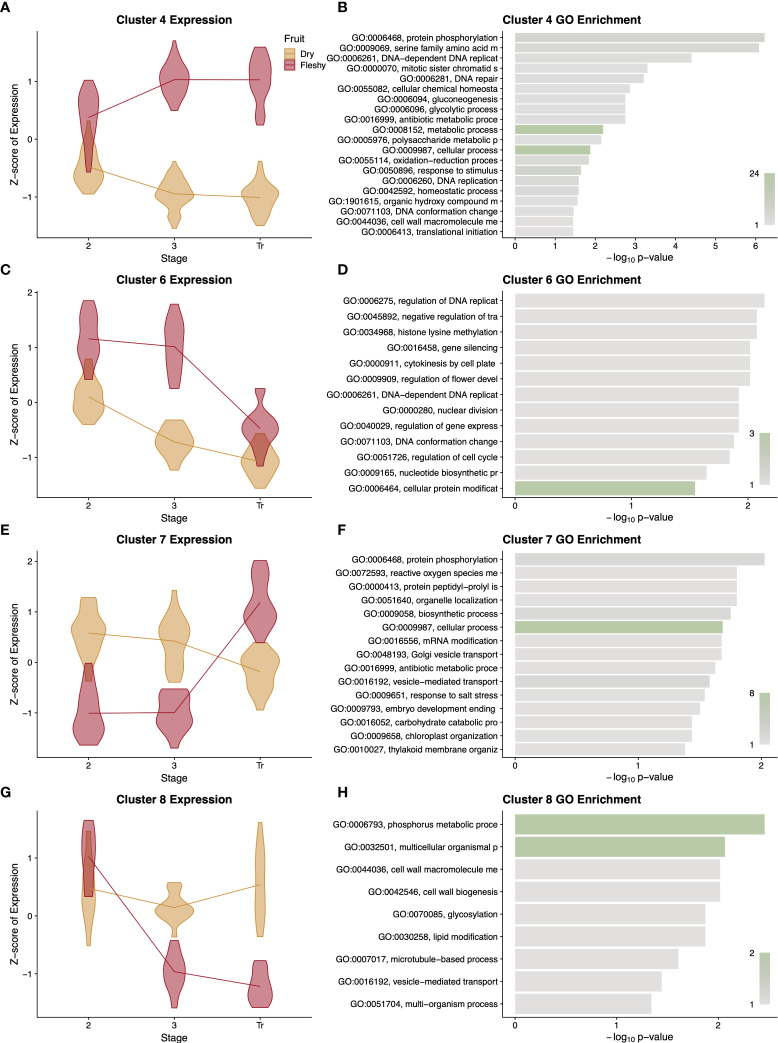
During angiosperm evolution there have been repeated transitions from an ancestral dry fruit to a derived fleshy fruit, often with dramatic ecological and economic consequences. Following the transition to fleshy fruits, domestication may also dramatically alter the fruit phenotype via artificial selection. Although the morphologies of these fruits are well documented, relatively less is known about the molecular basis of these developmental and evolutionary shifts. We generated RNA-seq libraries from pericarp tissue of desert tobacco and both cultivated and wild tomato species at common developmental time points and combined this with corresponding, publicly available data from Arabidopsis and melon. With this broadly sampled dataset consisting of dry/fleshy fruits and wild/domesticated species, we applied novel bioinformatic methods to investigate conserved and divergent patterns of gene expression during fruit development and evolution. A small set of 121 orthologous "core" fruit development genes show a common pattern of expression across all five species. These include key players in developmental patterning such as orthologs of KNOLLE, PERIANTHIA, and ARGONAUTE7. GO term enrichment suggests that these genes function in basic cell division processes, cell wall biosynthesis, and developmental patterning. We furthermore uncovered a number of "accessory" genes with conserved expression patterns within but not among fruit types, and whose functional enrichment highlights the conspicuous differences between these phenotypic classes. We observe striking conservation of gene expression patterns despite large evolutionary distances, and dramatic phenotypic shifts, suggesting a conserved function for a small subset of core fruit development genes.

Keywords: transcriptome; Arabidopsis; Solanaceae; dry fruit; fleshy fruit; melon; tobacco; tomato.


Conflict of interest statement

The authors declare that the research was conducted in the absence of any commercial or financial relationships that could be construed as a potential conflict of interest.

Figures

Figure 1
Figure 1
Summary of gene expression patterns conserved (A–E) or divergent (F) among cultivated and wild tomato. A gene ontology (GO) term enrichment analysis (A) performed on all differentially expressed genes without regard to species. Selected clusters of differentially expressed genes conserved among species are described with violin plots of normalised expression at each stage of development (B, D) and with GO enrichment analyses (C, E), corresponding to 1415 and 1825 genes respectively. For differentially expressed genes with divergent expression between the species, we performed a GO enrichment analysis (F). GO term descriptions to the left of the enrichment graphs are truncated for space and sorted by p-value. The bars are colored by the number of genes assigned to each GO term with legends in the lower right of each graph. Stages of fruit development in the axis of B and D are numbered sequentially followed by “Br” for breaker stage and “RR” for red ripe stage.
Figure 2
Figure 2
Expression profiles for ethylene-related (A), flavour compound-related (B–D), and regulatory (D–G) genes. Normalised counts of gene expression are represented by violin plots. Genes with statistically significant (FDR<0.01) differential expression across stages are shown in bold. Wild tomato is shown in blue and cultivated in red. Stages of fruit development on the X-axis are numbered sequentially followed by “Br” for breaker stage and “RR” for red ripe stage Note that panels have independent Y-axis to maximise readability.
Figure 3
Figure 3
Summary of desert tobacco differentially expressed genes. A gene ontology (GO) term enrichment analysis (A) performed on all 1351 differentially expressed genes. All clusters of differentially expressed genes are described with violin plots of normalised expression at each stage of development (B–G) comprising. Stages of fruit development in the axis of (B–G) are numbered sequentially followed by “Tr” for transition to mature stage.
Figure 4
Figure 4
Summary of differentially expressed orthologous genes. A gene ontology (GO) term enrichment analysis (A) performed on differentially expressed genes that had conserved patterns among the three species. A representative cluster of 796 differentially expressed genes conserved among species is described with violin plots of normalised expression at each stage of development (B) along with a GO enrichment analysis (C) of the genes in that cluster. A gene ontology (GO) term enrichment analysis (D) performed on differentially expressed genes that had different patterns between fruit types. GO term descriptions to the left of the enrichment graphs are truncated for space and sorted by p-value. The bars are colored by the number of genes assigned to each GO term with legends in the lower right of the graph. Stages of fruit development in the axis of B-GD are numbered sequentially followed by “Tr” for transition to mature stage.
Figure 5
Figure 5
Expression profiles for ethylene-related (A–D) and regulatory (E–I) genes across the three solanaceous species. Normalised counts of gene expression are represented by violin plots. Genes with statistically significant (FDR<0.01) differential expression across stages are shown in bold. Dry-fruited desert tobacco values are shown in yellow. When the expression pattern is better described by individual species trends (based on a likelihood ratio test), wild tomato violin plots are shown in blue and cultivated tomato plots in red, otherwise both tomato species are shown together in red. Stages of fruit development on the X-axis are numbered sequentially followed by “Tr” for transition to maturity stage. Note that panels have independent Y-axis to maximise readability.
Figure 6
Figure 6
Venn diagram of orthologous genes (orthogenes) among the 4 genera used in this study. All genes across the 4 genera (A) and only single-copy genes (B).
Figure 7
Figure 7
Summary of genes from Model 1. Principal components analysis (A–C) of gene expression values for each RNA-seq library. Points are colored by species and shaped by developmental stage as indicated in the legend. Principal components used for each graph are indicated on the axis along with the proportion of variance explained. A GO analysis (D) for the entire cohort of genes. GO term names to the left of the graph are truncated to available space. Terms are sorted by p-value, which is indicated by the bar height. Bars are colored by the number of genes annotated to that term, as indicated by the colour scale in the lower right.
Figure 8
Figure 8
Summary of genes from Model 2. Principal components analysis (A-C) of gene expression values for each RNA-seq library. Points are colored by species and shaped by developmental stage as indicated in the legend. Principal components used for each graph are indicated on the axis along with the proportion of variance explained. A GO analysis (D) for the entire cohort of genes. GO term names to the left of the graph are truncated to available space. Terms are sorted by p-value, which is indicated by the bar height. Bars are colored by the number of genes annotated to that term, as indicated by the colour scale in the lower right.
Figure 9
Figure 9
Summary of differentially expressed orthologous genes. Representative clusters of differentially expressed genes with patterns that differ between dry and fleshy fruited taxa are presented with violin plots of normalised expression at each stage of development (A, C, E, G) along with a GO enrichment analysis (B, D, F, H) of the genes in that cluster. Clusters 4, 6, 7, and 8 comprise 366, 102, 108, and 96 orthologous genes, respectively. GO term descriptions to the left of the enrichment graphs are truncated for space and sorted by p-value. The bars are colored by the number of genes assigned to each GO term with legends in the lower right of the graph. Stages of fruit development in the axis of (A, C, E, G) are numbered sequentially followed by “Tr” for transition to mature stage.

References

    1. Adams P., Davies J. N., Winsor G. W. (1978). Effects of nitrogen, potassium and magnesium on the quality and chemical composition of tomatoes grown in peat. J. Hortic. Sci. 53, 115–122. doi: 10.1080/00221589.1978.11514805 - DOI
    1. Adenot X., Elmayan T., Lauressergues D., Boutet S., Bouché N., Gasciolli V., et al. . (2006). DRB4-dependent TAS3 trans-acting siRNAs control leaf morphology through AGO7. Curr. Biol. 16, 927–932. doi: 10.1016/j.cub.2006.03.035 - DOI - PubMed
    1. Akihiro T., Koike S., Tani R., Tominaga T., Watanabe S., Iijima Y., et al. . (2008). Biochemical mechanism on GABA accumulation during fruit development in tomato. Plant Cell Physiol. 49, 1378–1389. doi: 10.1093/pcp/pcn113 - DOI - PubMed
    1. Alexa A., Rahnenfuhrer J. (2016). “topGO: Enrichment analysis for gene ontology,” in R package version 2.28. 0 (BioConductor; ). doi: 10.18129/B9.bioc.topGO - DOI
    1. Armbruster W. S. (2014). Floral specialization and angiosperm diversity: phenotypic divergence, fitness trade-offs and realized pollination accuracy. AoB. Plants 6, 1–24. doi: 10.1093/aobpla/plu003 - DOI - PMC - PubMed

LinkOut - more resources