. 2022 Nov 3:13:1022961.
doi: 10.3389/fpls.2022.1022961. eCollection 2022.

Transcriptome and metabolome analyses of Shatian pomelo (Citrus grandis var. Shatinyu Hort) leaves provide insights into the overexpression of the gibberellin-induced gene CcGASA4

Affiliations

Transcriptome and metabolome analyses of Shatian pomelo (Citrus grandis var. Shatinyu Hort) leaves provide insights into the overexpression of the gibberellin-induced gene CcGASA4

Tianli Wu et al. Front Plant Sci. .

Abstract

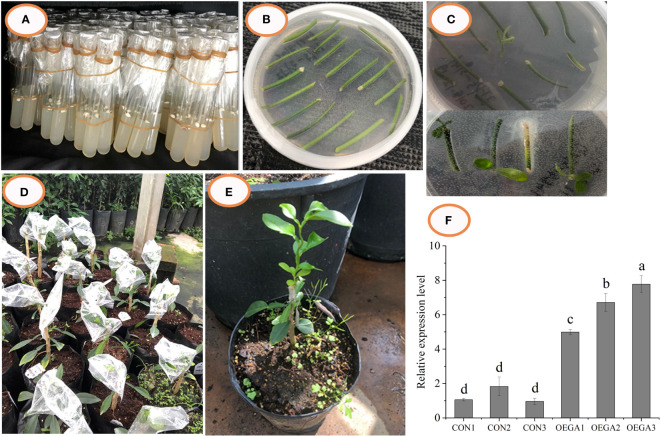
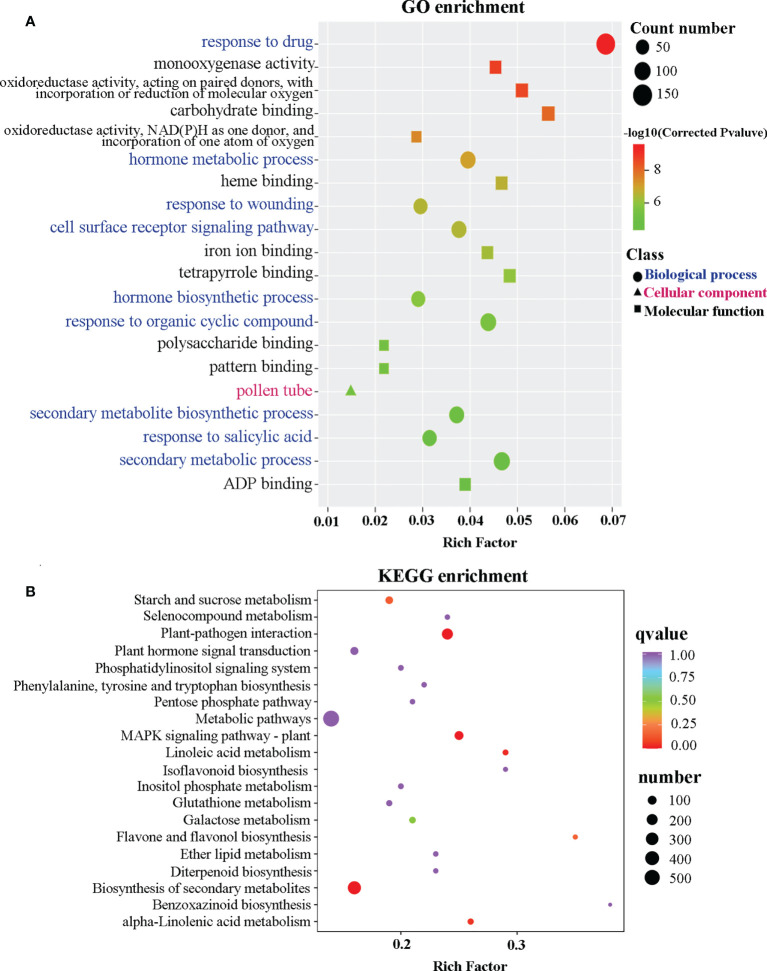
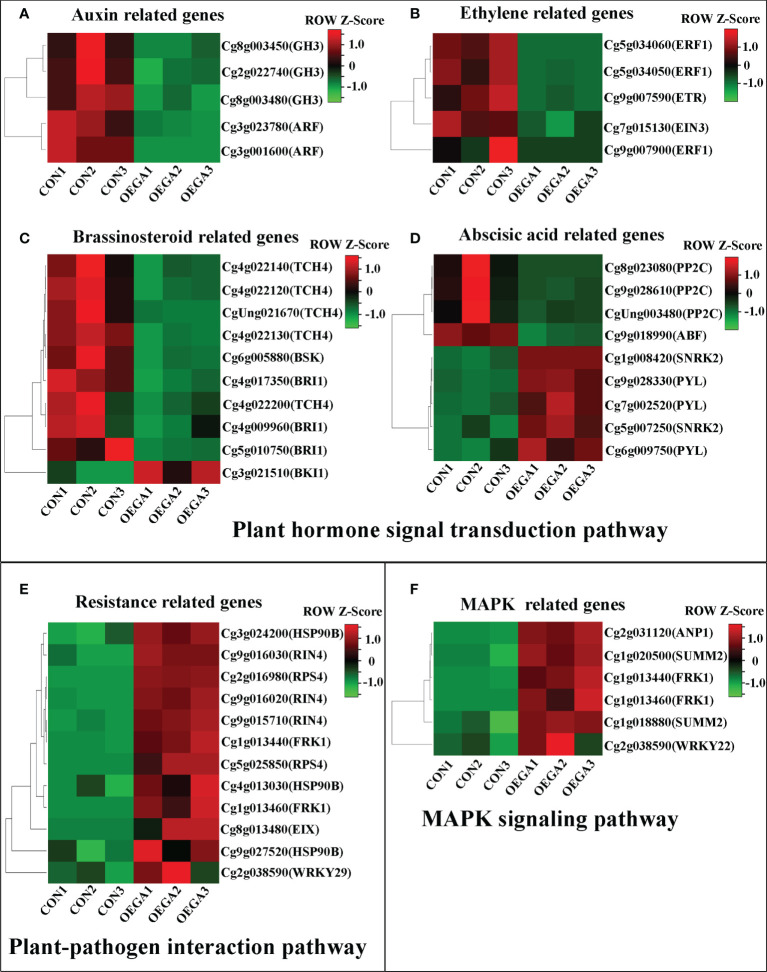
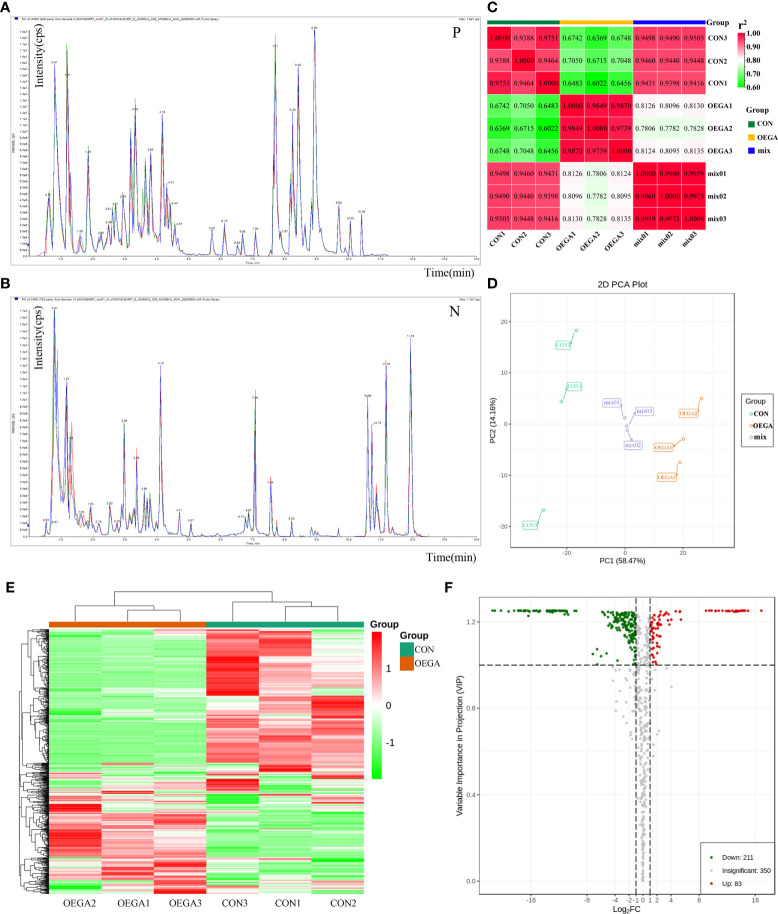
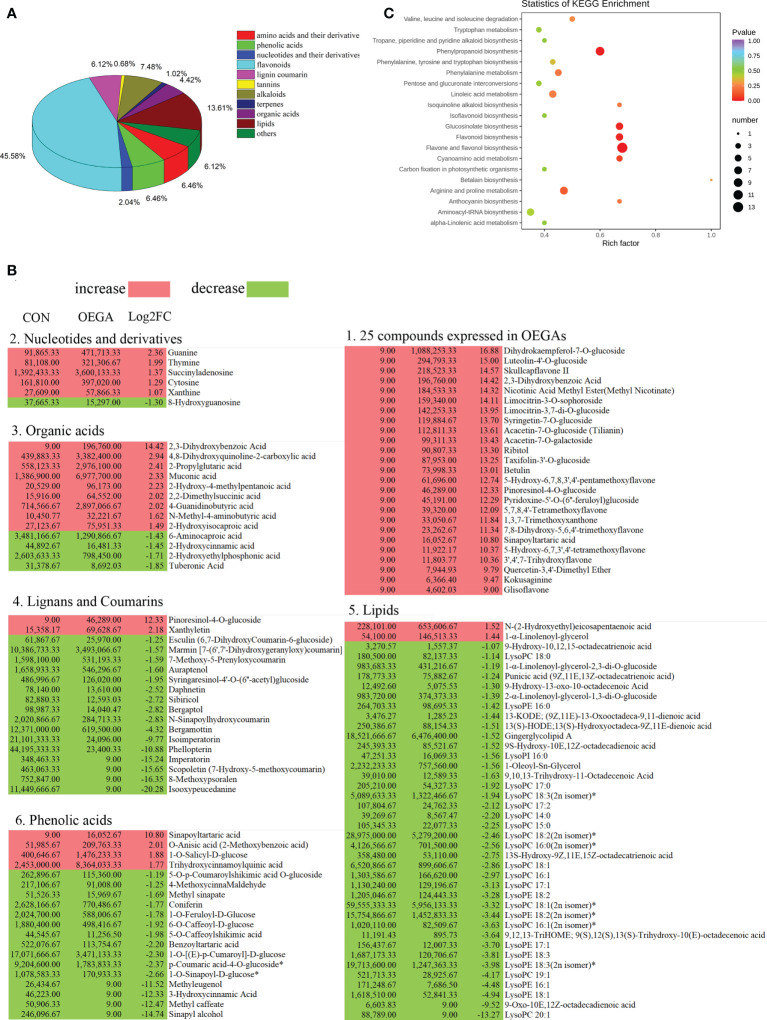
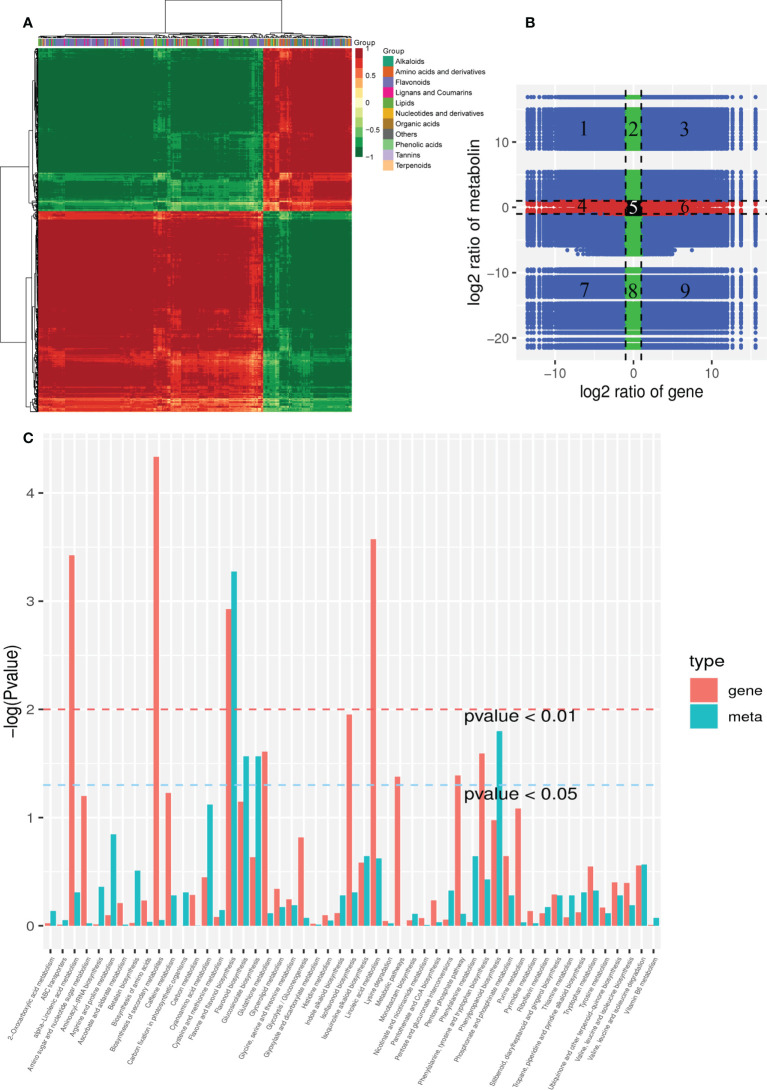
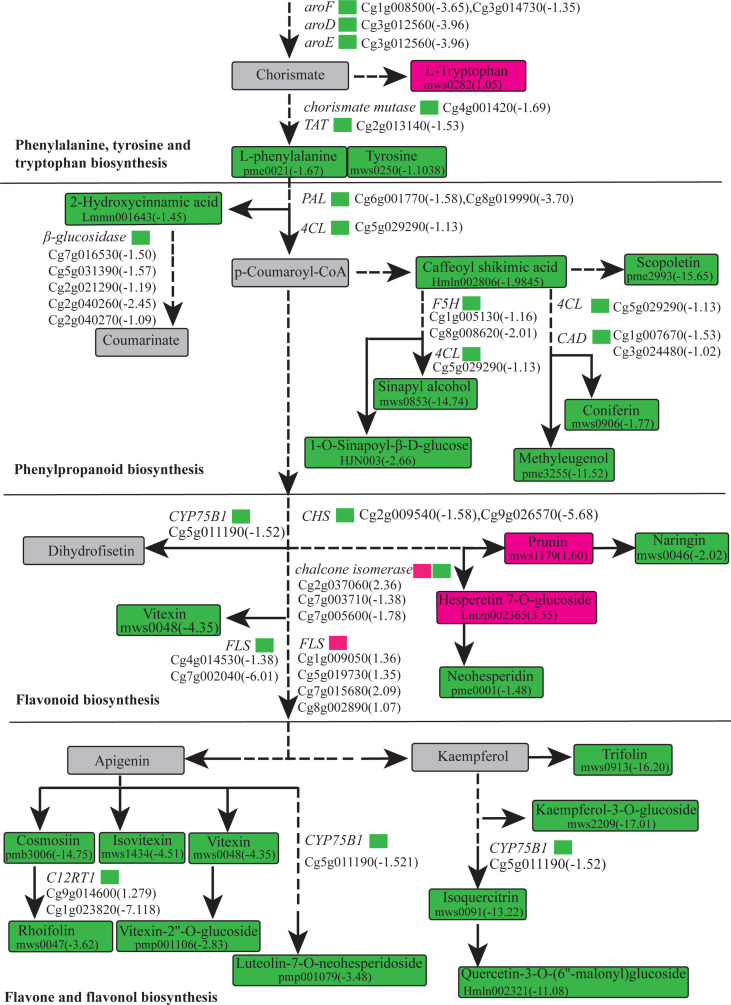
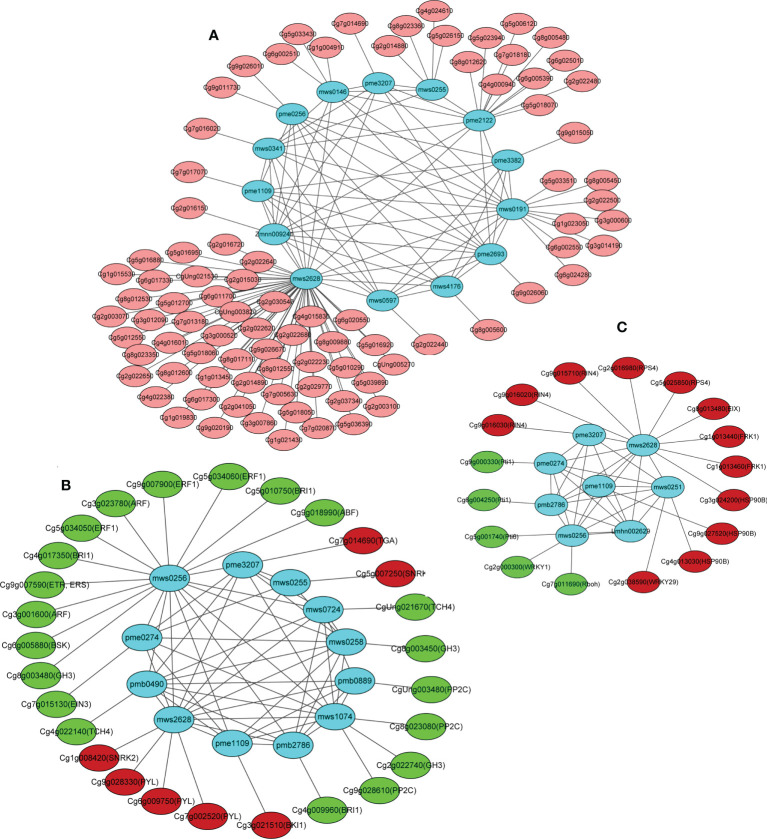
The gibberellic acid (GA)-stimulated Arabidopsis (GASA) gene family is highly specific to plants and plays crucial roles in plant growth and development. CcGASA4 is a member of the GASA gene family in citrus plants; however, the current understanding of its function in citrus is limited. We used CcGASA4-overexpression transgenic citrus (OEGA) and control (CON) plants to study the role of CcGASA4 in Shatian pomelo. The RNA sequencing (RNA-seq) analysis showed that 3,522 genes, including 1,578 upregulated and 1,944 downregulated genes, were significantly differentially expressed in the CON versus OEGA groups. The Gene Ontology enrichment analysis showed that 178 of the differentially-expressed genes (DEGs) were associated with flowers. A Kyoto Encyclopedia of Genes and Genomes (KEGG) enrichment analysis showed that the DEGs were enriched in 134 pathways, including "plant-pathogen interaction", "MAPK signaling pathway-plant", "phenylpropane biosynthesis", "plant hormone signal transduction", "phenylalanine, tyrosine and tryptophan biosynthesis", and "flavonoid and flavonol biosynthesis". The most significantly-enriched pathway was "plant-pathogen interaction", in which 203 DEGs were enriched (126 DEGs were upregulated and 78 were downregulated). The metabolome analysis showed that 644 metabolites were detected in the OEGA and CON samples, including 294 differentially-accumulated metabolites (DAMs; 83 upregulated versus 211 downregulated in OEGA compared to CON). The metabolic pathway analysis showed that these DAMs were mainly involved in the metabolic pathways of secondary metabolites, such as phenylpropanoids, phenylalanine, flavone, and flavonol biosynthesis. Thirteen flavonoids and isoflavones were identified as DAMs in OEGA and CON. We also discovered 25 OEGA-specific accumulated metabolites and found 10 that were associated with disease resistance. CcGASA4 may therefore play a functional role in activating the expression of MAPK signaling transduction pathway and disease resistance genes, inhibiting the expression of auxin- and ethylene-related genes, and activating or inhibiting the expression of brassinosteroid biosynthesis- and abscisic acid-related genes. CcGASA4 may also play a role in regulating the composition and abundance of flavonoids, isoflavones, amino acids, purines, and phenolic compounds. This study provides new insights into the molecular mechanisms of action of CcGASA4 in citrus plants.

Keywords: CcGASA4; Citrus; gibberellin; hormone; metabolome; plant–pathogen interaction; transcriptome.


Conflict of interest statement

The authors declare that the research was conducted in the absence of any commercial or financial relationships that could be construed as a potential conflict of interest.

Figures

Figure 1
Figure 1
Transgenic citrus plants overexpressing CcGASA4 were obtained through genetic transformation. (A–E) Process of Agrobacterium-mediated CcGASA4 genetic transformation. (A) citrus seeds were sown on MS medium; (B) dark culture; (C) light culture; (D) grafted resistant buds on rootstocks; (E) surviving resistant buds. (F) qRT-PCR analysis of CcGASA4 expression in the OEGA lines. Data are presented as the mean ± standard error (SE) of three qRT-PCR experiments. Different lowercase letters (a–d) on the bars indicate statistically-significant differences (P < 0.05) based on Duncan’s LSD multiple range test.
Figure 2
Figure 2
Scatter plot of the GO and KEGG enrichment analyses based on the DEGs. (A) Scatter plot of the GO enrichment analysis based on the DEGs. The ordinate represents a GO term. The abscissa indicates a rich factor. The greater the rich factor, the greater the degree of enrichment. The larger the point, the greater the number of DEGs enriched in the GO pathway. The redder the color of the dot, the more significant the enrichment. (B) Scatter plot of the DEGs enriched in the KEGG pathways. The ordinate indicates the KEGG pathway. The abscissa indicates a rich factor. The greater the rich factor, the greater the degree of enrichment. The larger the point, the greater the number of DEGs enriched in the KEGG pathway. The redder the color of the dot, the more significant the enrichment.
Figure 3
Figure 3
Heatmap of the DEGs in the OEGA and CON plants. (A–D) Heatmap of the plant hormone signal transduction pathway genes. (E) Heatmap of the plant–pathogen interaction pathway genes. (F) Heatmap of the MAPK pathway genes. The bar represents the scale of the expression levels of each gene (reads per kilobase per million mapped reads; FPKM) in the different samples, as indicated by the red and green rectangles. The metabolite production levels in the heatmaps were normalized by Z-scores. Genes in red indicate upregulation, whereas those in green indicate downregulation.
Figure 4
Figure 4
Metabolomics profiles of the citrus leaves from the OEGA and CON samples. (A) and (B) Overlapping analysis of the total ion current in the different quality control (QC) samples. The abscissa indicates the retention time (RT) of the metabolites, and the ordinate indicates the ion current intensity in counts per second (cps). The three different colors represent the three QC samples. N represents the negative ion mode, and P represents the positive ion mode. (C) Pearson’s correlation coefficients among the citrus samples CON, OEGA, and mix (QC). The abscissa and ordinate indicate corresponding sample names. The color represents the correlation coefficient (r2). (D) Principal component analysis of all the metabolites. OEGA: yellow; CON: green; mixed: purple. The abscissa represents the first principal component (PC1), and the ordinate represents the second principal component (PC2). The percentage indicates the interpretation rate of the principal components in the dataset. (E) Cluster heatmap of the differences in the metabolite content between the OEGA and CON groups. The sample name is indicated on the abscissa, and the metabolite information is shown on the ordinate. The cluster line on the left of the Figure is the metabolite cluster line, and that on the top of the Figure represents the sample cluster line. The different colors represent the values obtained after the relative content standardization process (red represents high content, and green represents low content). (F) Volcano plot of the differential metabolites. Green dots represent downregulated metabolites, red spots represent upregulated metabolites, and gray dots represent metabolites with insignificant differences.
Figure 5
Figure 5
Pathway enrichment analysis of the differential metabolites in the OEGA transgenic citrus. (A) Classification and proportion of the differentially-accumulated metabolites. The numbers next to the pie chart represent the percentage of different types of DAMs among the total differential metabolites. (B) Abundance of the significant DAMs among the different metabolite classes. Red and green indicate increased and decreased levels of metabolites, respectively, as indicated by the colored squares. Lysophosphatidylcholine, LysoPC; lysophosphatidylethanolamine, LysoPE. (C) Significantly-enriched KEGG metabolic pathways. The abscissa indicates the enrichment factor, and the ordinate indicates the enrichment pathway. The dot sizes represent the number of differentially-enriched metabolites. The greater the rich factor, the greater the degree of enrichment. The larger the point, the greater the number of differentially-enriched metabolites in the pathway. The significance of the enrichment level is indicated by the color of the dot according to the color scheme shown on the right.
Figure 6
Figure 6
Combined analysis of the transcriptome and metabolome. (A) Cluster analysis of the correlation coefficients between the DEGs and DAMs. (B) DEG and DAM foldchanges in a nine-quadrant plot. The x-axis represents the log2FC of the DEGs, where FC is the foldchange in gene expression; that is, the ratio of the FPKM of OEGA/FPKM of CON. The y-axis represents the log2FC of DAMs, where FC is the foldchange in the metabolite content between the OEGA and CON groups. Black dots represent unchanged genes or metabolites, green dots represent DAMs vs. unchanged gene expression, red dots represent DEGs vs. unchanged metabolites, and blue dots represent changes in gene expression and metabolites. The black dashed lines represent the thresholds for log2FC = 1 and divide the graph into nine quadrants. The metabolites and genes in the third and seventh quadrants showed consistent changes. (C) Joint KEGG enrichment P value histogram of the DEGs and DAMs in the CON and OEGA. The smaller the P value, the higher the degree of enrichment.
Figure 7
Figure 7
Biosynthetic pathway of the phenylpropane compounds.
Figure 8
Figure 8
Pearson’s correlation network model diagram of the DEGs and DAMs.(A) Cluster I network represents differentially expressed genes and metabolites associated with flowers. (B) Cluster II network represents plant hormone signal transduction pathway related DEGs and DAMs. (C) Cluster III network represents plant pathogen resistance-related DEGs and DAMs. Each blue node (circle) represents a metabolite. Significant metabolite–metabolite and gene–metabolite connections are represented by the edges (lines). A network graph was constructed using the correlation data for the CON and OEGA metabolites. Nodes without connections to other nodes were deleted. Red (or pink) and green colors represent up- or downregulation in the CON vs. OEGA groups, respectively.

Similar articles

References

    1. Aharoni A., De Vos C. H., Wein M., Sun Z. K., Greco R., Kroon A., et al. . (2010). The strawberry FaMYB1 transcription factor suppresses anthocyanin and flavonol accumulation in transgenic tobacco. Plant J. 28, 319–332. doi: 10.1046/j.1365-313X.2001.01154.x - DOI - PubMed
    1. Almaghamsi A., Nosarzewski M., Kanayama Y., Archbold D. D. (2020). Effects of abiotic stresses on sorbitol biosynthesis and metabolism in tomato (Solanum lycopersicum). Funct. Plant Biol. 48 (3), 286–297. doi: 10.1071/FP20065 - DOI - PubMed
    1. Alonso-Ramírez A., Rodríguez D., Reyes D., Jiménez J. A., Nicolás G., López-Climent M., et al. . (2009). Evidence for a role of gibberellins in salicylic acid-modulated early plant responses to abiotic stress in arabidopsis seeds. Plant Physiol. 150 (3), 1335–1344. doi: 10.1104/pp.109.139352 - DOI - PMC - PubMed
    1. Ashburner M., Ball C. A., Blake J. A., Botstein D., Michael Cherry J. (2000). Gene ontology: tool for the unification of biology. the gene ontology consortium. Nat. Genet. 25 (1), 25–29. doi: 10.1038/75556 - DOI - PMC - PubMed
    1. Aubert D., Chevillard M., Dorne A. M., Arlaud G., Herzog M. (1998). Expression patterns of GASA genes in Arabidopsis thaliana: the GASA4 gene is up-regulated by gibberellins in meristematic regions. Plant Mol. Biol. 36 (6), 871–883. doi: 10.1023/A:1005938624418 - DOI - PubMed

LinkOut - more resources