. 2022 Nov 2:15:1033224.
doi: 10.3389/fnmol.2022.1033224. eCollection 2022.

Expression of alternative transcription factor 4 mRNAs and protein isoforms in the developing and adult rodent and human tissues

Affiliations

Expression of alternative transcription factor 4 mRNAs and protein isoforms in the developing and adult rodent and human tissues

Alex Sirp et al. Front Mol Neurosci. .

Abstract

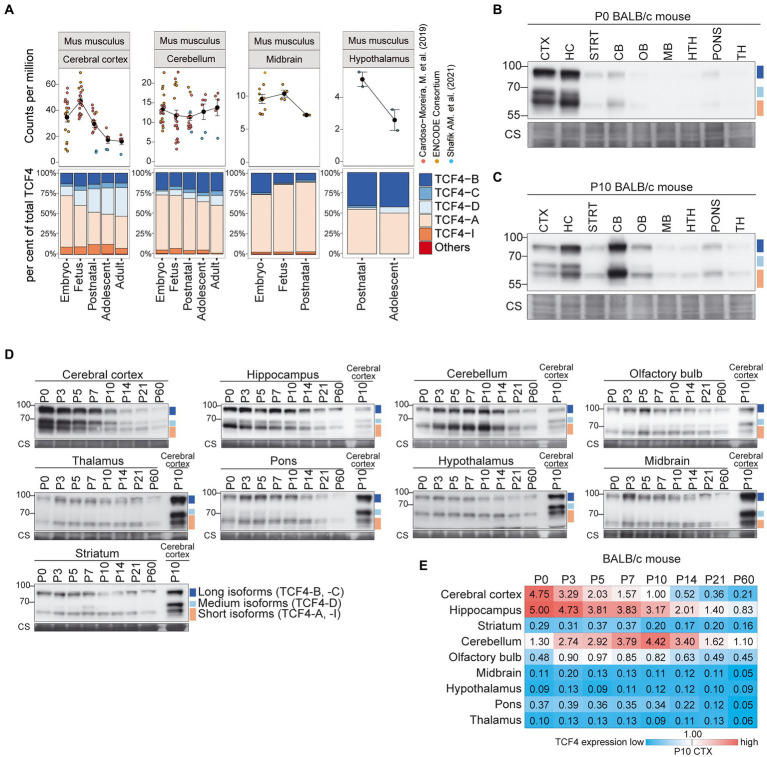
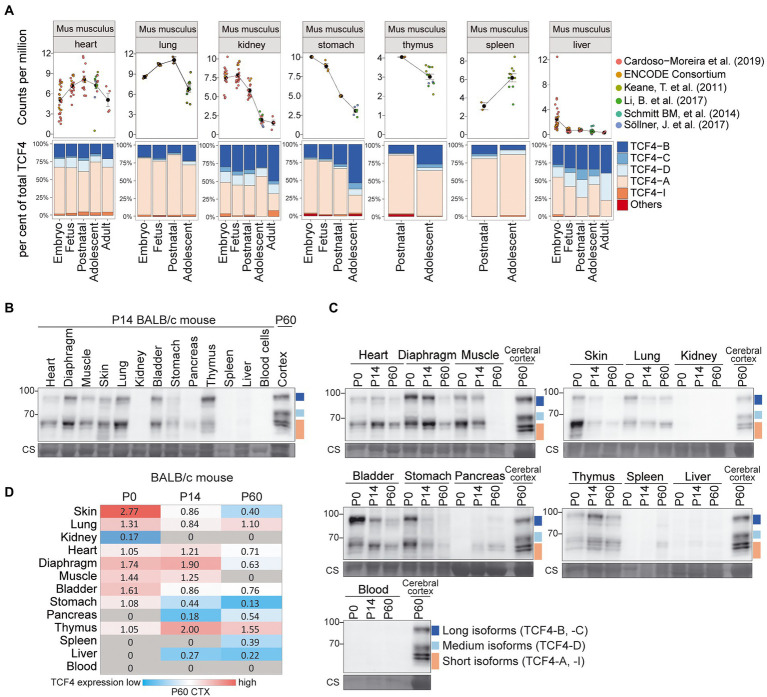
Transcription factor 4 (TCF4) belongs to the class I basic helix-loop-helix family of transcription factors (also known as E-proteins) and is vital for the development of the nervous system. Aberrations in the TCF4 gene are associated with several neurocognitive disorders such as schizophrenia, intellectual disability, post-traumatic stress disorder, depression, and Pitt-Hopkins Syndrome, a rare but severe autism spectrum disorder. Expression of the human TCF4 gene can produce at least 18 N-terminally distinct protein isoforms, which activate transcription with different activities and thus may vary in their function during development. We used long-read RNA-sequencing and western blot analysis combined with the analysis of publicly available short-read RNA-sequencing data to describe both the mRNA and protein expression of the many distinct TCF4 isoforms in rodent and human neural and nonneural tissues. We show that TCF4 mRNA and protein expression is much higher in the rodent brain compared to nonneural tissues. TCF4 protein expression is highest in the rodent cerebral cortex and hippocampus, where expression peaks around birth, and in the rodent cerebellum, where expression peaks about a week after birth. In human, highest TCF4 expression levels were seen in the developing brain, although some nonneural tissues displayed comparable expression levels to adult brain. In addition, we show for the first time that out of the many possible TCF4 isoforms, the main TCF4 isoforms expressed in the rodent and human brain and other tissues are TCF4-B, -C, -D, -A, and-I. Taken together, our isoform specific analysis of TCF4 expression in different tissues could be used for the generation of gene therapy applications for patients with TCF4-associated diseases.

Keywords: basic helix–loop–helix transcription factor; brain tissue; long-read RNA sequencing; neurodevelopment; peripheral tissue; transcription factor TCF4; western blot analysis.


Conflict of interest statement

JT and TT were employed by Protobios LLC. The remaining authors declare that the research was conducted in the absence of any commercial or financial relationships that could be construed as a potential conflict of interest.

Figures

Figure 1
Figure 1
Tcf4 mRNA isoforms expressed in the developing mouse cerebral cortex encode five N-terminally distinct protein isoforms. (A) Schema of experimental design for direct RNA-sequencing. The cerebral cortices of postnatal day 3 (P3) mice were collected, followed by RNA extraction and Tcf4 mRNA enrichment before direct long-read mRNA sequencing. A selection of Tcf4 transcripts mapped to the mouse Tcf4 locus is shown for reference. Black boxes represent exons and red lines show introns. Scale bar in kilobases is shown on top. Tcf4 transcripts encoding the different TCF4 isoforms (TCF4-B, -C, -D, -A, and-I) were quantified and the distribution is shown on the right. Each isoform is represented with different color as shown in the legend on the right. (B) Mouse Tcf4 genomic organization with exons drawn in scale. Exons are named according to the human TCF4 gene (Sepp et al., 2011). 5′ exons are shown as white boxes while internal and 3′ exons are shown as gray boxes. Exon names are shown below boxes. Numbers above the exons designate the size of the exon in base pairs. Roman numerals below exons show alternative splice sites. Regions encoding different domains are marked below the gene structure (AD1, NLS, AD3, AD2, and bHLH) as well as the epitope for the TCF4 antibody C-8 (Santa Cruz, SC) used in the present study. (C) Schematic structure of Tcf4 transcripts expressed in the developing mouse cerebral cortex. Untranslated regions are shown as white boxes and translated regions as blue boxes. Each transcript is named (shown on the left) according to the 5′ exon and with the number of the splice site where indicated. The names of the protein isoforms encoded by the transcripts are shown on the right. Positions of alternative splice region that generates full-length (FL), Δ, − and + isoforms are shown at the bottom. The position of the first in-frame start codon is shown with an arrow for each transcript and the common stop codon with an arrow at the bottom. AD, activation domain; NLS, nuclear localization signal; bHLH, basic helix–loop–helix; FL, full-length; and Δ, lack of exons 8–9.
Figure 2
Figure 2
TCF4 protein isoforms expressed in the mouse cerebral cortex can be grouped into long, medium, and short isoforms based on apparent molecular weight in SDS-PAGE. (A) Western blot analysis of different combinations of in vitro translated TCF4 isoforms (shown on the top) to identify the mobility of TCF4 isoforms in the lysates from the mouse cerebral cortex and Neuro2a cells in SDS-PAGE. (B) Western blot analysis of Neuro2a cells transfected with CRISPR-Cas9 silencing system. Two exon 10a-specific gRNAs were used to silence TCF4-A and three exon 3-specific gRNAs were used to silence TCF4-B. Cells overexpressing CRISPR-Cas9 vector without the exon-specific gRNA targeting sequence was used as control (CNTR). Mouse cerebral cortex tissue lysate was used to compare TCF4 isoform expression pattern to the pattern in Neuro2a cells. Locations of TCF4-A and TCF4-B isoforms are depicted on the right. Coomassie staining (CS) was used a loading control and is shown at the bottom. (C) Schematic layout of the locations of TCF4 isoforms in the protein lysate of the mouse cerebral cortex in western blot. TCF4 isoforms were grouped into three—long, medium and short isoforms. The locations of TCF4 isoform groups are color coded and shown on the right. In each panel, molecular weight is shown on the left in kilodaltons.
Figure 3
Figure 3
Protein expression of TCF4 in the mouse brain peaks around birth. (A,B) Western blot analysis of TCF4 protein expression through the pre-and postnatal development in the BALB/c (A) and C57BL/6 (B) mouse whole brain. Tissue lysates from the whole brain were made at different embryonic (E) and postnatal (P) days. The locations of TCF4 isoform groups are color coded and shown on the right. In each panel, molecular weight is shown on the left in kilodaltons. Under each western plot panel, a line graph depicting the quantification of long, medium, and short TCF4 protein isoforms during development is shown. TCF4 protein levels were normalized to the total TCF4 signal of the P10 cerebral cortex of the respective mouse strain.
Figure 4
Figure 4
Expression of TCF4 is high in the mouse cerebral cortex, hippocampus and cerebellum. (A) Three independent datasets from Cardoso-Moreira et al. (2019), ENCODE Consortium (ENCODE Project Consortium, 2012; Luo et al., 2020), and Shafik et al. (2021) were combined for meta-analysis of Tcf4 mRNA expression in mouse cerebral cortex, cerebellum, midbrain, and hypothalamus throughout development. mRNA expression of total Tcf4 is visualized as a line chart (upper panel) where the solid line connects the mean of Tcf4 expression for each developmental stage and error bars represent standard error of the mean (SEM). The distribution of isoform-specific transcripts is shown as bars (lower panel). Each isoform is represented with different color, as shown in the legend on the right. (B–D) Western blot analysis of TCF4 protein expression in different brain areas of BALB/c mouse at P0 (B), P10 (C), and throughout postnatal development (D). The examined brain areas are shown on the top of each panel together with the day of postnatal development. P10 cerebral cortex was used for normalization (D). Coomassie membrane staining (CS) shown at the bottom of each western blot was used as a loading control. The locations of TCF4 isoform groups are color coded and shown on the right. In each panel, molecular weight is shown on the left in kilodaltons. (E) TCF4 signals from western blot analysis of different brain areas of BALB/c mouse were quantified and normalized using Coomassie staining. The normalized signal from P10 cerebral cortex was set as 1, and the quantification results are visualized as a heatmap. Color scale gradient represents the relative TCF4 expression level, where blue and red color represents the lowest and the highest total TCF4 protein level, respectively. The studied brain regions are shown on the left and developmental stages on top. CTX, cerebral cortex; HC, hippocampus; CB, cerebellum; STRT, striatum; OB, olfactory bulb; MB, midbrain; HTH, hypothalamus; TH, thalamus; P, postnatal day; and CS, Coomassie staining.
Figure 5
Figure 5
Expression of TCF4 is high in the rat cerebral cortex, hippocampus, and cerebellum. (A) Dataset from Cardoso-Moreira et al. (2019) was analyzed for TCF4 expression in rat cerebral cortex and cerebellum throughout development. Total Tcf4 mRNA expression and the TCF4 isoform distribution was analyzed and visualized similarly to mouse. For more information see legend of Figure 4A. (B–D) Western blot analyses of TCF4 protein expression in different brain areas of WISTAR rat at P0 (B), P10 (C), and throughout postnatal development (D). For more details see legend of Figures 4B–D. (E) TCF4 signals from western blot analysis of different brain areas of WISTAR rat were quantified, normalized using Coomassie staining, and visualized as a heatmap. For more details see legend of Figure 4E. CTX, cerebral cortex; HC, hippocampus; CB, cerebellum; OB, olfactory bulb; MB, midbrain; HTH, hypothalamus; TH, thalamus; P, postnatal day; and CS, Coomassie staining.
Figure 6
Figure 6
Expression of TCF4 in mouse nonneural tissues. (A) Six independent datasets shown on the right were combined for meta-analysis of Tcf4 expression in mouse heart, lung, kidney, stomach, thymus, spleen, and liver throughout development. Total Tcf4 levels and the distribution of isoform-specific transcripts is visualized. For more information see legend of Figure 4A. (B,C) Western blot analysis of TCF4 protein expression in different nonneural tissues of BALB/c mouse at P14 (B), and throughout postnatal development (C). TCF4 signal from the P60 cerebral cortex was used in each experiment for normalization. Coomassie membrane staining (CS) shown at the bottom of each western blot was used as a loading control. The locations of TCF4 isoform groups are color coded and shown on the right. In each panel, molecular weight is shown on the left in kilodaltons. (D) TCF4 signals from western blot analysis of different peripheral tissues of BALB/c mouse were quantified and normalized using Coomassie staining. The signal was then normalized to the signal of the P60 cerebral cortex, and the quantification result is visualized as a heatmap. Color scale gradient represents the relative TCF4 expression level, where blue and red color represents the lowest and the highest total TCF4 protein level, respectively. Gray boxes indicate no detectable TCF4 expression. The studied nonneural tissues are shown on the left and developmental stages on top. P, postnatal day; CS, Coomassie staining.
Figure 7
Figure 7
Expression of TCF4 in rat nonneural tissues. (A) Three independent datasets shown on the right were combined for meta-analysis of Tcf4 expression in rat heart, muscle, lung, kidney, thymus, spleen, and liver throughout development. Total Tcf4 levels and the distribution of isoform-specific transcripts is visualized. For more information see Figure 4A. (B,C) Western blot analyses of TCF4 protein expression in different peripheral tissues of WISTAR rat at P14 (B), and throughout postnatal development (C). For more details see legend of Figures 6B,C. (D) TCF4 signals from western blot analysis of different nonneural tissues of WISTAR rat were quantified, normalized using Coomassie staining, and visualized as a heatmap. For more details see legend of Figure 6D. P, postnatal day; CTX, cerebral cortex.
Figure 8
Figure 8
TCF4 transcripts encoding TCF4-A account for the majority of total TCF4 expression in the human brain and nonneural tissues. Data from Cardoso-Moreira et al. (A) (Cardoso-Moreira et al., 2019) and the Genotype-Tissue Expression (GTEx) project (B) was analyzed for TCF4 expression in the brain and nonneural tissues in humans through development (A) or in adults (B). mRNA expression of total TCF4 is visualized either as a line chart (A) or box plot (B), and the distribution of isoform-specific transcripts is shown as bars (A,B). (A) Average values are presented as dots and error bars represent SEM. (B) The hinges show 25 and 75% quartiles, the horizontal line shows the median value, the upper whisker extends from the hinge to the largest value no further than 1.5 of the inter-quartile range from the hinge, the lower whisker extends from the hinge to the smallest value at most 1.5 * inter-quartile range of the hinge. Each isoform is represented with different color, as shown in the legend on the right. Individual data points are presented as small dots.
Figure 9
Figure 9
Expression of TCF4 protein isoforms in adult human cerebral cortex and hippocampus. Western blot analysis of TCF4 protein expression in the adult human cerebral cortex left (L) and right (R) hemisphere, hippocampus, and SH-SY5Y cell line. Samples from four individuals aged 62 (I), 65 (II), 67 (III), and 70 (IV) yearswere used. Coomassie staining (CS) shown at the bottom was used as loading control. The locations of TCF4 isoform groups are color coded and shown on the right. In each panel, molecular weight is shown on the left in kilodaltons. CS, coomassie staining.

Similar articles

Cited by

References

    1. Amiel J., Rio M., de Pontual L., Redon R., Malan V., Boddaert N., et al. . (2007). Mutations in TCF4, encoding a class I basic helix-loop-helix transcription factor, are responsible for Pitt-Hopkins syndrome, a severe epileptic encephalopathy associated with autonomic dysfunction. Am. J. Hum. Genet. 80, 988–993. doi: 10.1086/515582, PMID: - DOI - PMC - PubMed
    1. Badowska D. M., Brzózka M. M., Kannaiyan N., Thomas C., Dibaj P., Chowdhury A., et al. . (2020). Modulation of cognition and neuronal plasticity in gain-and loss-of-function mouse models of the schizophrenia risk gene Tcf4. Transl. Psychiatry 10:343. doi: 10.1038/s41398-020-01026-7, PMID: - DOI - PMC - PubMed
    1. Brockschmidt A., Todt U., Ryu S., Hoischen A., Landwehr C., Birnbaum S., et al. . (2007). Severe mental retardation with breathing abnormalities (Pitt–Hopkins syndrome) is caused by haploinsufficiency of the neuronal bHLH transcription factor TCF4. Hum. Mol. Genet. 16, 1488–1494. doi: 10.1093/hmg/ddm099, PMID: - DOI - PubMed
    1. Brzózka M. M., Radyushkin K., Wichert S. P., Ehrenreich H., Rossner M. J. (2010). Cognitive and sensorimotor gating impairments in transgenic mice overexpressing the schizophrenia susceptibility gene Tcf4 in the brain. Biol. Psychiatry 68, 33–40. doi: 10.1016/j.biopsych.2010.03.015, PMID: - DOI - PubMed
    1. Cardoso-Moreira M., Halbert J., Valloton D., Velten B., Chen C., Shao Y., et al. . (2019). Gene expression across mammalian organ development. Nature 571, 505–509. doi: 10.1038/s41586-019-1338-5, PMID: - DOI - PMC - PubMed

LinkOut - more resources