. 2022 Nov;2(11):1436-1448.
doi: 10.1158/2767-9764.crc-22-0337. Epub 2022 Nov 16.

The RPL/RPS gene signature of melanoma CTCs associates with brain metastasis

Affiliations

The RPL/RPS gene signature of melanoma CTCs associates with brain metastasis

Tetiana Y Bowley et al. Cancer Res Commun. 2022 Nov.

Abstract

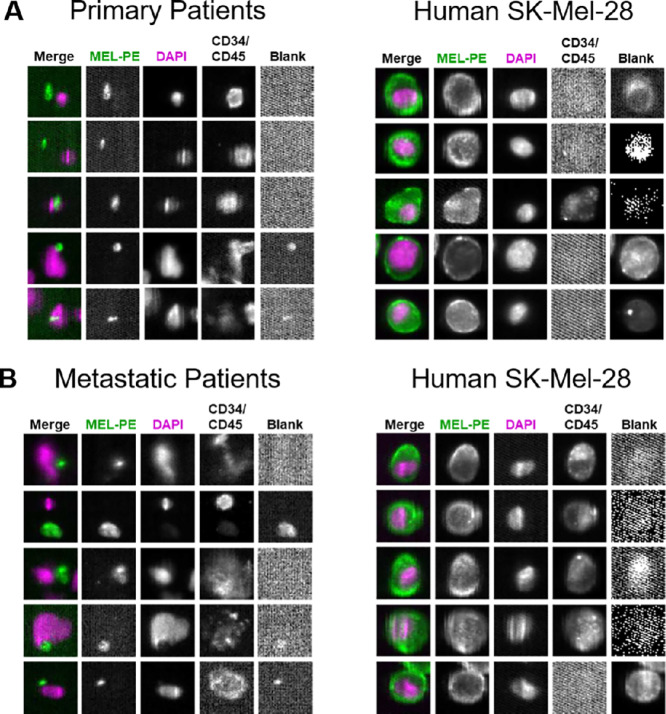
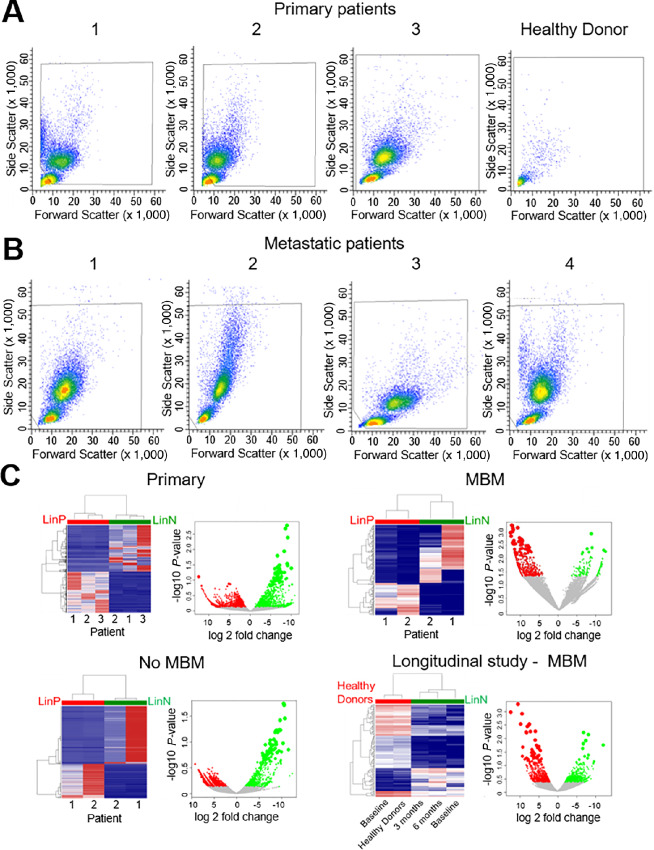
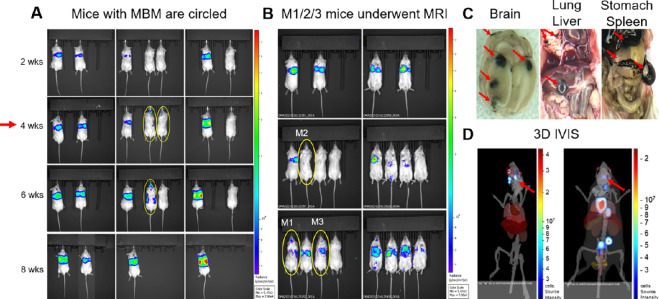
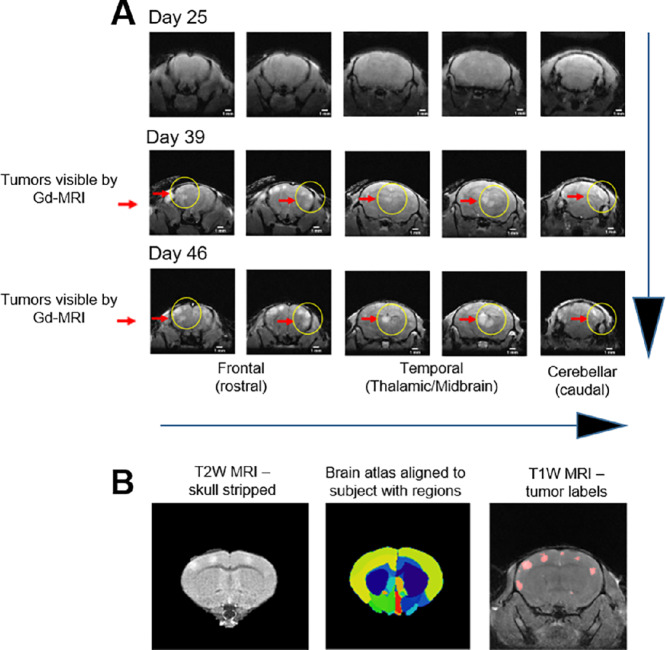
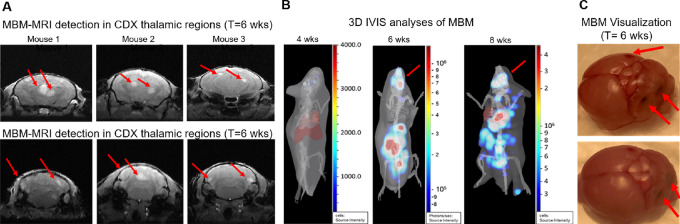
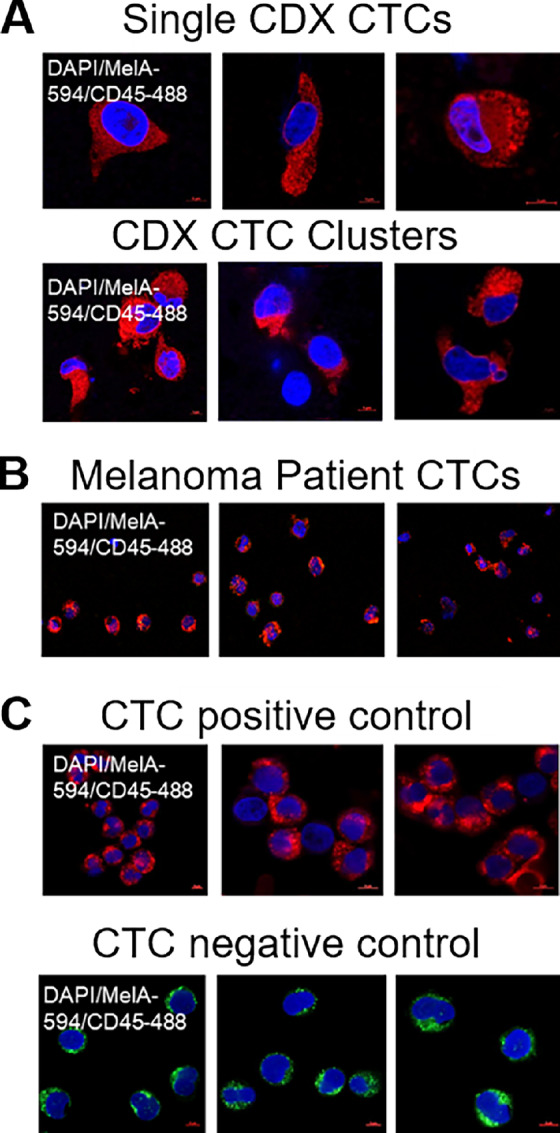
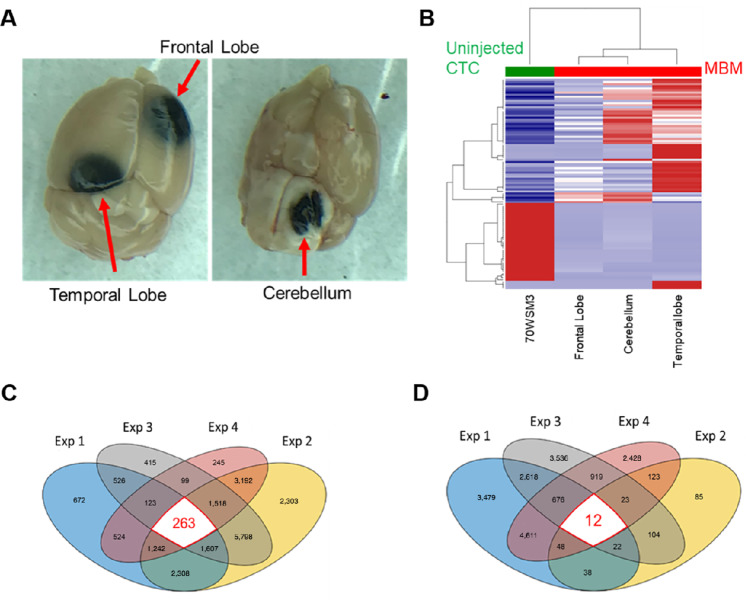
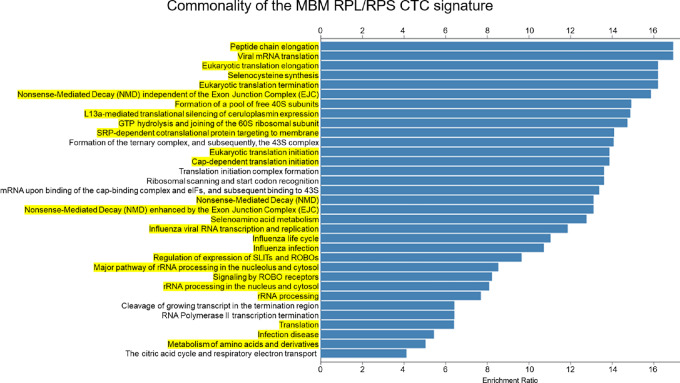
Melanoma brain metastasis (MBM) is linked to poor prognosis and low overall survival. We hypothesized that melanoma circulating tumor cells (CTCs) possess a gene signature significantly expressed and associated with MBM. Employing a multi-pronged approach, we provide first-time evidence identifying a common CTC gene signature for ribosomal protein large/small subunits (RPL/RPS) which associate with MBM onset and progression. Experimental strategies involved capturing, transcriptional profiling and interrogating CTCs, either directly isolated from blood of melanoma patients at distinct stages of MBM progression or from CTC-driven MBM in experimental animals. Second, we developed the first Magnetic Resonance Imaging (MRI) CTC-derived MBM xenograft model (MRI-MBM CDX) to discriminate MBM spatial and temporal growth, recreating MBM clinical presentation and progression. Third, we performed the comprehensive transcriptional profiling of MRI-MBM CDXs, along with longitudinal monitoring of CTCs from CDXs possessing/not possessing MBM. Our findings suggest that enhanced ribosomal protein content/ribogenesis may contribute to MBM onset. Since ribosome modifications drive tumor progression and metastatic development by remodeling CTC translational events, overexpression of the CTC RPL/RPS gene signature could be implicated in MBM development. Collectively, this study provides important insights for relevance of the CTC RPL/RPS gene signature in MBM, and identify potential targets for therapeutic intervention to improve patient care for melanoma patients diagnosed with or at high-risk of developing MBM.

Keywords: CTC transcriptional profiling; CTC-derived xenografts (CDXs); Circulating Tumor Cells (CTCs); Magnetic Resonance Imaging (MRI); Melanoma Brain Metastasis (MBM); Ribosomal proteins of large/small subunits (RPL/RPS) gene signature.


Conflict of interest statement

Conflicts of Interest: Authors declare no conflict of interest.

Figures

FIGURE 1
FIGURE 1
The capture, visualization, and enumeration of melanoma CTCs (MEL-PE+/DAPI+/CD34/CD45 cells) from patients’ blood using the CellSearch platform and CellSearch melanoma assay (Menarini Silicon Biosystems, Inc.). Peripheral blood (7.5 mL) was obtained from patients with primary (A) and metastatic (B) melanoma, and analyzed by CellSearch. No CTCs were detected in these patient samples as MEL-PE+/DAPI+/CD34/CD45 cells, according to CellSearch analyses. Cells from the human melanoma SK-Mel28 line (CellSearch melanoma CTC kit) were analyzed in parallel as positive control for (right). Displayed are the original CellSearch images using CellBrowser software (10x magnification).
FIGURE 2
FIGURE 2
Multiparametric flow cytometry gating for the isolation of viable Lin-negative/CTC-enriched populations from a number of independent patients with primary (A), and metastatic (B) melanoma. Enrichment of Lin-negative cell populations (CD45/CD34/CD73/CD90/CD105/CD235 cells) was performed, as reported previously (27). The same multiparametric FACS procedure was applied to healthy donor blood, showing no presence of Lin-negative cell population (negative control). C, Transcriptional profiling detailing discordance among Lin-positive (LinP) versus Lin-negative (LinN) cell populations, and LinN heterogeneity from independent patients with primary or metastatic (diagnosed with or without MBM) melanoma. Hierarchical clustering of gene expression profiling showing significant differences between the LinN (green) and LinP (red) cell populations isolated from primary, MBM, metastatic patients without MBM diagnosis (No MBM), and LinN cell populations isolated over time (0, 3, 6 months longitudinal collection) from a patient diagnosed with MBM, and compared with LinP cells isolated from blood of healthy donors, respectively. Each LinN/LinP population is patient paired (same patient). Scatter plots show global gene expression of LinN cell populations with significant log2 fold change (green dots), compared with LinP/healthy donor cell populations (red dots). See “Materials and Methods” for experimental details.
FIGURE 3
FIGURE 3
The generation of the MBM CTC xenograft model (MBM CDX). A, Immunodeficient (NSG) mice were injected intracardiacally with the MBM CTC-derived clone (5.0 × 10E5 70W-SM3-Luc2 cells), and subsequently imaged by IVIS to evaluate MBM onset with parallel pathologic examination. Consistent MBM (mice with yellow circles) was observed at 4 weeks postinjection (red arrow). B, Detection of CTC-driven MBM in 3 mice (circled in yellow) as early as 24 hours following CTC intracardiac injection. These mice were selected for longitudinal MRI MBM imaging (MRI-MBM CDXs). C, Parallel pathologic evaluation of CTC-injected mice detecting the presence of MBM along with metastasis to other organs (red arrows), reflecting the target organ metastatic specificity of clinical melanoma. D, 3D IVIS tomography of representative CTC MBM mice showing metastatic dissemination, notably to brain (MBM; red arrows). See “Materials and Methods” for experimental details.
FIGURE 4
FIGURE 4
A, Spatial and temporal MBM onset by MRI analyses using CDX mice (MRI-MBM CDXs). MRI-MBM CDXs underwent MRI analyses biweekly employing the Bruker 7-Tesla PET/MRI scanner. While no MBM was found at day 25 post-CTC injection, MRI detected the presence of MBM in all CDX mice at subsequent timepoints (day 39, day 46 after CTC injection) with specific MBM localization in the FL, PTL, and cerebellum regions (red arrows, yellow circles), reflecting the MBM presentation in patients. B, Spatial and temporal MRI analytic quantitation of MRI-MBM CDXs. Representative images of CTC-MBM CDXs employing the skull stripping procedure for removal of extra brain tissue to visualize brain tumors (left), brain atlas based MBM assessment showing alignment to 62 brain regions using ANTs Python program (middle), or T1W MRI displaying MBM sizes generated by the 3D Slicer software program (right). See “Materials and Methods” for experimental details.
FIGURE 5
FIGURE 5
Spatial and temporal MRI-MBM analyses of CDXs along with pathological assessment. The MRI-MBM detection in thalamic regions of the temporal and cerebellar regions of MRI-MBM CDXs was confirmed by 3D IVIS tomography showing MBM progression overtime (4–8 weeks, red arrows; A) and by pathologic evaluation for MBM presence in mice brain necropsies following MRI (B). Representative mouse brains with MBM (red arrows) are shown (C). See “Materials and Methods” for experimental details.
FIGURE 6
FIGURE 6
The capture and interrogation of CTCs from CDXs using the CTC Parsortix platform. Representative images of human melanoma CTCs captured/visualized by the CTC Parsortix platform, either as ex vivo single CTCs or homotypic CTC clusters from blood of MRI-MBM mice (N = 3; A), patients with MBM (N = 3; B), or as CTC-derived clonal cells (70W-SM3) spiked (positive control) in blood from healthy donors (negative control; N = 3; C). CTCs were defined for absence of human FITC-CD45 (green fluorescence); however, presence of human Melan-A/Alexa Fluor 594 (red fluorescence), and DAPI staining within the separation Parsortix cassette. Human Melan-A+/DAPI+/CD45 cells were then visualized and quantitated by confocal Zeiss LSM800 microscopy. See “Materials and Methods” for experimental details.
FIGURE 7
FIGURE 7
The hierarchical transcriptional classification of CTC-driven MBM. Regional specificity of CTC-driven MBM was detected in FL, temporal lobe, and cerebellum regions of CDXs (A), with a distinct MBM region–dependent transcriptional profiling/hierarchical clustering displaying unique gene expression patterns compared with uninjected CTC-derived clonal cell (70W-SM3-Luc2; B). Venn diagrams showing 263 upregulated (C) and 12 downregulated (D) genes as result of combinatorial gene expression analyses employing a four-pronged experimental approach consisting of transcriptome analyses of: (1) CTCs from MBM versus No MBM CDXs, (2) region-specific CTC MBM versus uninjected CTC-derived clonal cells, (3) LinN cells from MBM versus metastatic/primary patients, and (4) LinN cells longitudinally (0, 3, 6 months) isolated from a patient with MBM. See “Materials and Methods” for experimental details.
FIGURE 8
FIGURE 8
The CTC RPL/RPS gene pathways of MBM. List of the top molecular pathways resulting from the four-pronged experimental approach and hierarchal clustering of MBM samples (Reactome pathway database). Highlighted in yellow are CTC translational pathways containing the CTC RPL/RPS gene signature of MBM. See “Materials and Methods” for experimental details.

Similar articles

Cited by

References

    1. Eroglu Z, Holmen SL, Chen Q, Khushalani NI, Amaravadi R, Thomas R, et al. . Melanoma central nervous system metastases: an update to approaches, challenges, and opportunities. Pigment Cell Melanoma Res 2019;32:458–69. - PMC - PubMed
    1. Johnson JD, Young B. Demographics of brain metastasis. Neurosurg Clin N Am 1996;7:337–44. - PubMed
    1. Biermann J, Melms JC, Amin AD, Wang Y, Caprio LA, Karz A, et al. . Dissecting the treatment-naive ecosystem of human melanoma brain metastasis. Cell 2022;185:2591–608. - PMC - PubMed
    1. Fischer GM, Jalali A, Kircher DA, Lee W-C, McQuade JL, Haydu LE, et al. . Molecular profiling reveals unique immune and metabolic features of melanoma brain metastases. Cancer Discov 2019;9:628–45. - PMC - PubMed
    1. In GK, Poorman K, Saul M, O'Day S, Farma JM, Olszanski AJ, et al. . Molecular profiling of melanoma brain metastases compared to primary cutaneous melanoma and to extracranial metastases. Oncotarget 2020;11:3118–28. - PMC - PubMed

Publication types

Substances