. 2023 Jan 15:228:109787.
doi: 10.1016/j.buildenv.2022.109787. Epub 2022 Nov 12.

Investigation on the effectiveness of ventilation dilution on mitigating COVID-19 patients' secondary airway damage due to exposure to disinfectants

Affiliations

Investigation on the effectiveness of ventilation dilution on mitigating COVID-19 patients' secondary airway damage due to exposure to disinfectants

Yifan Li et al. Build Environ. .

Abstract

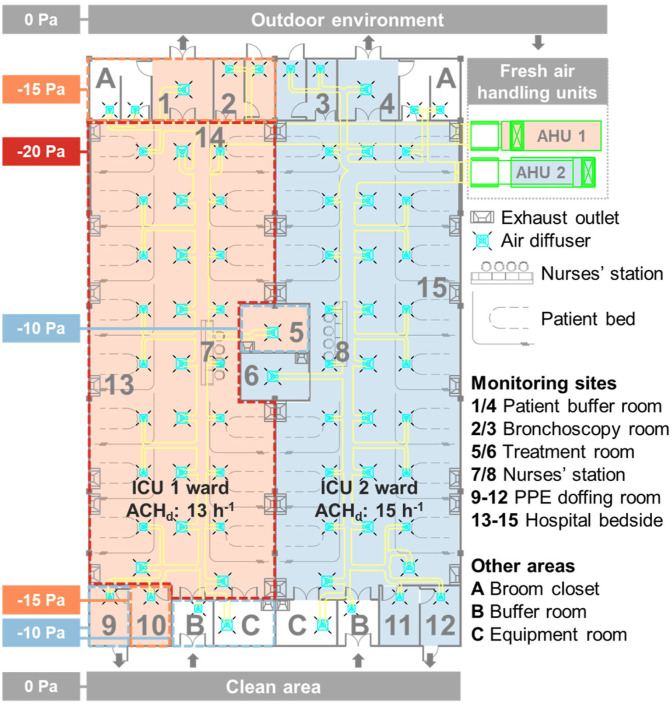
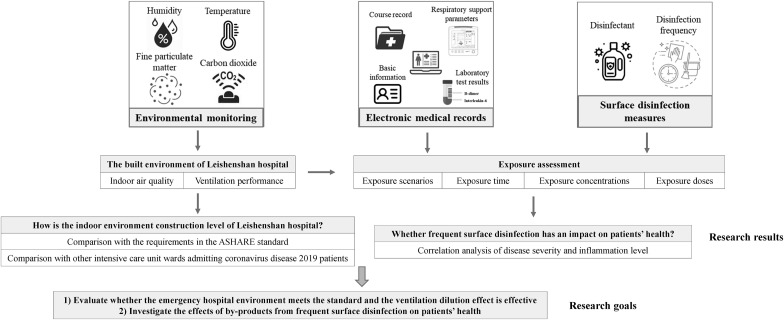
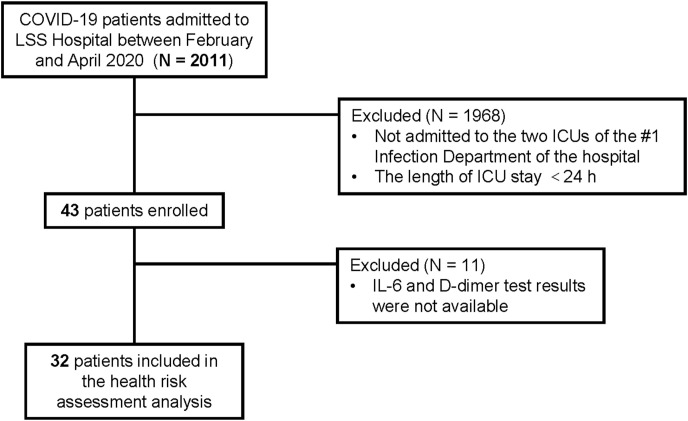
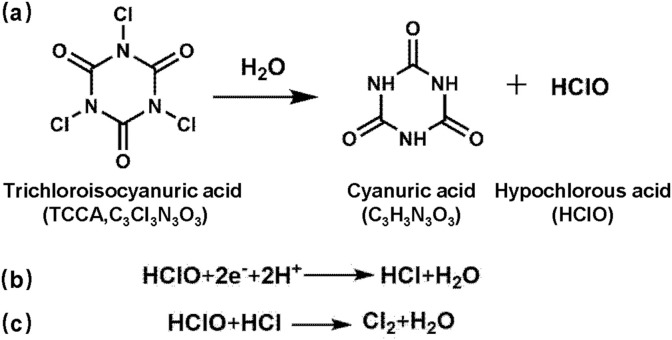
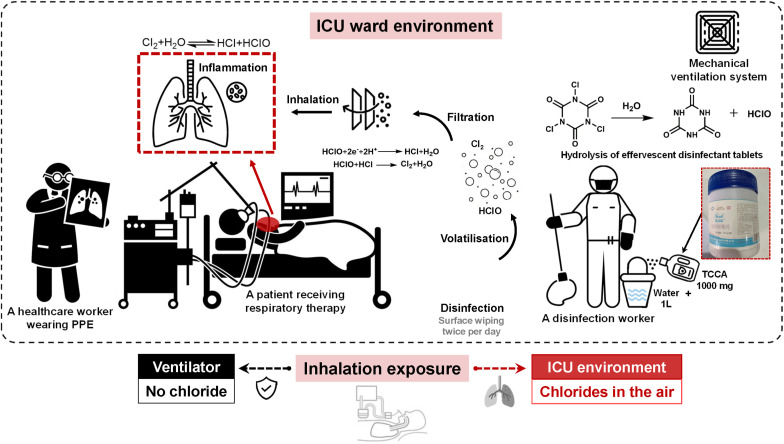
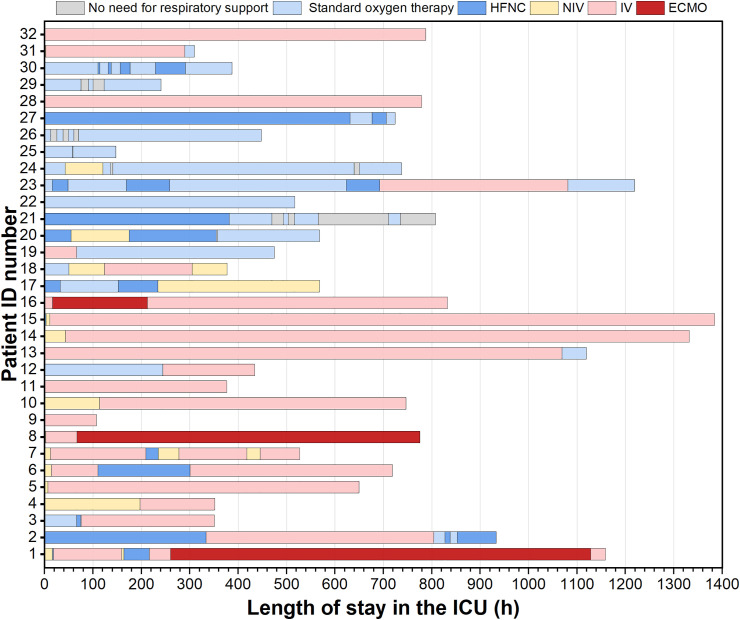
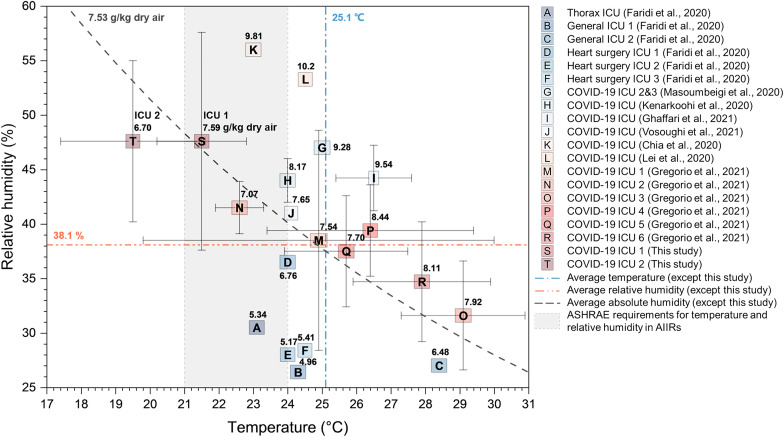
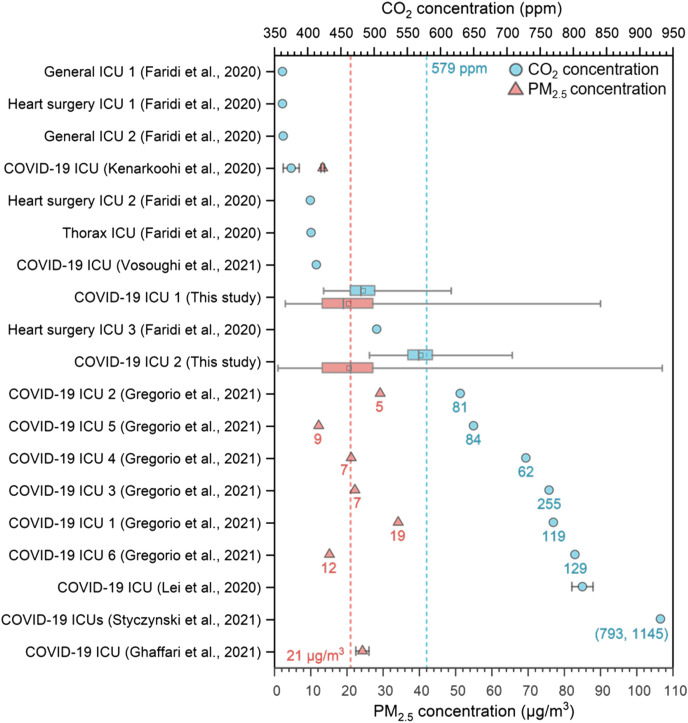
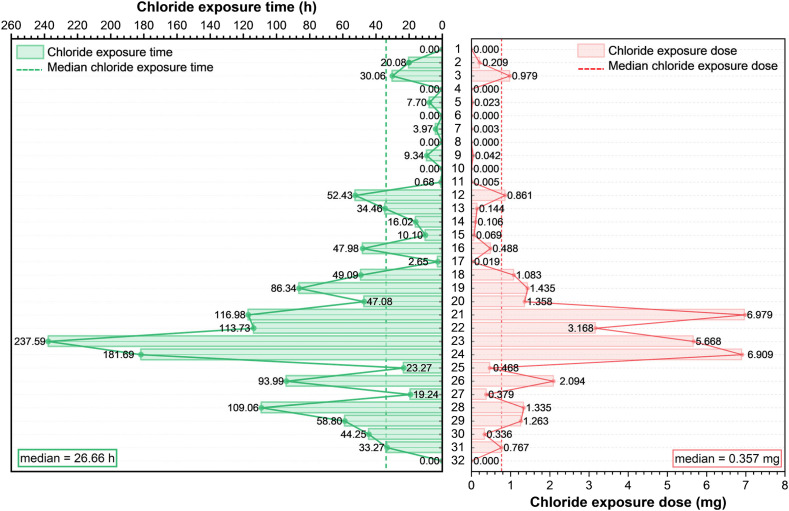
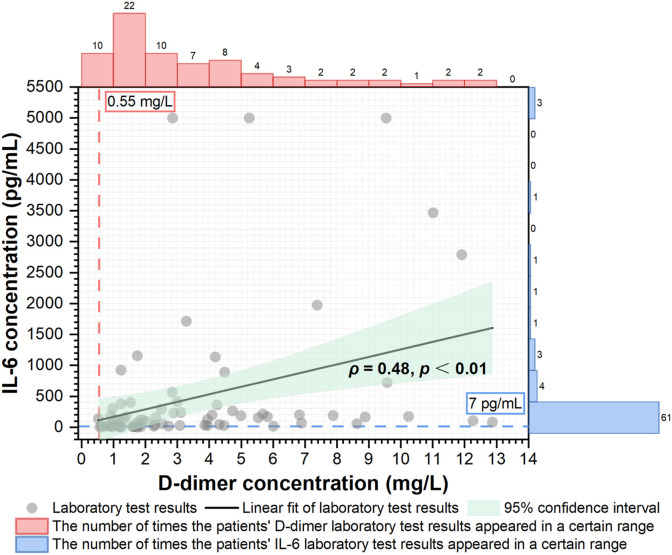
Chlorine-containing disinfectants are widely used in hospitals to prevent hospital-acquired severe acute respiratory syndrome coronavirus 2 infection. Meanwhile, ventilation is a simple but effective means to maintain clean air. It is essential to explore the exposure level and health effects of coronavirus disease 2019 patients' inhalation exposure to by-products of chloride-containing disinfectants under frequent surface disinfection and understand the role of ventilation in mitigating subsequent airway damage. We determined ventilation dilution performance and indoor air quality of two intensive care unit wards of the largest temporary hospital constructed in China, Leishenshan Hospital. The chloride inhalation exposure levels, and health risks indicated by interleukin-6 and D-dimer test results of 32 patients were analysed. The mean ± standard deviation values of the outdoor air change rate in the two intensive care unit wards were 8.8 ± 1.5 h-1 (Intensive care unit 1) and 4.1 ± 1.4 h-1 (Intensive care unit 2). The median carbon dioxide and fine particulate matter concentrations were 480 ppm and 19 μg/m3 for intensive care unit 1, and 567 ppm and 21 μg/m3 for intensive care unit 2, all of which were around the average levels of those in permanent hospitals (579 ppm and 21 μg/m3). Of these patients, the median (lower quartile, upper quartile) chloride exposure time and calculated dose were 26.66 (2.89, 57.21) h and 0.357 (0.008, 1.317) mg, respectively. A statistically significant positive correlation was observed between interleukin-6 and D-dimer concentrations. To conclude, ventilation helped maintain ward air cleanliness and health risks were not observed.

Keywords: COIVD-19; Chlorine-containing disinfectants; ICUs; Inhalation exposure.


Conflict of interest statement

The authors declare that they have no known competing financial interests or personal relationships that could have appeared to influence the work reported in this paper.

Figures

Fig. 1
Fig. 1
Outdoor air mechanical ventilation system and indoor environmental monitoring sites in the intensive care units of Leishenshan Hospital. AHU, air handling unit; PPE, personal protective equipment; ACHd, designed outdoor air change rate. Intensive care unit (ICU) 1 and 2 in Leishenshan Hospital were mirror-symmetric in terms of spatial arrangement. The ICUs were under negative pressure control, and the pressure of each of the different spatial areas in the two ICUs are marked on the left side in the figure. Sites that underwent environmental monitoring are marked with numbers, and other areas are marked with capital letters. The cyan squares denote the air diffusers, and the yellow lines denote the tubes that connected the air diffusers to fresh AHUs. The grey squares denote the exhaust outlets, but the exhaust tubes are not depicted. The grey arrows show how the ICU wards are connected to the indoor clean area and to the outdoor environment. The AHUs extracted fresh air from the outdoor environment and diffused it into the wards. Patients could leave the ICU wards through patient buffer rooms to the outdoor environment. Healthcare workers were required to enter the ICU wards through buffer rooms and exit through PPE doffing rooms. Each ICU ward (ICU 1 and ICU 2, each with an area of 290 m2 and a height of 2.6 m) had 14 patient beds with a nurses' station and had at least two environmental monitoring devices, including devices set at the nurses' stations (monitoring site No. 7 and 8) and by the patients' bedsides (monitoring site No. 13–15). As marked, the ACHd values of ICUs 1 and 2 were 13 h−1 and 15 h−1 (Table S1), respectively. (For interpretation of the references to colour in this figure legend, the reader is referred to the Web version of this article.)
Fig. 2
Fig. 2
Research framework of the study.
Fig. 3
Fig. 3
Flowchart of patient inclusion. COVID-19, coronavirus disease 2019; LSS, Leishenshan; ICUs, intensive care units; IL-6, interleukin-6. Patients who were hospitalised in the two ICUs of the #1 Infection Department of LSS Hospital for more than 24 h between 13 February and 14 April 2020 and whose laboratory test results were available (N = 32) were included in our study. We obtained the epidemiological and clinical characteristics of the patients from their electronic medical records. We then analysed the association between patients' concentrations of the inflammatory marker, IL-6, and the COVID-19 severity indicator, D-dimer, to assess the health risks posed by chloride inhalation exposure as a result of frequent ward disinfection.
Fig. 4
Fig. 4
Reaction of trichloroisocyanuric acid tablets dissolved in water [29]. (a) Trichloroisocyanuric acid (TCCA) reacts with water and produces cyanuric acid and hypochlorous acid (HClO). (b) HClO decomposes into hydrochloric acid (HCl) and water (H2O) after obtaining electrons. (c) HClO reacts with HCl to produce chlorine gas (Cl2). The active disinfection ingredient of TCCA effervescent tablet is HClO.
Fig. 5
Fig. 5
Schematic of inhalation exposure to by-products of a 1000 mg/L chlorine-containing disinfectant in Leishenshan Hospital. ICU, intensive care unit; Cl2, chlorine gas; H2O, water; HCl, hydrochloric acid; HClO, hypochlorous acid; TCCA, trichloroisocyanuric acid; PPE, personal protective equipment. Patients who were hospitalised in the ICUs of the #1 Infection Department of LSS Hospital for more than 24 h between 13 February and 14 April 2020 and whose laboratory test results were available (N = 32) were included in our study. The frequency of surface disinfection was twice per day. The surface disinfectant was prepared by dissolving two effervescent TCCA tablets in water. TCCA reacts with water to produce cyanuric acid and HClO, which further form HCl and Cl2. The chlorides thus generated can remain in ICU ward air for some time after surface disinfection. The chloride removal time, which is also the duration of the patients' exposure to chlorides, depends on the performance of the ventilation system. In the ICUs, patients either breathed spontaneously or received respiratory support. Each ventilator was equipped with a filter, and we assumed that the filter was able to block chlorides. The drawing materials used in this figure come from the following six websites: https://www.iconfinder.com, https://it.dreamstime.com, https://www.flaticon.es, https://iconscout.com, https://www.alamy.com, https://www.onlinewebfonts.com.
Fig. 6
Fig. 6
Patients' length of stay in the intensive care units and the type and duration of respiratory support received. HFNC, high-flow nasal cannula oxygen therapy; NIV, non-invasive ventilation; IV, invasive ventilation (including tracheotomy and tracheal intubation); ECMO, extracorporeal membrane oxygenation; ID, identification; ICU, intensive care unit. The grey bar indicates spontaneous breathing, not relying on standard oxygen therapy. The light blue, dark blue, yellow, pink, and red bars indicate standard oxygen therapy, NIV, IV, and ECMO, respectively. Chronological order is considered in this figure. We obtained data on the type and duration of respiratory support from the electronic medical records (EMRs). The patient ID numbers are based on the case numbers of the patients' EMRs. (For interpretation of the references to colour in this figure legend, the reader is referred to the Web version of this article.)
Fig. 7
Fig. 7
Temperature and relative humidity in intensive care unit wards admitting coronavirus disease 2019 patients. ICU, intensive care unit; ASHRAE, American Society of Heating, Refrigerating and Air-Conditioning Engineers; AIIR, airborne infection isolation room. Except for this study, the temperature and relative humidity (RH) data points depicted were collected from ICU wards admitting coronavirus disease 2019 (COVID-19) patients in permanent hospitals worldwide (Table S6) [8,23,31,[36], [37], [38], [39], [40], [41]].The average temperature and RH in these permanent ICU wards were 25.1 °C and 38.1%, represented by the blue dash–dot line and the pink dash–double dot line, respectively. Most of the included studies presented the temperature and RH data as the mean ± standard deviation and thus, our results are also presented in this format. The air moisture (g/kg dry air), or absolute humidity, was calculated and is labelled next to each corresponding data point. The average absolute humidity in the permanent ICU wards was 7.53 g/kg dry air, as represented by the grey dashed line. The grey area represents the general requirements of indoor air quality (IAQ) listed in Table 7.1 of Design Parameters — Inpatient Spaces of the American National Standards Institute, the American Society of Heating, Refrigerating and Air-Conditioning Engineers and the American Society for Health Care Engineering's joint Standard 170–2021 Ventilation of Health Care Facilities [35].Specifically, according to the standard, in an AIIR, the temperature should be in the range of 21–24 °C and the RH should be ≤ 60%. Masoumbeigi et al. (2020) [39] measured the IAQ in two ward areas of ICU 2 and four isolation rooms of ICU 3 in a military referral hospital in Iran and obtained the same result; therefore, only one data point is depicted here. Ghaffari t al. (2021) [37] presented four groups of IAQ data collected from the same ICU ward, and thus, the data were averaged before inclusion in this figure. (For interpretation of the references to colour in this figure legend, the reader is referred to the Web version of this article.)
Fig. 8
Fig. 8
Carbon dioxide and fine particulate matter concentrations in intensive care unit wards admitting coronavirus disease 2019 patients. CO2, carbon dioxide; PM2.5, fine particulate matter. Our data are presented as boxplots, with the whiskers representing minimum and maximum values, the box representing the range from the lower to upper quartiles, and the square symbol and the line in the box representing the mean and median values, respectively. Except for this study, the CO2 and PM2.5 concentration data were collected from ICU wards admitting coronavirus disease 2019 (COVID-19) patients in permanent hospitals worldwide (Table S6) [23,31,[36], [37], [38],40,41]. The average CO2 and PM2.5 concentrations in these permanent ICU wards were 579 ppm (ppm = 10−6 mol/mol) and 21 μg/m3, represented by blue and red dashed lines, respectively. Gregorio et al. (2021) [31] presented the CO2 and PM2.5 data as median values (interquartile ranges), and thus, the interquartile range is labelled below each corresponding median point. Styczynski et al. (2022) [40]collected CO2 data from the ICU wards of six public and three private hospitals and presented the CO2 data as the median (lower quartile, upper quartile); therefore, the lower and upper quartiles are marked below the median point. Ghaffari et al. (2021) [37] listed four groups of PM2.5 data collected from the same ICU ward, and thus, the data were averaged before inclusion in this figure. (For interpretation of the references to colour in this figure legend, the reader is referred to the Web version of this article.)
Fig. 9
Fig. 9
Patients' inhalation exposure to chlorides in the intensive care units of Leishenshan Hospital. Based on the patients' respiratory support information and ventilation performance in the intensive care units, the duration of exposure to chlorides was estimated using Equation (2). Subsequently, we calculated the mass of available chlorine inhaled by patients during their hospital stay using Equation (4). The red bars represent the mass of available chlorine inhaled by each patient, and the green bars represent the chloride exposure time. The red and green lines with dot symbols indicate the difference in the chloride exposure doses and chloride exposure times between patients, respectively. The red and green dashed lines represent the median chloride exposure doses and chloride exposure times, respectively. \The numbers from 1 to 32 marked on the vertical axis are the patient ID numbers, which were derived from the case numbers of the patient's electronic medical records. (For interpretation of the references to colour in this figure legend, the reader is referred to the Web version of this article.)
Fig. 10
Fig. 10
Spearman's correlation between the concentrations of interleukin-6 and D-dimer in intensive care unit patients at Leishenshan Hospital during their hospitalisation. The grey dots indicate the interleukin-6 (IL-6) and D-dimer laboratory test results obtained on the same day. We used Spearman's correlation coefficients to assess the association between the concentrations of the inflammatory marker, IL-6, and the coronavirus disease 2019 severity indicator, D-dimer. A moderately positive correlation was detected (ρ = 0.48; p < 0.01). The red and blue dashed lines indicate the normal ranges of IL-6 (0–7 pg/mL) and D-dimer (0–0.55 mg/L) concentrations. The red and blue histograms represent the distribution of patients' laboratory test results for D-dimer and IL-6, respectively. The x-axis and y-axis are divided into 14 and 11 intervals with interval sizes of 1 mg/L and 500 pg/mL, respectively. The number of data points in each interval is marked at the top of the corresponding bar. (For interpretation of the references to colour in this figure legend, the reader is referred to the Web version of this article.)

Similar articles

References

    1. World Health Organization . 2022. WHO Coronavirus Disease (COVID-9) Dashboard.https://covid19.who.int/
    1. Gholami M., Fawad I., Shadan S., et al. COVID-19 and healthcare workers: a systematic review and meta-analysis. Int. J. Infect. Dis. 2021;104:335–346. doi: 10.1016/j.ijid.2021.01.013. - DOI - PMC - PubMed
    1. World Health Organization Modes of transmission of virus causing COVID-19: implications for IPC precaution recommendations. 2020. https://www.who.int/news-room/commentaries/detail/modes-of-transmission-...
    1. Ng K., Poon B.H., Kiat Puar T.H., et al. COVID-19 and the risk to health care workers: a case report. Ann. Intern. Med. 2020;172(11):766–767. doi: 10.7326/L20-0175. - DOI - PMC - PubMed
    1. Wee L.E., Conceicao E.P., Sim X.Y.J., et al. Minimizing intra-hospital transmission of COVID-19: the role of social distancing. J. Hosp. Infect. 2020;105(2):113–115. doi: 10.1016/j.jhin.2020.04.016. - DOI - PMC - PubMed

LinkOut - more resources