

Demographic history and gene flow in the peatmosses Sphagnum recurvum and Sphagnum flexuosum (Bryophyta: Sphagnaceae)
- PMID: 36407896
- PMCID: PMC9667404
- DOI: 10.1002/ece3.9489
Demographic history and gene flow in the peatmosses Sphagnum recurvum and Sphagnum flexuosum (Bryophyta: Sphagnaceae)
Abstract
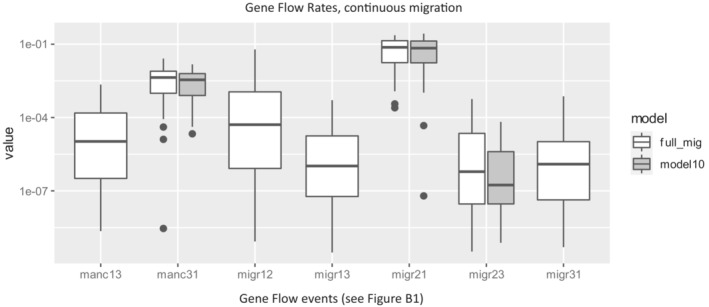
Population size changes and gene flow are processes that can have significant impacts on evolution. The aim of this study was to investigate the relationship of geography to patterns of gene flow and population size changes in a pair of closely related Sphagnum (peatmoss) species: S. recurvum and S. flexuosum. Both species occur in eastern North America, and S. flexuosum also occurs in Europe. Genetic data from restriction-site-associated DNA sequencing (RAD-seq) were used in this study. Analyses of gene flow were accomplished using coalescent simulations of site frequency spectra (SFSs). Signatures of gene flow were confirmed by f 4 statistics. For S. flexuosum, genetic diversity of plants in glaciated areas appeared to be lower than that in unglaciated areas, suggesting that glaciation can have an impact on effective population sizes. There is asymmetric gene flow from eastern North America to Europe, suggesting that Europe might have been colonized by plants from eastern North America after the last glacial maximum. The rate of gene flow between S. flexuosum and S. recurvum is lower than that between geographically disjunct S. flexuosum populations. The rate of gene flow between species is higher among sympatric plants of the two species than between currently allopatric S. flexuosum populations. There was also gene flow from S. recurvum to the ancestor S. flexuosum on both continents which occurred through secondary contact. These results illustrate a complex history of interspecific gene flow between S. flexuosum and S. recurvum, which occurred in at least two phases: between ancestral populations after secondary contact and between currently sympatric plants.
Keywords: demographic history; effective population size; gene flow; genetic diversity; glaciation; sphagnum.
© 2022 The Authors. Ecology and Evolution published by John Wiley & Sons Ltd.
Figures


Similar articles
-
Phylogenetic structure in the Sphagnum recurvum complex (Bryophyta) in relation to taxonomy and geography.Am J Bot. 2020 Sep;107(9):1283-1295. doi: 10.1002/ajb2.1525. Epub 2020 Sep 15. Am J Bot. 2020. PMID: 32930404
-
Parallel patterns of genetic diversity and structure in circumboreal species of the Sphagnum capillifolium complex.Am J Bot. 2024 May;111(5):e16348. doi: 10.1002/ajb2.16348. Epub 2024 May 19. Am J Bot. 2024. PMID: 38764292
-
Clonality, local population structure and gametophyte sex ratios in cryptic species of the Sphagnum magellanicum complex.Ann Bot. 2023 Oct 4;132(1):77-94. doi: 10.1093/aob/mcad077. Ann Bot. 2023. PMID: 37417448 Free PMC article.
-
A phylogenetic delimitation of the "Sphagnum subsecundum complex" (Sphagnaceae, Bryophyta).Am J Bot. 2008 Jun;95(6):731-44. doi: 10.3732/ajb.0800048. Am J Bot. 2008. PMID: 21632399
-
The evolutionary history of the Arabidopsis lyrata complex: a hybrid in the amphi-Beringian area closes a large distribution gap and builds up a genetic barrier.BMC Evol Biol. 2010 Apr 8;10:98. doi: 10.1186/1471-2148-10-98. BMC Evol Biol. 2010. PMID: 20377907 Free PMC article.
References
-
- Abbott, R. , Albach, D. , Ansell, S. , Arntzen, J. W. , Baird, S. J. E. , Bierne, N. , Boughman, J. , Brelsford, A. , Buerkle, C. A. , Buggs, R. , Butlin, R. K. , Dieckmann, U. , Eroukhmanoff, F. , Grill, A. , Cahan, S. H. , Hermansen, J. S. , Hewitt, G. , Hudson, A. G. , Jiggins, C. , … Zinner, D. (2013). Hybridization and speciation. Journal of Evolutionary Biology, 26(2), 229–246. 10.1111/j.1420-9101.2012.02599.x - DOI - PubMed
-
- Adams, J. M. , & Woodward, F. I. (1989). Patterns in tree species richness as a test of the glacial extinction hypothesis. Nature, 339(6227), 699–701. 10.1038/339699a0 - DOI
-
- Beichman, A. C. , Huerta‐Sanchez, E. , & Lohmueller, K. E. (2018). Using genomic data to infer historic population dynamics of nonmodel organisms. Annual Review of Ecology, Evolution, and Systematics, 49(1), 433–456. 10.1146/annurev-ecolsys-110617-062431 - DOI
Associated data
LinkOut - more resources
Full Text Sources
