. 2022 Dec;16(6):1427-1447.
doi: 10.1007/s11571-022-09797-z. Epub 2022 Mar 24.

Disynaptic effect of hilar cells on pattern separation in a spiking neural network of hippocampal dentate gyrus

Affiliations

Disynaptic effect of hilar cells on pattern separation in a spiking neural network of hippocampal dentate gyrus

Sang-Yoon Kim et al. Cogn Neurodyn. 2022 Dec.

Abstract

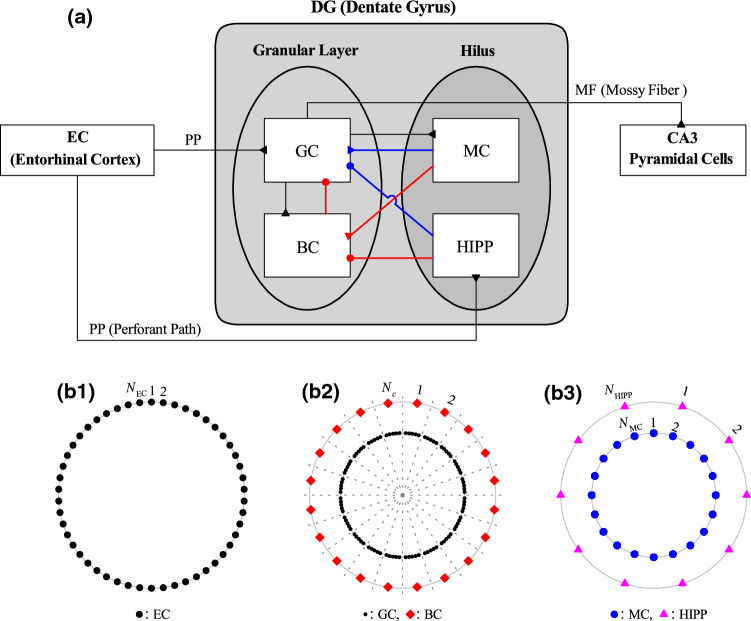
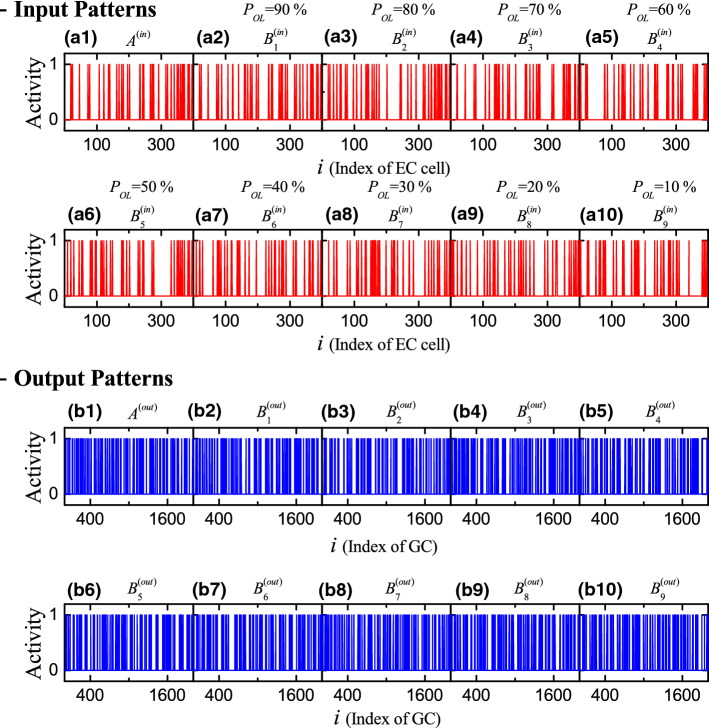
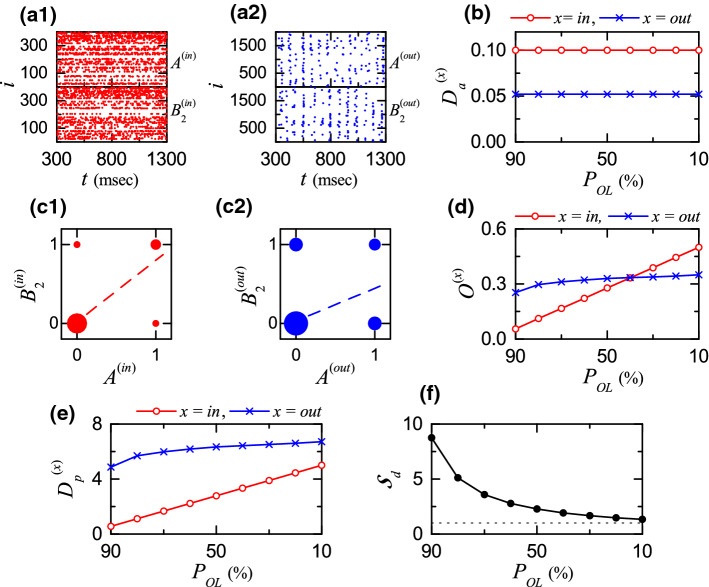
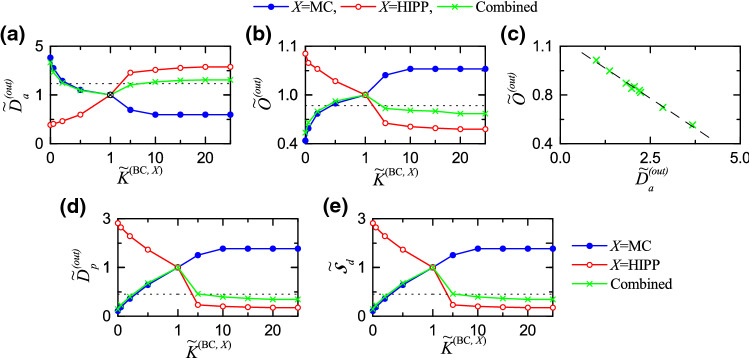
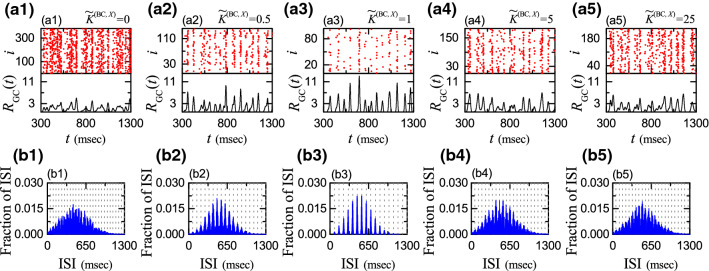
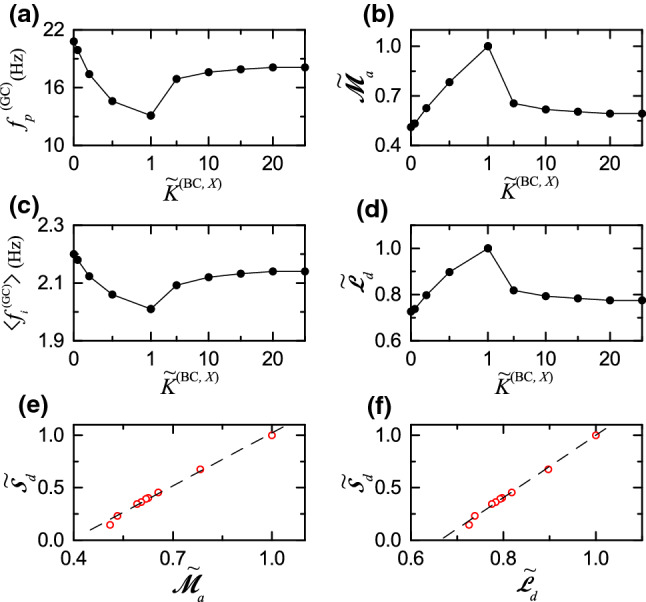
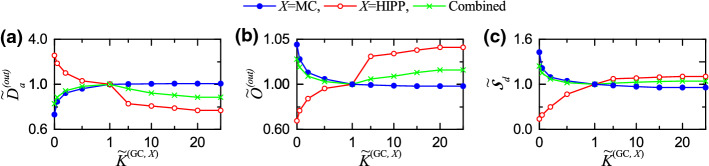
We study the disynaptic effect of the hilar cells on pattern separation in a spiking neural network of the hippocampal dentate gyrus (DG). The principal granule cells (GCs) in the DG perform pattern separation, transforming similar input patterns into less-similar output patterns. In our DG network, the hilus consists of excitatory mossy cells (MCs) and inhibitory HIPP (hilar perforant path-associated) cells. Here, we consider the disynaptic effects of the MCs and the HIPP cells on the GCs, mediated by the inhibitory basket cells (BCs) in the granular layer; MC BC GC and HIPP BC GC. The MCs provide disynaptic inhibitory input (mediated by the intermediate BCs) to the GCs, which decreases the firing activity of the GCs. On the other hand, the HIPP cells disinhibit the intermediate BCs, which leads to increasing the firing activity of the GCs. In this way, the disynaptic effects of the MCs and the HIPP cells are opposite. We investigate change in the pattern separation efficacy by varying the synaptic strength K ( BC , X ) [from the pre-synaptic X (= MC or HIPP) to the post-synaptic BC]. Thus, sparsity for the firing activity of the GCs is found to improve the efficacy of pattern separation, and hence the disynaptic effects of the MCs and the HIPP cells on the pattern separation become opposite ones. In the combined case when simultaneously changing both K ( BC , MC ) and K ( BC , HIPP ) , as a result of balance between the two competing disynaptic effects of the MCs and the HIPP cells, the efficacy of pattern separation is found to become the highest at their original default values where the activation degree of the GCs is the lowest. We also note that, while the GCs perform pattern separation, sparsely synchronized rhythm is found to appear in the population of the GCs. Hence, we examine quantitative association between population and individual firing behaviors in the sparsely synchronized rhythm and pattern separation. They are found to be strongly correlated. Consequently, the better the population and individual firing behaviors in the sparsely synchronized rhythm are, the more pattern separation efficacy becomes enhanced.

Keywords: Disynaptic effect; Granule cells; HIPP cells; Hippocampal dentate gyrus; Mossy cells; Pattern separation; Sparsely synchronized rhythm.


Figures

Fig. 1
Fig. 1
Hippocampal dentate gyrus (DG) network. a Box diagram for the hippocampal dentate gyrus (DG) network. Lines with triangles and circles denote excitatory and inhibitory synapses, respectively. In the DG, there are the granular layer [consisting of GC (granule cell) and BC (basket cell)] and the hilus [composed of MC (mossy cell) and HIPP (hilar perforant path-associated) cell]. The DG receives excitatory input from the EC (entorhinal cortex) via PPs (perforant paths) and provides its output to the CA3 via MFs (mossy fibers). Red and blue lines represent disynaptic and monosynaptic connections into GCs, respectively. Three kinds of ring networks in (b1)-(b3). (b1) Schematic diagram for the EC ring network, composed of NEC EC cells (black circles). (b2) Schematic diagram for the granular-layer ring network with concentric inner GC and outer BC rings. Numbers represent GC clusters (bounded by dotted lines). Each GC cluster (I=1,,Nc) consists of nGC(c) GCs (black circles) and one BC (red diamonds). (b3) Schematic diagram for the hilar ring network with concentric inner MC and outer HIPP rings, consisting of NMC MCs (blue circles) and NHIPP HIPP cells (purple triangles), respectively
Fig. 2
Fig. 2
Binary-representation plots of spiking activity for (a1)–(a10) the input and (b1)–(b10) the output patterns for 9 values of overlap percentage POL
Fig. 3
Fig. 3
Characterization of pattern separation between the input and the output patterns. a1 Raster plots of spikes of ECs for the input patterns A(in) and B2(in) in the case of overlap percentage POL=80%. a2 Raster plots of spikes of GCs for the output patterns A(out) and B2(out). b Plots of average activation degree Da(x) versus POL for the input (x=in; open circle) and the output (x=out, cross) patterns. Plots of the diagonal elements (0, 0) and (1, 1) and the anti-diagonal elements (1, 0) and (0, 1) for the spiking activity (1: active; 0: silent) in the pair of (c1) input (x=in) and (c2) output (x=out) patterns A(x) and B2(x) for POL=80%; sizes of solid circles, located at (0,0), (1,1), (1,0), and (0,1), are given by the integer obtained by rounding off the number of 5log10(np) (np: number of data at each location), and a dashed linear least-squares fitted line is also given. d Plots of average orthogonalization degree O(x) versus POL in the case of the input (x=in; open circle) and the output (x=out, cross) patterns. e Plots of the pattern distance Dp(x) versus POL for the input (x=in; open circle) and the output (x=out, cross) patterns. g Plots of pattern separation degrees Sd versus POL
Fig. 4
Fig. 4
Disynaptic effect of the MCs and the HIPP cells on pattern separation. Plots of (a) the normalized average activation degree D~a(out) and (b) the normalized average orthogonalization degree O~(out) versus the normalized synaptic strength K~(BC,X) (X= MC or HIPP) for the output patterns. (c) Plot of O~(out) versus D~a(out) in the combined case (green crosses); a dashed fitted line is given. Plots of (d) the normalized pattern distance D~p(out) and (e) the normalized pattern separation degree S~d versus K~(BC,X). In (a)–(e), blue solid circles, red open circles, and green crosses represent the individual cases of the MCs and the HIPP cells and the combined case, respectively. For clear presentation in (a), (b), (d), and (e), we choose four different scales around (1, 1); (left, right) and (up, down). The horizontal dotted lines in (a), (b), and (d) represent D~a(in) (normalized average activation degree), O~(in) (normalized orthogonalization degree), and D~p(in) (normalized pattern distance) for the input patterns, respectively. The horizontal dotted line in (e) denotes a threshold value of S~d0.451 (corresponding to Sd=1)
Fig. 5
Fig. 5
Sparsely synchronized rhythms of the active GCs and Multi-peaked ISI histograms. a1a5 Raster plots of spikes and IPSRs RGC(t) for the active GCs for K~(BC,X) (X= MC or HIPP) = 0, 0.5, 1.0, 5.0 and 25, respectively. (b1)-(b5) Population-averaged ISI histograms for K~(BC,X) (X= MC or HIPP) = 0, 0.5, 1.0, 5.0 and 25, respectively; bin size = 2 msec. Vertical dotted lines in (b1)–(b5) represent the integer multiples of the global period TG(GC) of RGC(t); TG(GC)= 48.1, 68.5, 76.4, 59.2, and 55.2 msec for K~(BC,X) (X= MC or HIPP) = 0, 0.5, 1.0, 5.0 and 25, respectively
Fig. 6
Fig. 6
Quantitative relationship between sparsely synchronized rhythm of the GCs and pattern separation in the combined case of simultaneously changing the normalized synaptic strengths K~(BC,MC) and K~(BC,HIPP). a Plot of the population frequency fp(GC) of sparsely synchronized rhythm of the GCs versus K~(BC,X) (X= MC or HIPP). b Plot of the normalized amplitude measure, M~a versus K~(BC,X). c Plot of the population-averaged mean firing rate fi versus K~(BC,X). d Plot of the normalized random-spike-skipping degree L~d versus K~(BC,X). (e) Plot of the normalized pattern separation degree S~d versus M~a. f Plot of the normalized pattern separation degree S~d versus L~d. Dashed fitted lines are given in (ef)
Fig. 7
Fig. 7
Monosynaptic effect of the MCs and the HIPP cells on pattern separation. Plots of a the normalized average activation degree D~a(out), d b the normalized average orthogonalization degree O~(out), and c the normalized pattern separation degree S~d versus the normalized synaptic strength K~(GC,X) (X= MC or HIPP) for the output patterns. In a, b and c, solid circles, open circles, and crosses represent the cases of the MCs and the HIPP cells and the combined case, respectively. For clear presentation, we choose four different scales around (1, 1); (left, right) and (up, down)

Similar articles

Cited by

References

    1. Almeida LD, Idiart M, Lisman JE. A second function of gamma frequency oscillations: An E%-max winner-take-all mechanism selects which cells fire. J Neurosci. 2009;29:7497–7503. - PMC - PubMed
    1. Amaral DG, Witter MP. The three-dimensional organization of the hippocampal formation: A review of anatomical data. Neuroscience. 1989;31:571–591. - PubMed
    1. Amaral DG, Ishizuka N, Claiborne B. Neurons, numbers and the hippocampal network. Prog Brain Res. 1990;83:1–11. - PubMed
    1. Amaral DG, Scharfman HE, Lavenex P. The dentate gyrus: fundamental neuroanatomical organization (dentate gyrus for dummies) Prog Brain Res. 2007;163:3–22. - PMC - PubMed
    1. Andersen P, Bliss TVP, Skrede KK. Lamellar organization of hippocampal excitatory pathways. Exp Brain Res. 1971;13:222–238. - PubMed

LinkOut - more resources