. 2022 Nov 3:14:1018071.
doi: 10.3389/fnagi.2022.1018071. eCollection 2022.

Moderating effect of cognitive reserve on brain integrity and cognitive performance

Affiliations

Moderating effect of cognitive reserve on brain integrity and cognitive performance

Monica E Nelson et al. Front Aging Neurosci. .

Abstract

Background: Dementia syndrome is one of the most devastating conditions in older adults. As treatments to stop neurodegeneration become available, accurate and timely diagnosis will increase in importance. One issue is that cognitive performance sometimes does not match the corresponding level of neuropathology, affecting diagnostic accuracy. Cognitive reserve (CR), which can preserve cognitive function despite underlying neuropathology, explains at least some variability in cognitive performance. We examined the influence of CR proxies (education and occupational position) on the relationship between hippocampal or total gray matter volume and cognition.

Methods: We used data from the Czech Brain Aging Study. Participants were clinically confirmed to be without dementia (n = 457, including subjective cognitive decline and amnestic mild cognitive impairment) or with dementia syndrome (n = 113).

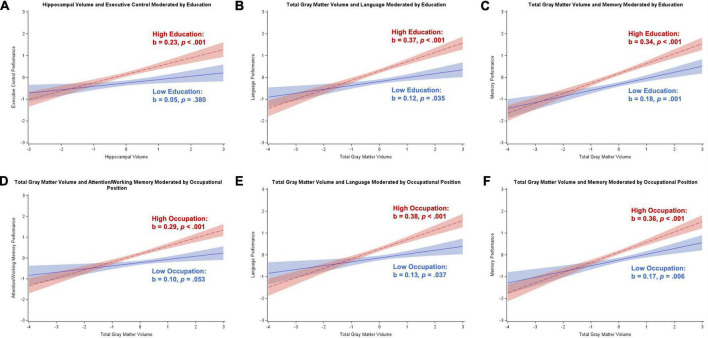
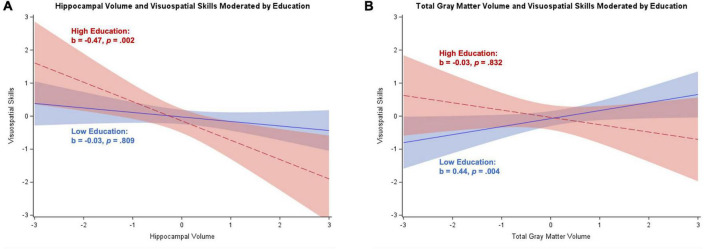
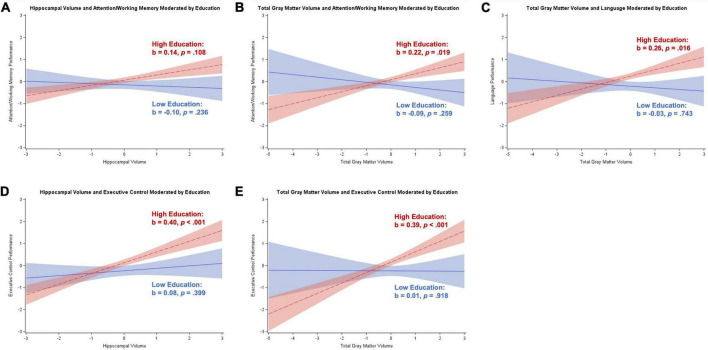
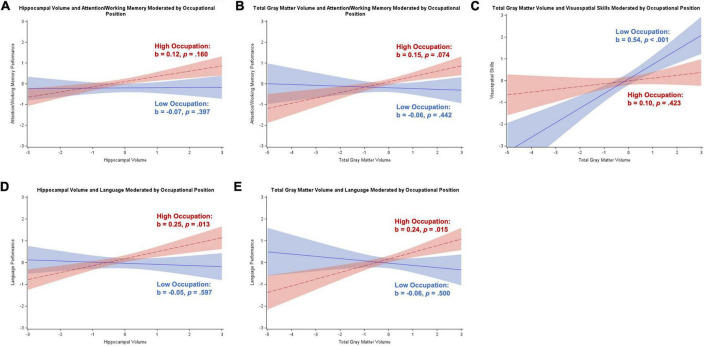
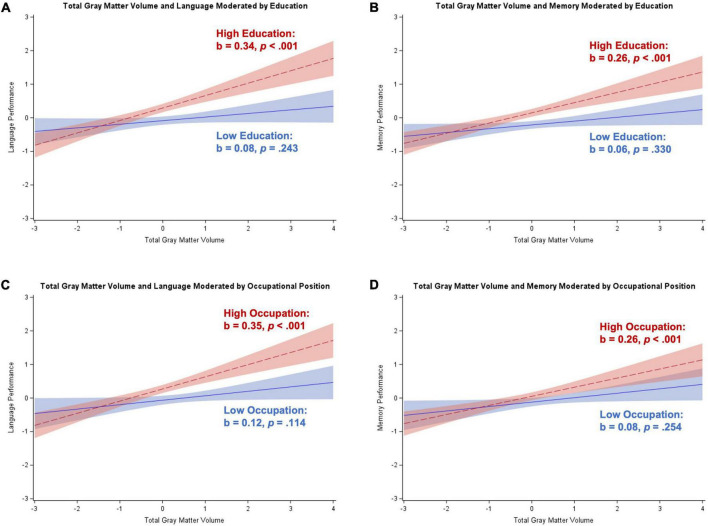
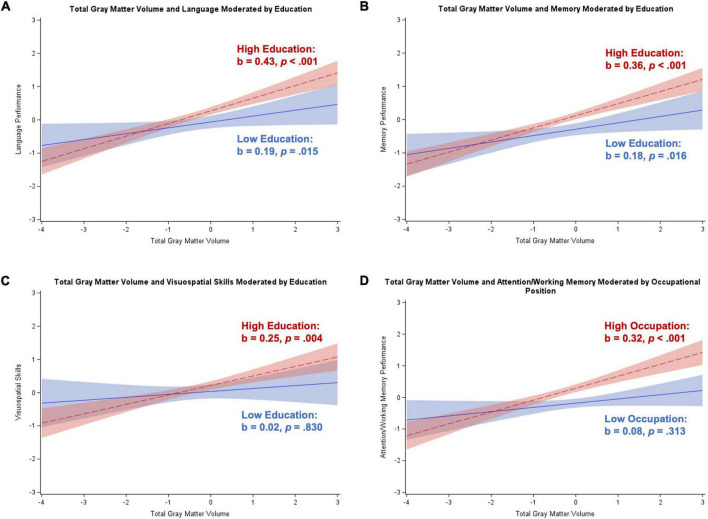
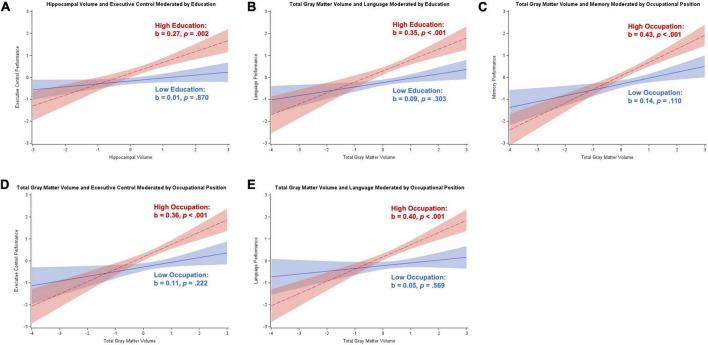
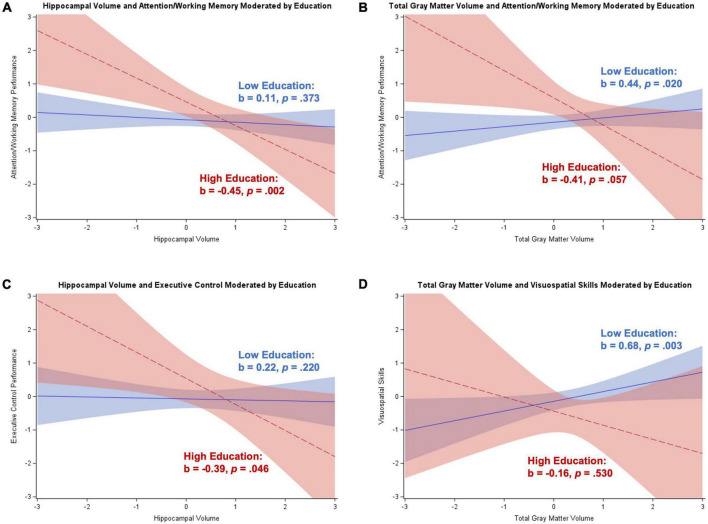
Results: For participants without dementia, higher education magnified the associations between (a) hippocampal volume and executive control (b = 0.09, p = 0.033), (b) total gray matter volume and language (b = 0.12, p < 0.001), and (c) total gray matter volume and memory (b = 0.08, p = 0.018). Similarly, higher occupational position magnified the association between total gray matter volume and (a) attention/working memory (b = 0.09, p = 0.009), (b) language (b = 0.13, p = 0.002), and (c) memory (b = 0.10, p = 0.013). For participants with dementia, the associations between hippocampal (b = -0.26, p = 0.024) and total gray matter (b = -0.28, p = 0.024) volume and visuospatial skills decreased in magnitude with higher education.

Conclusion: We found that the association between brain volume and cognitive performance varies based on CR, with greater CR related to a stronger link between brain volume and cognition before, and a weaker link after, dementia diagnosis.

Keywords: MRI; attention/working memory; executive control; language; visuospatial skills.


Conflict of interest statement

The authors declare that the research was conducted in the absence of any commercial or financial relationships that could be construed as a potential conflict of interest.

Figures

FIGURE 1
FIGURE 1
Plots of significant moderations by education and occupational position of the associations between cognition and brain volume in participants without dementia. High education or occupational position corresponds to 1 SD above the mean and low education or occupational position corresponds to 1 SD below the mean. The red dotted line represents high cognitive reserve, and the blue solid line represents low cognitive reserve. Shaded areas represent 95% confidence intervals. Cognition and brain volume were standardized. (A) Significant positive association between hippocampal volume and executive control for individuals with high education; non-significant for low education. (B) Significant positive association between total gray matter volume and language for individuals with low and high education; stronger relationship for high education. (C) Significant positive association between total gray matter volume and memory for individuals with low and high education; stronger relationship for high education. (D) Significant positive association between total gray matter volume and attention/working memory for individuals with high occupational position; non-significant for low occupational position. (E) Significant positive association between total gray matter volume and language for individuals with low and high occupational position; stronger relationship for high occupational position. (F) Significant positive association between total gray matter volume and memory for individuals with low and high occupational position; stronger relationship for high occupational position.
FIGURE 2
FIGURE 2
Plots of significant moderations by education of the associations between brain volume and visuospatial skills for participants with dementia. High education corresponds to 1 SD above the mean and low education corresponds to 1 SD below the mean. The red dotted line represents high education, and the blue solid line represents low education. Shaded areas represent 95% confidence intervals. Visuospatial skills and brain volume were standardized. (A) Significant negative relationship between hippocampal volume and visuospatial skills for individuals with high education; non-significant for low education. (B) Significant positive association between total gray matter volume and visuospatial skills for participants with low education; non-significant negative association for individuals with high education.
FIGURE 3
FIGURE 3
Plots of significant moderations by education of the associations between brain volume and cognition for participants with subjective cognitive decline. High education corresponds to 1 SD above the mean and low education corresponds to 1 SD below the mean. The red dotted line represents high education, and the blue solid line represents low education. Shaded areas represent 95% confidence intervals. Cognition and brain volume were standardized. (A) Non-significant positive association between hippocampal volume and attention/working memory for participants with high education; non-significant negative association for low education. (B) Significant positive association between total gray matter volume and attention/working memory for participants with high education; non-significant negative association for low education. (C) Significant positive association between total gray matter volume and language for participants with high education; non-significant negative association for low education. (D) Significant positive association between hippocampal volume and executive control for participants with high education; non-significant positive association for low education. (E) Significant positive association between total gray matter volume and executive control for participants with high education; non-significant positive association for low education.
FIGURE 4
FIGURE 4
Plots of significant moderations by occupational position of the associations between brain volume and cognition for participants with subjective cognitive decline. High occupational position corresponds to 1 SD above the mean and low occupational position corresponds to 1 SD below the mean. The red dotted line represents high occupational position, and the blue solid line represents low occupational position. Shaded areas represent 95% confidence intervals. Cognition and brain volume were standardized. (A) Non-significant positive association between hippocampal volume and attention/working memory for participants with high occupational position; non-significant negative association for low occupational position. (B) Non-significant positive association between total gray matter volume and attention/working memory for participants with high occupational position; non-significant negative association for low occupational position. (C) Non-significant positive association between total gray matter volume and visuospatial skills for participants with high occupational position; significant positive association for low occupational position. (D) Significant positive association between hippocampal volume and language for participants with high occupational position; non-significant negative association for low occupational position. (E) Significant positive association between total gray matter volume and language for participants with high occupational position; non-significant negative association for low occupational position.
FIGURE 5
FIGURE 5
Plots of significant moderations by education and occupational position of the associations between total gray matter volume and cognition for participants with amnestic mild cognitive impairment. High education or occupational position corresponds to 1 SD above the mean and low education or occupational position corresponds to 1 SD below the mean. The red dotted line represents high education or occupational position, and the blue solid line represents low education or occupational position. Shaded areas represent 95% confidence intervals. Cognition and total gray matter volume were standardized. (A) Significant positive association between total gray matter volume and language for participants with high education; non-significant positive association for low education. (B) Significant positive association between total gray matter volume and memory for participants with high education; non-significant positive association for low education. (C) Significant positive association between total gray matter volume and language for participants with high occupational position; non-significant positive association for low occupational position. (D) Significant positive association between total gray matter volume and memory for participants with high occupational position; non-significant positive association for low occupational position.
FIGURE 6
FIGURE 6
Plots of significant moderations by education and occupational position of the associations between total gray matter volume and cognition for men without dementia. High education or occupational position corresponds to 1 SD above the mean and low education or occupational position corresponds to 1 SD below the mean. The red dotted line represents high education or occupational position, and the blue solid line represents low education or occupational position. Shaded areas represent 95% confidence intervals. Cognition and total gray matter volume were standardized. (A) Significant positive association between total gray matter volume and language for participants with high education; significant positive association for low education. (B) Significant positive association between total gray matter volume and memory for participants with high education; significant positive association for low education. (C) Significant positive association between total gray matter volume and visuospatial skills for participants with high education; non-significant positive association for low education. (D) Significant positive association between total gray matter volume and attention/working memory for participants with high occupational position; non-significant positive association for low occupational position.
FIGURE 7
FIGURE 7
Plots of significant moderations by education and occupational position of the associations between brain volume and cognition for women without dementia. High education or occupational position corresponds to 1 SD above the mean and low education or occupational position corresponds to 1 SD below the mean. The red dotted line represents high education or occupational position, and the blue solid line represents low education or occupational position. Shaded areas represent 95% confidence intervals. Cognition and brain volume were standardized. (A) Significant positive association between hippocampal volume and executive control for participants with high education; non-significant positive association for low education. (B) Significant positive association between total gray matter volume and language for participants with high education; non-significant positive association for low education. (C) Significant positive association between total gray matter volume and memory for participants with high occupational position; non-significant positive association for low occupational position. (D) Significant positive association between total gray matter volume and executive control for participants with high occupational position; non-significant positive association for low occupational position. (E) Significant positive association between total gray matter volume and language for participants with high occupational position; non-significant positive association for low occupational position.
FIGURE 8
FIGURE 8
Plots of significant moderations by education of the associations between brain volume and cognition for women with dementia. High education corresponds to 1 SD above the mean and low education corresponds to 1 SD below the mean. The red dotted line represents high education, and the blue solid line represents low education. Shaded areas represent 95% confidence intervals. Cognition and brain volume were standardized. (A) Significant negative association between hippocampal volume and attention/working memory for participants with high education; non-significant positive association for low education. (B) Non-significant negative association between total gray matter volume and attention/working memory for participants with high education; significant positive association for low education. (C) Significant negative association between hippocampal volume and executive control for participants with high education; non-significant positive association for low education. (D) Non-significant negative association between total gray matter volume and visuospatial skills for participants with high education; significant positive association for low education.

Similar articles

Cited by

References

    1. Albert M. S. (1996). Cognitive and neurobiologic markers of early Alzheimer disease. Proc. Natl. Acad. Sci. U.S.A. 93 13547–13551. 10.1073/pnas.93.24.13547 - DOI - PMC - PubMed
    1. Alzheimer’s Association (2022). What is Alzheimer’s Disease [Online]. Available online at: https://www.alz.org/alzheimers-dementia/what-is-alzheimers (accessed August 1, 2022).
    1. American Psychiatric Association (2000). Diagnostic and statistical manual of mental disorders: DSM-IV-TR. Washington, DC: American Psychiatric Association.
    1. Arenaza-Urquijo E. M., Vemuri P. (2018). Resistance vs resilience to Alzheimer disease: Clarifying terminology for preclinical studies. Neurology 90 695–703. 10.1212/wnl.0000000000005303 - DOI - PMC - PubMed
    1. Benedict R. H. B., Schretlen D., Groninger L., Dobraski M., Shpritz B. (1996). Revision of the brief visuospatial memory test: Studies of normal performance, reliability, and validity. Psychol. Assess. 8 145–153. 10.1037/1040-3590.8.2.145 - DOI