Identification and immune characteristics of molecular subtypes related to protein glycosylation in Alzheimer's disease
- PMID: 36408104
- PMCID: PMC9667030
- DOI: 10.3389/fnagi.2022.968190
Identification and immune characteristics of molecular subtypes related to protein glycosylation in Alzheimer's disease
Abstract
Background: Protein glycosylation has been confirmed to be involved in the pathological mechanisms of Alzheimer's disease (AD); however, there is still a lack of systematic analysis of the immune processes mediated by protein glycosylation-related genes (PGRGs) in AD.
Materials and methods: Transcriptomic data of AD patients were obtained from the Gene Expression Omnibus database and divided into training and verification datasets. The core PGRGs of the training set were identified by weighted gene co-expression network analysis, and protein glycosylation-related subtypes in AD were identified based on k-means unsupervised clustering. Protein glycosylation scores and neuroinflammatory levels of different subtypes were compared, and functional enrichment analysis and drug prediction were performed based on the differentially expressed genes (DEGs) between the subtypes. A random forest model was used to select important DEGs as diagnostic markers between subtypes, and a line chart model was constructed and verified in other datasets. We evaluated the differences in immune cell infiltration between the subtypes through the single-sample gene set enrichment analysis, analyzed the correlation between core diagnostic markers and immune cells, and explored the expression regulation network of the core diagnostic markers.
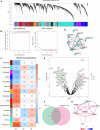
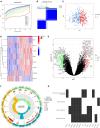
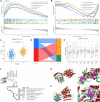
Results: Eight core PGRGs were differentially expressed between the training set and control samples. AD was divided into two subtypes with significantly different biological processes, such as vesicle-mediated transport in synapses and neuroactive ligand-receptor interactions. The high protein glycosylation subtype had a higher level of neuroinflammation. Riluzole and sulfasalazine were found to have potential clinical value in this subtype. A reliable construction line chart model was constructed based on nine diagnostic markers, and SERPINA3 was identified as the core diagnostic marker. There were significant differences in immune cell infiltration between the two subtypes. SERPINA3 was found to be closely related to immune cells, and the expression of SERPINA3 in AD was found to be regulated by a competing endogenous RNA network that involves eight long non-coding RNAs and seven microRNAs.
Conclusion: Protein glycosylation and its corresponding immune process play an important role in the occurrence and development of AD. Understanding the role of PGRGs in AD may provide a new potential therapeutic target for AD.
Keywords: Alzheimer’s disease; diagnostic model; immune cells; molecular subtypes; protein glycosylation-related genes.
Copyright © 2022 Ma, Yang, Fan, Li, Liu, Chen, Sun, Ma, Wang, Maihaiti and Ren.
Conflict of interest statement
The authors declare that the research was conducted in the absence of any commercial or financial relationships that could be construed as a potential conflict of interest.
Figures


Similar articles
-
New insight into protein glycosylation in the development of Alzheimer's disease.Cell Death Discov. 2023 Aug 25;9(1):314. doi: 10.1038/s41420-023-01617-5. Cell Death Discov. 2023. PMID: 37626031 Free PMC article. Review.
-
Identification and immune characteristics of molecular subtypes related to fatty acid metabolism in idiopathic pulmonary fibrosis.Front Nutr. 2022 Sep 23;9:992331. doi: 10.3389/fnut.2022.992331. eCollection 2022. Front Nutr. 2022. PMID: 36211517 Free PMC article.
-
Identification and prediction of m7G-related Alzheimer's disease subtypes: insights from immune infiltration and machine learning models.Front Aging Neurosci. 2023 Jun 16;15:1161068. doi: 10.3389/fnagi.2023.1161068. eCollection 2023. Front Aging Neurosci. 2023. PMID: 37396662 Free PMC article.
-
Establishing a competing endogenous RNA (ceRNA)-immunoregulatory network associated with the progression of Alzheimer's disease.Ann Transl Med. 2022 Jan;10(2):65. doi: 10.21037/atm-21-6762.. Ann Transl Med. 2022. PMID: 35282112 Free PMC article.
-
Identification of genetic molecular markers and immune infiltration characteristics of Alzheimer's disease through weighted gene co-expression network analysis.Front Neurol. 2022 Aug 22;13:947781. doi: 10.3389/fneur.2022.947781. eCollection 2022. Front Neurol. 2022. PMID: 36071897 Free PMC article.
Cited by
-
The role of peripheral innate immune cells in Alzheimer's disease progression.Front Immunol. 2025 Jul 16;16:1616939. doi: 10.3389/fimmu.2025.1616939. eCollection 2025. Front Immunol. 2025. PMID: 40740772 Free PMC article. Review.
-
Glycosylation in aging and neurodegenerative diseases.Acta Biochim Biophys Sin (Shanghai). 2024 Aug 15;56(8):1208-1220. doi: 10.3724/abbs.2024136. Acta Biochim Biophys Sin (Shanghai). 2024. PMID: 39225075 Free PMC article. Review.
-
Exploring SERPINA3 as a neuroinflammatory modulator in Alzheimer's disease with sex and regional brain variations.Metab Brain Dis. 2025 Jan 4;40(1):83. doi: 10.1007/s11011-024-01523-4. Metab Brain Dis. 2025. PMID: 39754632
-
New insight into protein glycosylation in the development of Alzheimer's disease.Cell Death Discov. 2023 Aug 25;9(1):314. doi: 10.1038/s41420-023-01617-5. Cell Death Discov. 2023. PMID: 37626031 Free PMC article. Review.
References
-
- Browne T. C., McQuillan K., McManus R. M., O’Reilly J. A., Mills K. H., Lynch M. A. (2013). IFN-γ Production by amyloid β-specific Th1 cells promotes microglial activation and increases plaque burden in a mouse model of Alzheimer’s disease. J. Immunol. 190 2241–2251. 10.4049/jimmunol.1200947 - DOI - PubMed
LinkOut - more resources
Full Text Sources
Miscellaneous

